2 、Logstash的简介
2.1 logstash 介绍
LogStash由JRuby语言编写,基于消息(message-based)的简单架构,并运行在Java虚拟机(JVM)上。不同于分离的代理端(agent)或主机端(server),LogStash可配置单一的代理端(agent)与其它开源软件结合,以实现不同的功能。
2.2 logStash的四大组件
-
Shipper:发送事件(events)至LogStash;通常,远程代理端(agent)只需要运行这个组件即可;
-
Broker and Indexer:接收并索引化事件;
-
Search and Storage:允许对事件进行搜索和存储;
-
Web Interface:基于Web的展示界面
-
正是由于以上组件在LogStash架构中可独立部署,才提供了更好的集群扩展性。
2.3、软件包下载网址:https://www.elastic.co/cn/downloads/logstash
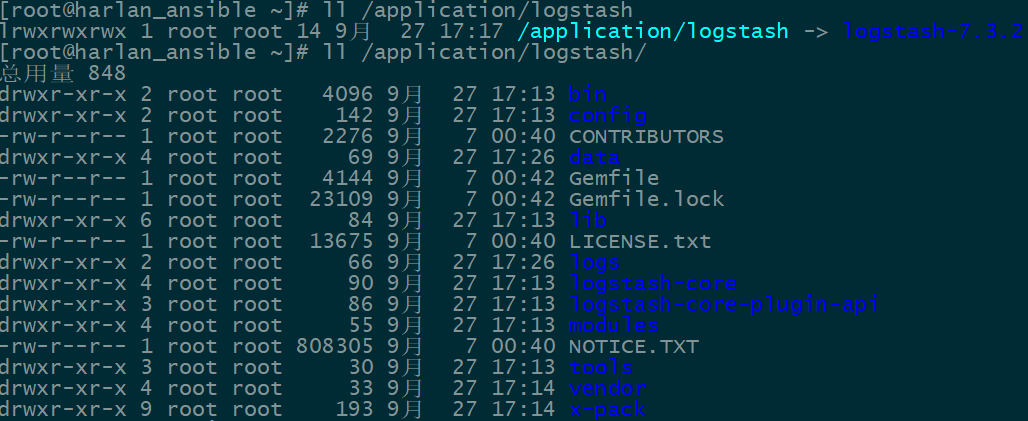
2.4、将下载的tar压缩包拷贝到/application/目录下,并创建软链接/application/logstash。

2.5、循环渐近的学习logstash
2.5.1 启动一个logstash,-e:在命令行执行;input输入,stdin标准输入,是一个插件;output输出,stdout:标准输出。默认输出格式是使用rubudebug显示详细输出,codec为一种编解码器
[root@harlan_ansible ~]# /application/logstash/bin/logstash -e 'input {stdin{}} output {stdout{}}'
OpenJDK 64-Bit Server VM warning: Option UseConcMarkSweepGC was deprecated in version 9.0 and will likely be removed in a future release.
WARNING: An illegal reflective access operation has occurred
WARNING: Illegal reflective access by com.headius.backport9.modules.Modules (file:/application/logstash-7.3.2/logstash-core/lib/jars/jruby-complete-9.2.7.0.jar) to field java.io.FileDescriptor.fd
WARNING: Please consider reporting this to the maintainers of com.headius.backport9.modules.Modules
WARNING: Use --illegal-access=warn to enable warnings of further illegal reflective access operations
WARNING: All illegal access operations will be denied in a future release
Thread.exclusive is deprecated, use Thread::Mutex
Sending Logstash logs to /application/logstash/logs which is now configured via log4j2.properties
[2019-09-27T21:37:51,409][WARN ][logstash.config.source.multilocal] Ignoring the 'pipelines.yml' file because modules or command line options are specified
[2019-09-27T21:37:51,440][INFO ][logstash.runner          ] Starting Logstash {"logstash.version"=>"7.3.2"}
[2019-09-27T21:37:53,020][INFO ][org.reflections.Reflections] Reflections took 88 ms to scan 1 urls, producing 19 keys and 39 values
[2019-09-27T21:37:53,865][WARN ][org.logstash.instrument.metrics.gauge.LazyDelegatingGauge] A gauge metric of an unknown type (org.jruby.RubyArray) has been create for key: cluster_uuids. This may result in invalid serialization.  It is recommended to log an issue to the responsible developer/development team.
[2019-09-27T21:37:53,868][INFO ][logstash.javapipeline    ] Starting pipeline {:pipeline_id=>"main", "pipeline.workers"=>2, "pipeline.batch.size"=>125, "pipeline.batch.delay"=>50, "pipeline.max_inflight"=>250, :thread=>"#<Thread:0x1b23cd0d run>"}
[2019-09-27T21:37:53,975][INFO ][logstash.javapipeline    ] Pipeline started {"pipeline.id"=>"main"}
The stdin plugin is now waiting for input:
[2019-09-27T21:37:54,143][INFO ][logstash.agent           ] Pipelines running {:count=>1, :running_pipelines=>[:main], :non_running_pipelines=>[]}
[2019-09-27T21:37:54,943][INFO ][logstash.agent           ] Successfully started Logstash API endpoint {:port=>9600}
hello word            #手动输入一串字符,然后下面在屏幕上会标准输出。
/application/logstash-7.3.2/vendor/bundle/jruby/2.5.0/gems/awesome_print-1.7.0/lib/awesome_print/formatters/base_formatter.rb:31: warning: constant ::Fixnum is deprecated
{
       "message" => "hello word",
      "@version" => "1",
    "@timestamp" => 2019-09-27T13:38:20.241Z,
          "host" => "harlan_ansible"
}
2.5.2 将屏幕输入的字符串输出到elasticsearch服务中
[root@harlan_ansible ~]# /application/logstash/bin/logstash -e 'input { stdin{} } output { elasticsearch { hosts => ["127.0.0.1:9200"] } }'
OpenJDK 64-Bit Server VM warning: Option UseConcMarkSweepGC was deprecated in version 9.0 and will likely be removed in a future release.
WARNING: An illegal reflective access operation has occurred
WARNING: Illegal reflective access by com.headius.backport9.modules.Modules (file:/application/logstash-7.3.2/logstash-core/lib/jars/jruby-complete-9.2.7.0.jar) to field java.io.FileDescriptor.fd
WARNING: Please consider reporting this to the maintainers of com.headius.backport9.modules.Modules
WARNING: Use --illegal-access=warn to enable warnings of further illegal reflective access operations
WARNING: All illegal access operations will be denied in a future release
Thread.exclusive is deprecated, use Thread::Mutex
Sending Logstash logs to /application/logstash/logs which is now configured via log4j2.properties
[2019-09-27T21:45:48,670][WARN ][logstash.config.source.multilocal] Ignoring the 'pipelines.yml' file because modules or command line options are specified
[2019-09-27T21:45:48,693][INFO ][logstash.runner          ] Starting Logstash {"logstash.version"=>"7.3.2"}
[2019-09-27T21:45:50,613][INFO ][org.reflections.Reflections] Reflections took 88 ms to scan 1 urls, producing 19 keys and 39 values
[2019-09-27T21:45:51,981][INFO ][logstash.outputs.elasticsearch] Elasticsearch pool URLs updated {:changes=>{:removed=>[], :added=>[http://127.0.0.1:9200/]}}
[2019-09-27T21:45:52,255][WARN ][logstash.outputs.elasticsearch] Restored connection to ES instance {:url=>"http://127.0.0.1:9200/"}
[2019-09-27T21:45:52,358][INFO ][logstash.outputs.elasticsearch] ES Output version determined {:es_version=>7}
[2019-09-27T21:45:52,378][WARN ][logstash.outputs.elasticsearch] Detected a 6.x and above cluster: the `type` event field won't be used to determine the document _type {:es_version=>7}
[2019-09-27T21:45:52,517][INFO ][logstash.outputs.elasticsearch] New Elasticsearch output {:class=>"LogStash::Outputs::ElasticSearch", :hosts=>["//127.0.0.1:9200"]}
[2019-09-27T21:45:52,765][INFO ][logstash.outputs.elasticsearch] Using default mapping template
[2019-09-27T21:45:52,779][WARN ][org.logstash.instrument.metrics.gauge.LazyDelegatingGauge] A gauge metric of an unknown type (org.jruby.specialized.RubyArrayOneObject) has been create for key: cluster_uuids. This may result in invalid serialization.  It is recommended to log an issue to the responsible developer/development team.
[2019-09-27T21:45:52,803][INFO ][logstash.javapipeline    ] Starting pipeline {:pipeline_id=>"main", "pipeline.workers"=>2, "pipeline.batch.size"=>125, "pipeline.batch.delay"=>50, "pipeline.max_inflight"=>250, :thread=>"#<Thread:0x228d3610 run>"}
[2019-09-27T21:45:53,020][INFO ][logstash.javapipeline    ] Pipeline started {"pipeline.id"=>"main"}
[2019-09-27T21:45:53,177][INFO ][logstash.outputs.elasticsearch] Attempting to install template {:manage_template=>{"index_patterns"=>"logstash-*", "version"=>60001, "settings"=>{"index.refresh_interval"=>"5s", "number_of_shards"=>1, "index.lifecycle.name"=>"logstash-policy", "index.lifecycle.rollover_alias"=>"logstash"}, "mappings"=>{"dynamic_templates"=>[{"message_field"=>{"path_match"=>"message", "match_mapping_type"=>"string", "mapping"=>{"type"=>"text", "norms"=>false}}}, {"string_fields"=>{"match"=>"*", "match_mapping_type"=>"string", "mapping"=>{"type"=>"text", "norms"=>false, "fields"=>{"keyword"=>{"type"=>"keyword", "ignore_above"=>256}}}}}], "properties"=>{"@timestamp"=>{"type"=>"date"}, "@version"=>{"type"=>"keyword"}, "geoip"=>{"dynamic"=>true, "properties"=>{"ip"=>{"type"=>"ip"}, "location"=>{"type"=>"geo_point"}, "latitude"=>{"type"=>"half_float"}, "longitude"=>{"type"=>"half_float"}}}}}}}
The stdin plugin is now waiting for input:
[2019-09-27T21:45:53,389][INFO ][logstash.outputs.elasticsearch] Installing elasticsearch template to _template/logstash
[2019-09-27T21:45:53,499][INFO ][logstash.agent           ] Pipelines running {:count=>1, :running_pipelines=>[:main], :non_running_pipelines=>[]}
[2019-09-27T21:45:54,409][INFO ][logstash.agent           ] Successfully started Logstash API endpoint {:port=>9600}
[2019-09-27T21:45:55,368][INFO ][logstash.outputs.elasticsearch] Creating rollover alias <logstash-{now/d}-000001>
[2019-09-27T21:45:56,899][INFO ][logstash.outputs.elasticsearch] Installing ILM policy {"policy"=>{"phases"=>{"hot"=>{"actions"=>{"rollover"=>{"max_size"=>"50gb", "max_age"=>"30d"}}}}}} to _ilm/policy/logstash-policy
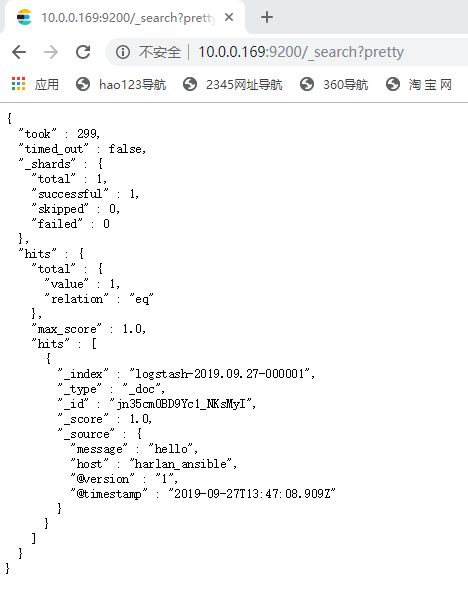
hello    #手动输入一个字符串。
通过浏览器访问地址:http://10.0.0.169:9200/_search?pretty

恭喜,至此你已经成功利用Elasticsearch和Logstash来收集日志数据了。
2.6、 收集系统日志的conf
conf文件放置在/application/logstash/bin/目录下,具体配置如下:
input {
    file {
        path => "/var/log/messages"
        type => "system"
        start_position => "beginning"
    }
    file {
        path => "/application/es/to/logs/elasticsearch.log"
        type => "es-error"
        start_position => "beginning"
    }
}
output {
    if [type] == "system" {
        elasticsearch {
            hosts => ["10.0.0.169:9200"]
            index => "system-%{+YYYY.MM.dd}"
        }
    }
    if [type] == "es-error" {
        elasticsearch {
            hosts => ["10.0.0.169:9200"]
            index => "es-error-%{+YYYY.MM.dd}"
        }
    }
}
执行命令启动logstash服务:
/application/logstash/bin/logstash -f logstash.conf