Prometheus介绍
(1)Prometheus由来
普罗米修斯的灵感来自于谷歌的Borgmon。它最初是由马特·t·普劳德(Matt T. Proud)作为一个研究项目开发的,普劳德曾是谷歌(google)的一名雇员。在普劳德加入SoundCloud之后,他与另一位工程师朱利叶斯•沃尔兹(Julius Volz)合作, 认真开发普罗米修斯。其他开发人员也参与了这项工作,并继续在SoundCloud内部进行开发,最终于2015年1月公开 发布。
(2)Prometheus架构

- Prometheus Server:用于收集和存储时间序列数据。
- PushGateway:主要用于短期的 jobs。由于这类 jobs 存在时间较短,可能在 Prometheus 来 pull 之前就消失了。为此,这次 jobs 可以直接向 Prometheus server 端push metrics。
- Exporters:Exporter是Prometheus的一类数据采集组件的总称。它负责从目标处搜集数据,并将其转化为Prometheus支持的格式。与传统的数据采集组件不同的是,它并不向中央服务器发送数据,而是等待中央服务器主动前来抓取。
- Alertmanager:从 Prometheus server 端接收到 alerts 后,会进行去除重复数据,分组,并路由到对收的接受方式,发出报警。常见的接收方式有:电子邮件,pagerduty,OpsGenie, webhook 等。
(3)Prometheus基本原理
Prometheus的基本原理是通过HTTP协议周期性抓取被监控组件的状态,任意组件只要提供对应的HTTP接口就可以接入监控。不需要任何SDK或者其他的集成过程。这样做非常适合做虚拟化环境监控系统,比如VM、Docker、Kubernetes等。输出被监控组件信息的HTTP接口被叫做exporter 。目前互联网公司常用的组件大部分都有exporter可以直接使用,比如Varnish、Haproxy、Nginx、MySQL、Linux系统信息(包括磁盘、内存、CPU、网络等等)。
Prometheus安装
Prometheus Server端安装
1.下载:
wget https://github.com/prometheus/prometheus/releases/download/v2.8.0/prometheus-2.8.0.linux-amd64.tar.gz
tar xf prometheus-2.8.0.linux-amd64.tar.gz -C /usr/local/
mv /usr/local/prometheus-2.8.0.linux-amd64 /usr/local/prometheus
mkdir /usr/local/prometheus/data     #数据存放目录
2.使用screen来管理Prometheus
yum -y install screen
screen     #打开一个新的窗口
/usr/local/prometheus/prometheus --web.listen-address="0.0.0.0:9090" --web.read-timeout=5m --web.max-connections=10 --storage.tsdb.retention=15d  --storage.tsdb.path="data/"   --query.max-concurrency=20   --query.timeout=2m   #C-a d  退出窗口,screen -ls查看后台进程
3.启动参数说明
--web.read-timeout=5m #请求链接的最⼤等待时间,防⽌太多的空闲链接 占⽤资源
--web.max-connections=512 #最⼤链接数
--storage.tsdb.retention=15d  #prometheus开始采集监控数据后,对于保留期限的设置
--storage.tsdb.path="data/"  #存储数据路径,wal目录保存着按照⼀定间隔的内存中近期的监控数据
--query.timeout=2m   #防⽌单个⽤户执⾏过慢的查询
--query.max-concurrency=20  #允许多少用户同时查询
注:prometheus 对系统时间⾮常敏感,⼀定要时刻保证系统时间同步,不然曲线是乱的
Prometheus Client端安装 node_export插件
wget https://github.com/prometheus/node_exporter/releases/download/v0.17.0/node_exporter-0.17.0.linux-amd64.tar.gz
tar xf node_exporter-0.17.0.linux-amd64.tar.gz -C /usr/local/
mv /usr/local/node_exporter-0.17.0.linux-amd64 /usr/local/node_exporter
2.使用screen来管理Prometheus
yum -y install screen
screen  #打开一个新的窗口
./node_exporter --collector.systemd
Prometheus配置文件说明
# 全局配置
global:
  scrape_interval:     15s   # 多长时间抓取一次数据
  evaluation_interval: 15s   # 多长时间评估一次报警规则
  scrape_timeout:      10s   # 每次抓取数据的超时时间
# 告警配置
alerting:
  ...  #这里我们不使用prometheus自带的告警,使用无需关注
# 告警规则
rule_files:
  ...  #制定了规则所在的位置,prometheus可以根据这个配置加载规则
# 定义Promeetheus监控那些资源
scrape_configs:
  - job_name: 'prometheus'
    static_configs:
    - targets: ['localhost:9090']   #监控prometheus本身的健康情况
#添加客户端监控
  - job_name: 'test'
    static_configs:
    - targets: ['jenkins:9100','gitlab:9100']   #此处主机名需要在/etc/hosts上定义。
注: 修改完配置文件需要重启prometheus, web上输入PrometheusIP:Prot查看页面。
Pushgateway
(1) pushgateway介绍
Pushgateway是Prometheus 生态中一个重要工具,使用它的原因主要是:
- Prometheus 采用 pull 模式,可能由于不在一个子网或者防火墙原因,导致 Prometheus 无法直接拉取各个 target 数据。
- 在监控业务数据的时候,需要将不同数据汇总, 由 Prometheus 统一收集。
Pushgateway缺点:
- Prometheus拉取状态UP只能针对Pushgateway,无法做到对每个节点有效。
- 将多个节点数据汇总到pushgateway, 如果pushgateway宕机,受影响比多个target大。
Pushgateway的客户端采用push方式将数据发送到服务端,Prometheus只需要到Pushgateway拉取数据即可。Pushgateway可以单独运⾏在任何节点上的插件(并不⼀定要在被监控客户端)
(2) pushgateway安装
wget http://github.com/prometheus/pushgateway/releases/download/v0.7.0/pushgateway-0.7.0.linux-amd64.tar.gz
tar xf pushgateway-0.7.0.linux-amd64.tar.gz -C /usr/local/
mv /usr/local/pushgateway-0.7.0.linux-amd64 /usr/local/pushgateway
screen
/usr/local/pushgateway/pushgateway
(3) Prometheus配置文件引用pushgateway
[root@nagios ~]# tail -3 /usr/local/prometheus/prometheus.yml
  - job_name: 'pushgateway'
    static_configs:
    - targets: ['localhost:9091']
#因为我将pushgateway装到了prometheus机器上所以使用的主机名是localhost,端口默认是9091。
#需要重启prometheus。
(4) 客户端自定义脚本推送数据到pushgateway
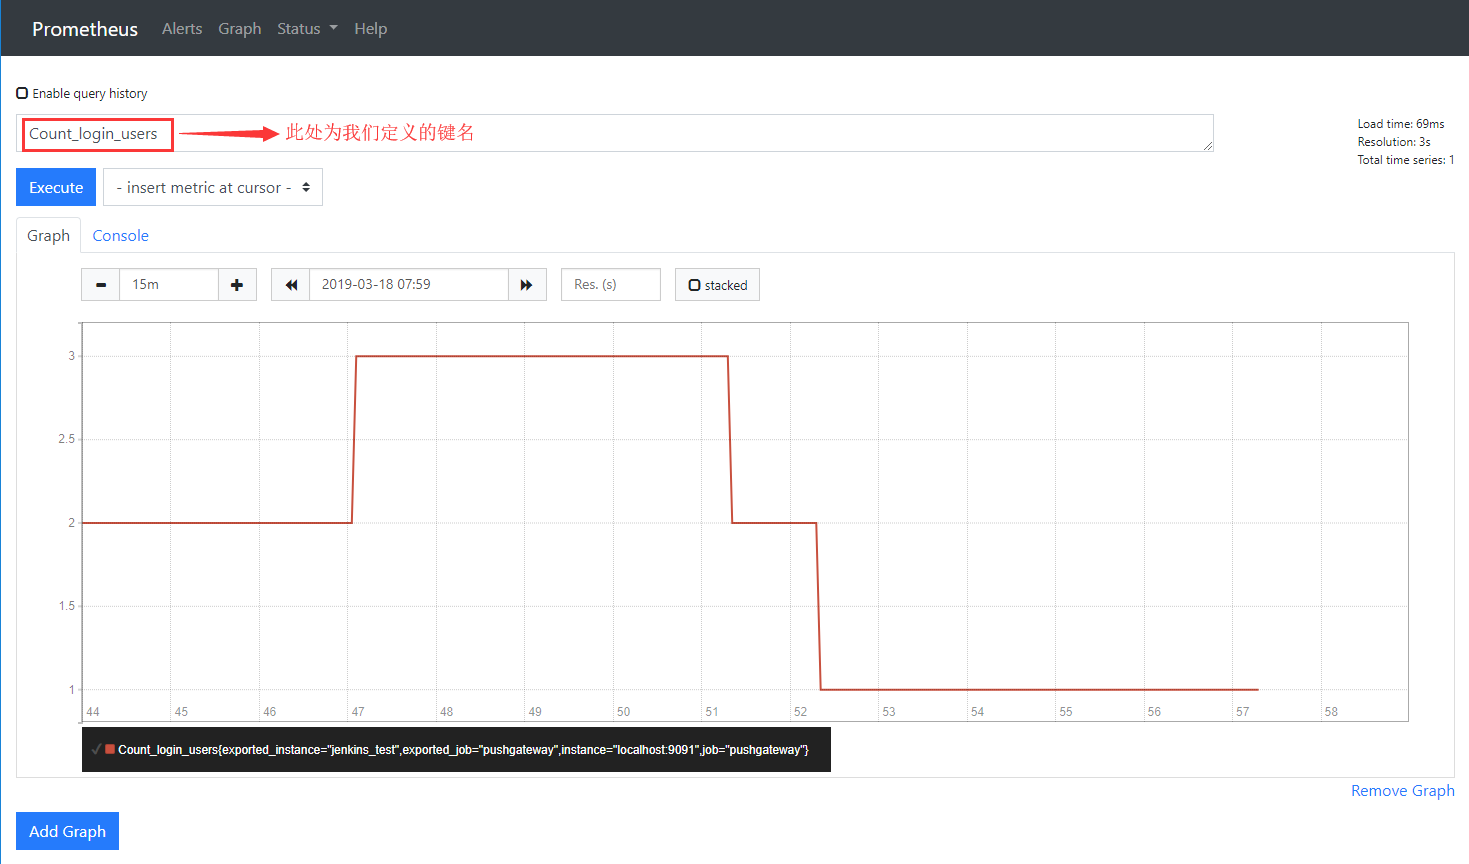
我们来写一个监控客户端主机登陆用户数量的脚本,将数据推送到pushgateway
[root@jenkins_test ~]# cat user_login.sh
#!/bin/bash
count=$(w| awk 'NR==1{print $4}')
label="Count_login_users"
instance_name=$(hostname)
echo "$label $count" | curl --data-binary @- http://192.168.18.213:9091/metrics/job/pushgateway/instance/$instance_name

#job/pushgateway  推送到prometheus.yml的哪一个job⾥。
#instance/$instance_name 推送后显⽰的机器名是什么。
(5) 客户端定时推送数据
编写的监控bash脚本是⼀次性执⾏的bash,我们需要按时间段反复执⾏,所以呢?⾃然就得结合contab了。但是crontab默认只能最短⼀分钟的间隔,如果希望⼩于⼀分钟的间隔15s,可以使用如下方法:

[root@jenkins_test ~]# cat user_login.sh
#!/bin/bash
for((i=1;i<=4;i++));
  do
  count=$(w| awk 'NR==1{print $4}')
  label="Count_login_users"
  instance_name=$(hostname)
  echo "$label $count" | curl --data-binary @- http://192.168.18.213:9091/metrics/job/pushgateway/instance/$instance_name
  sleep 15        #等待15秒
done

[root@jenkins_test ~]# crontab -l
* * * * * /bin/bash /root/user_login.sh  &>/dev/null
(6) Prometheus页面查看数据
Grafana
(1) Grafana介绍
Grafana是一个跨平台的开源的度量分析和可视化工具,可以通过将采集的数据查询然后可视化的展示,并及时通知。它主要有以下几个特点:
- 展示方式:快速灵活的客户端图表,面板插件有许多不同方式的可视化指标和日志,官方库中具有丰富的仪表盘插件,比如热图、折线图、图表等多种展示方式;
- 数据源:Graphite,InfluxDB,OpenTSDB,Prometheus,Elasticsearch,CloudWatch和KairosDB等;
- 通知提醒:4.0之后的添加了报警功能,可以以可视方式定义最重要指标的警报规则,Grafana将不断计算并发送通知,在数据达到阈值时通过Slack、PagerDuty等获得通知;
- 混合展示:在同一图表中混合使用不同的数据源,可以基于每个查询指定数据源,甚至自定义数据源;
- 注释:使用来自不同数据源的丰富事件注释图表,将鼠标悬停在事件上会显示完整的事件元数据和标记;
(2) Grafana安装(安装特别简单)
wget https://dl.grafana.com/oss/release/grafana-6.0.1-1.x86_64.rpm  #最新版本
yum localinstall -y grafana-6.0.1-1.x86_64.rpm
#安装饼图插件
cd /var/lib/grafana/plugins/
git clone https://github.com/grafana/piechart-panel.git
#修改配置文件
vim /etc/grafana/grafana.ini
root_url = http://192.168.18.213:3000    #将localhost改为grafana服务端地址
#启动Grafana
systemctl start grafana-server.service
systemctl enable grafana-server.service
注: 默认运行在3000端口,web上输入IP:Prot查看页面,初始账号密码为admin/admin。
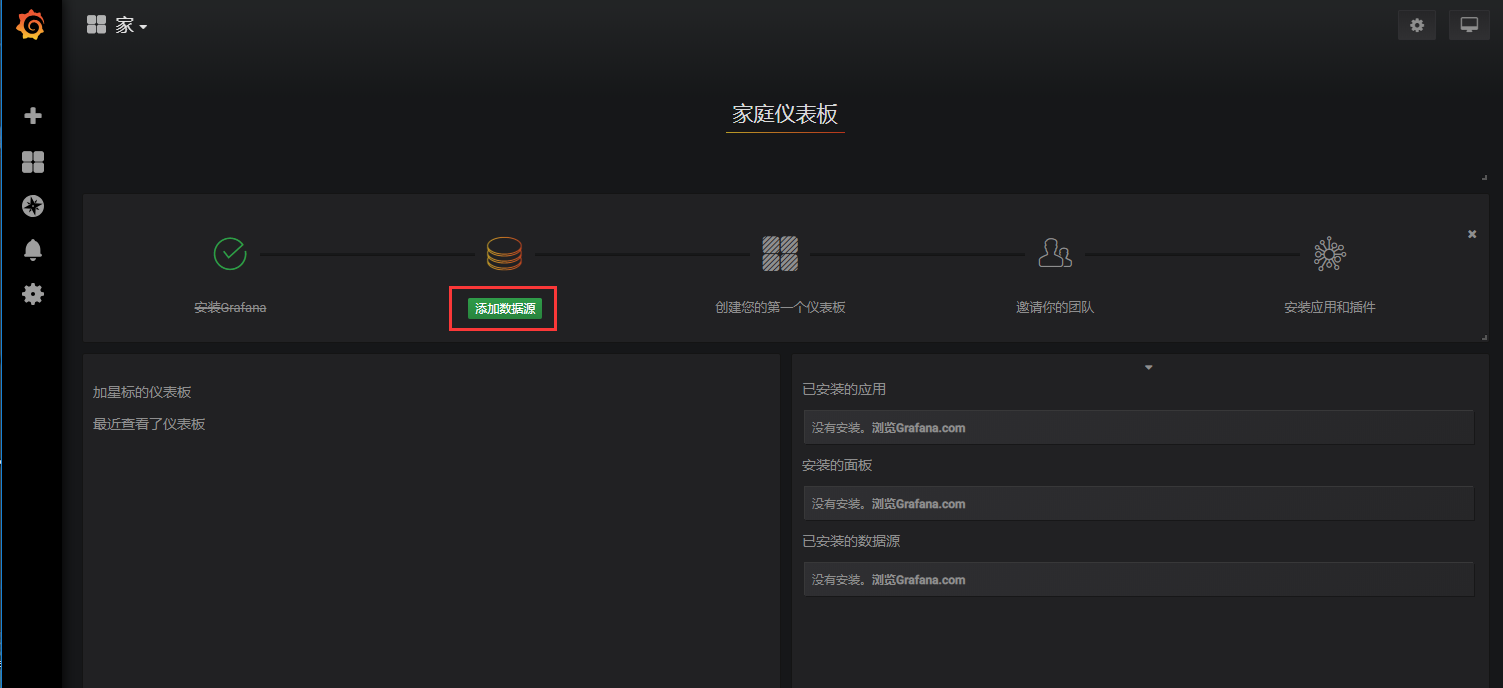
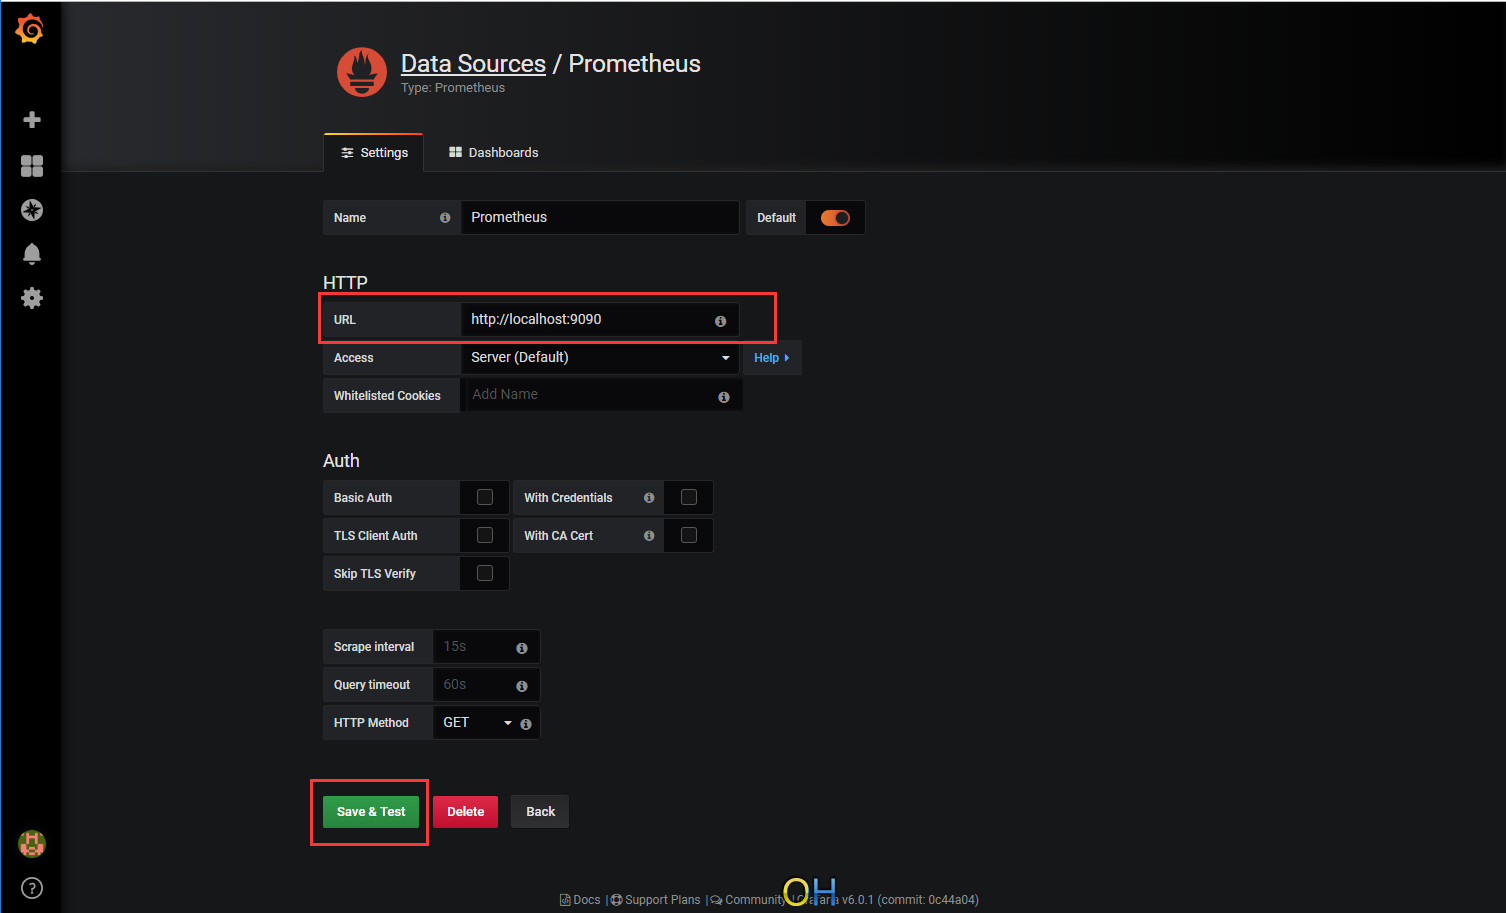
(3) Grafana配置连接Prometheus数据源
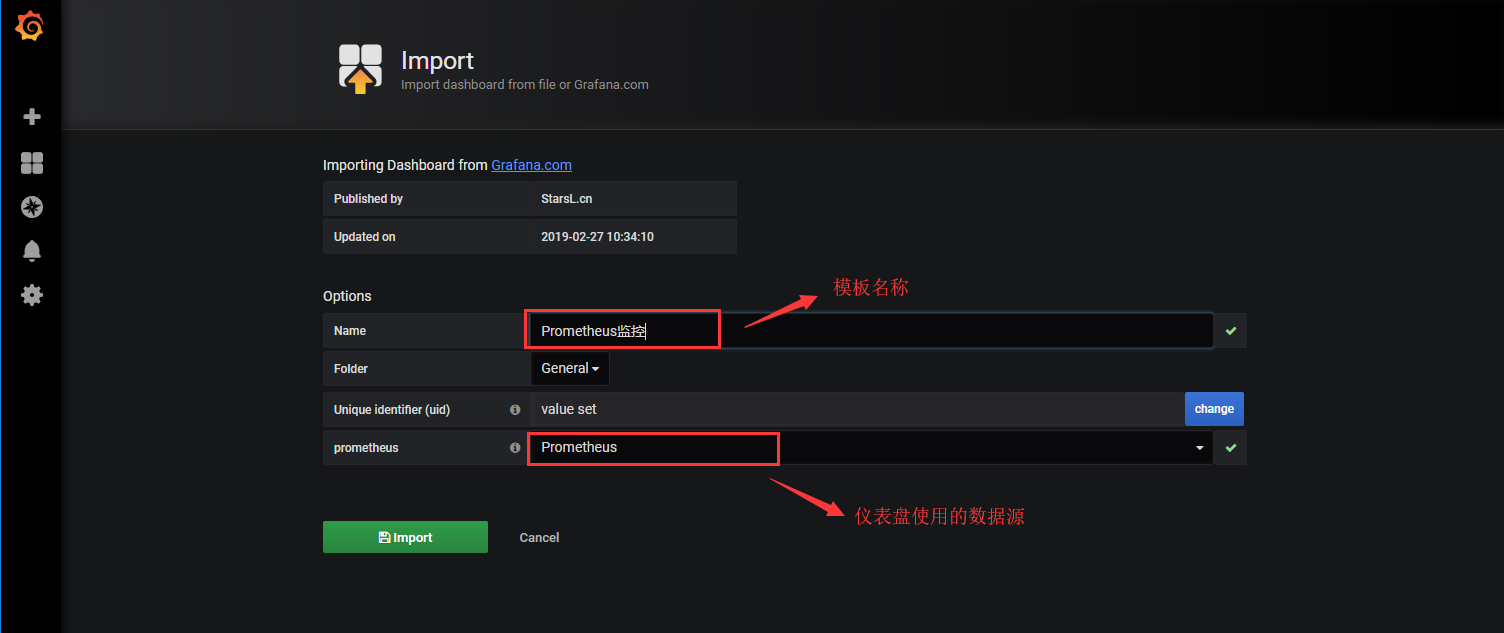
(4) Grafana导入仪表盘

编辑仪表盘属性
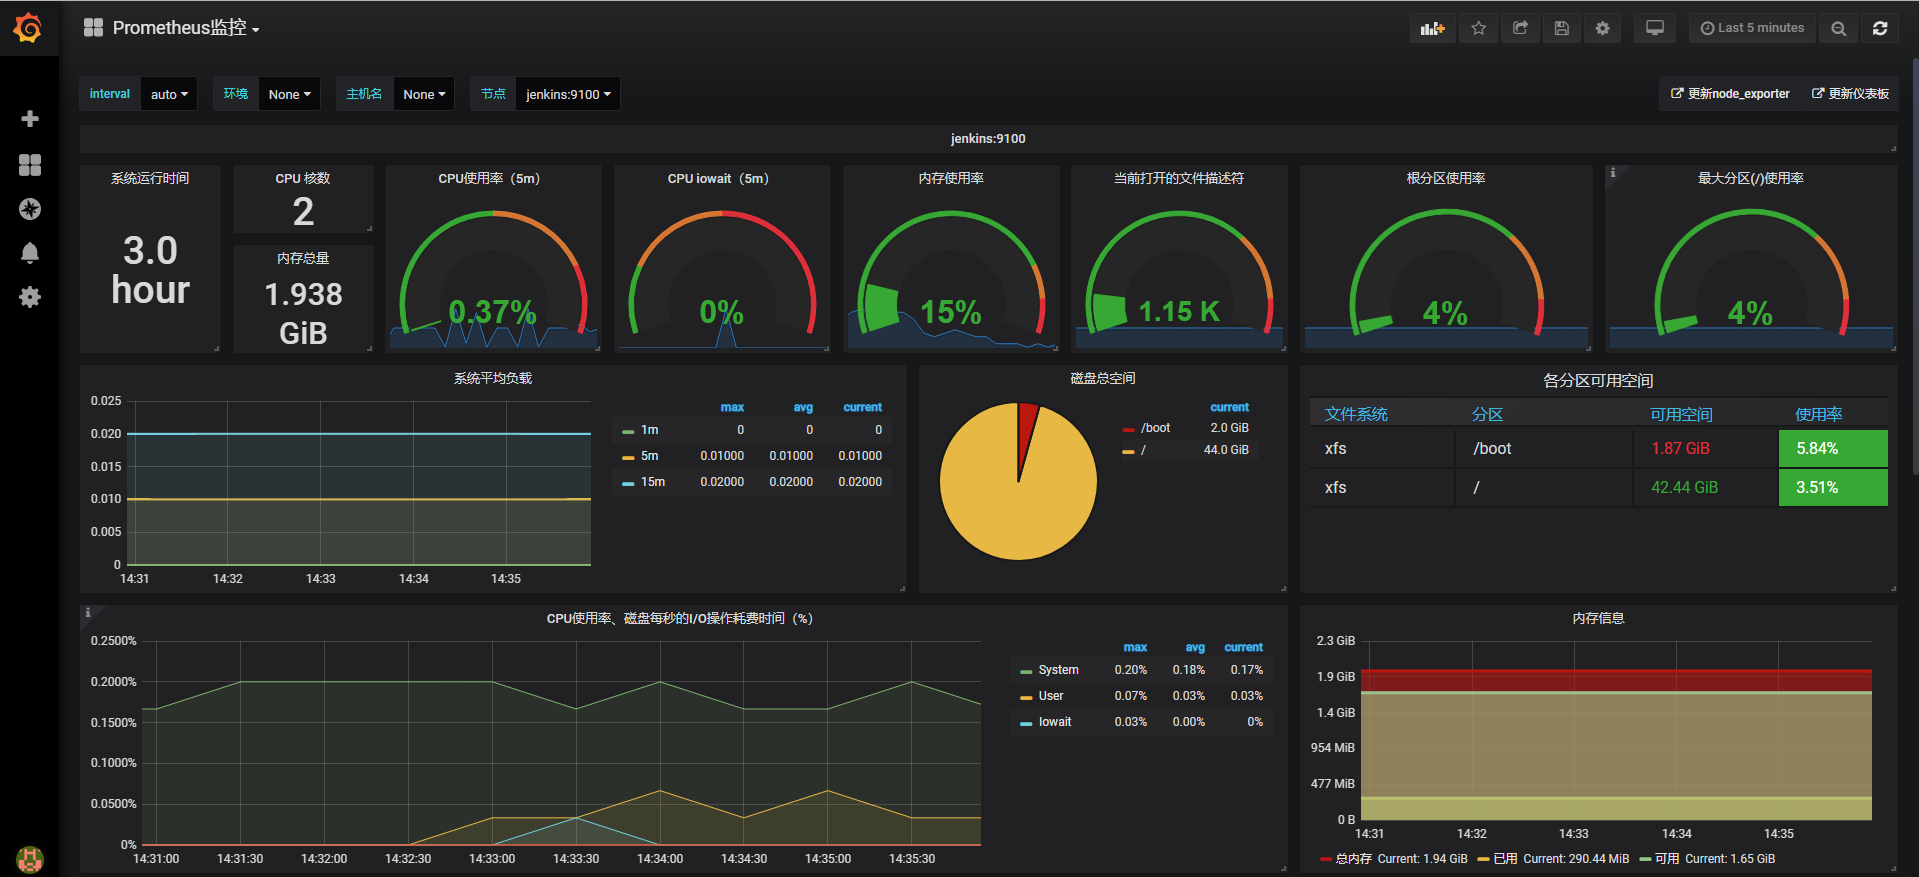
(5) 查看页面展示效果