平时都会去逛虎扑,对虎扑的这个吃遍盖饭的系列挺感兴趣的,所以想把这个系列的相关数据抓取下来分析一下,也充实一下自己的知识。
首先看一下这个帖子是怎样的,打开虎扑app,直接进去到个人主页这里,可以看到一共吃到了202天了,继续下拉,可以获取到全部的帖子。
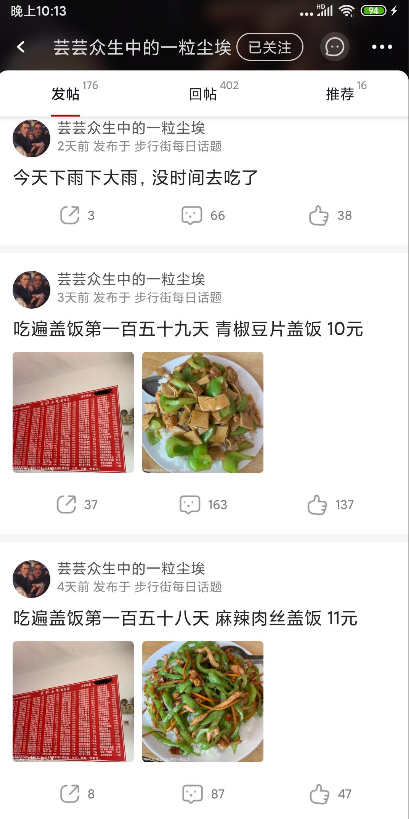
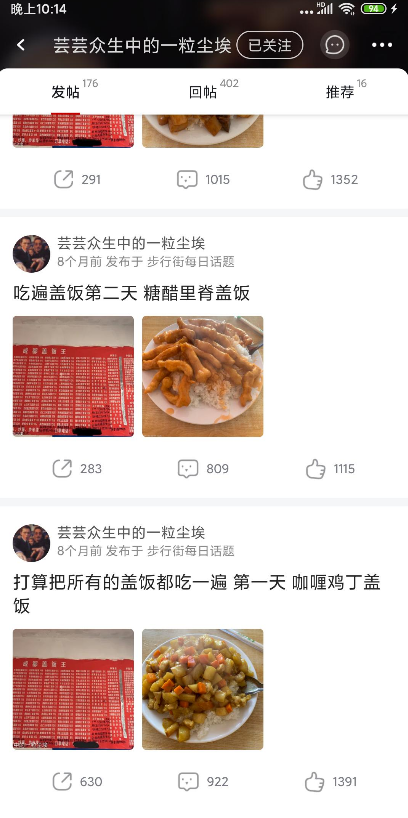
进去到帖子里面看看,大部分的帖子都会有投票,这个需要投票才会显示票数,但是即使没投票也可以在网页端可以通过接口取到。
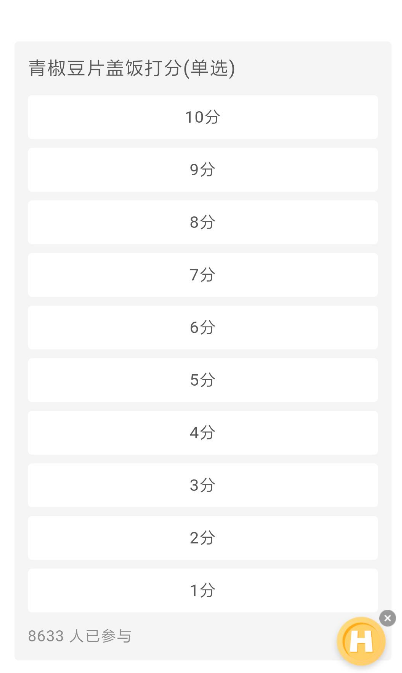
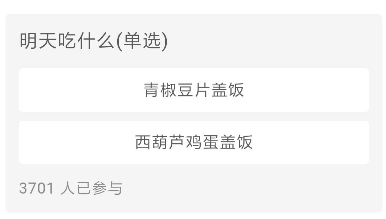

继续下拉会有被点亮的回复,以及全部回复。(虎扑这个广告是真鸡儿烦人)


好了,帖子的样式都基本一致,那么先来定义一下需要的表格和字段:
posts:tid(帖子id)、title(帖子名称)、name(菜名)、create_time(发帖时间)、lastpost(最后评论时间)、read(阅读量)、comments(评论数)、share(分享数)、recommend(推荐数)、number_of_scores(打分人数)、 number_of_votes(投票人数)
dishes:tid(帖子id)、name(菜名)、price(价格)、avg_score(平均分数)、one(打1分的人数)、tow(打2分的人数)....ten(打10分的人数)
votes:tid(帖子id)、name(菜名): str,vote(票数): int, prop(比例): float
comments:tid(帖子id)、content(内容)、user_name(用户名)、user_id(用户id)、time(时间)、lights(点亮数)、reply(回复数)
定义完字段那么就先解决怎么获取数据的问题,虎扑的网页版获取数据比较简单,可以直接通过网页版来获取到需要的信息,先分析一下需要的接口。
首先是posts表,这个表的大部分信息都可以从个人主页里面获取到,都在https://my.hupu.com/pcmapi/pc/space/v1/getThreadList?euid=259452269228785&page=2&pageSize=30这一个接口里面,只需要一个euid就可以了。
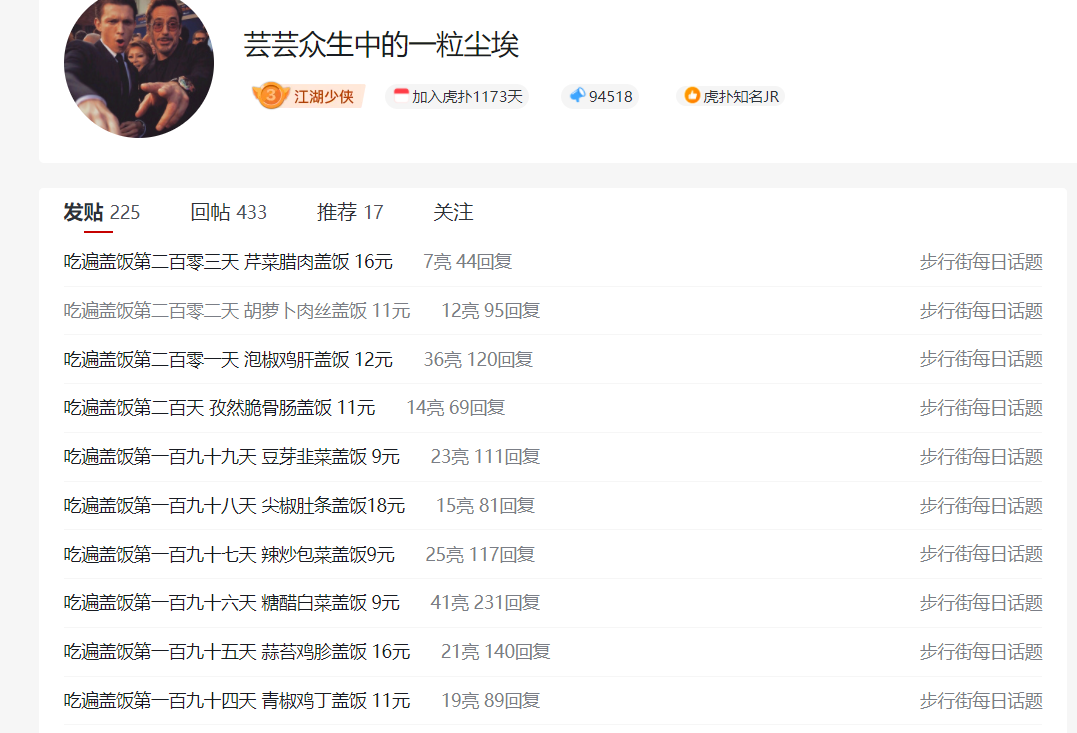

并且dishes表的帖子id,菜名,价格也都可以在这里面提取出来,那么posts表就剩下打分人数和投票人数,dishes表就剩下1-10分的人数还有平均分,这两个都是在投票的接口里面。
投票的接口是这个https://bbs.mobileapi.hupu.com/3/7.5.2/bbsintapi/vote/v1/getVoteInfo?voteId=10407321,这里需要一个voteId,这个id可以在帖子的源码里面找到
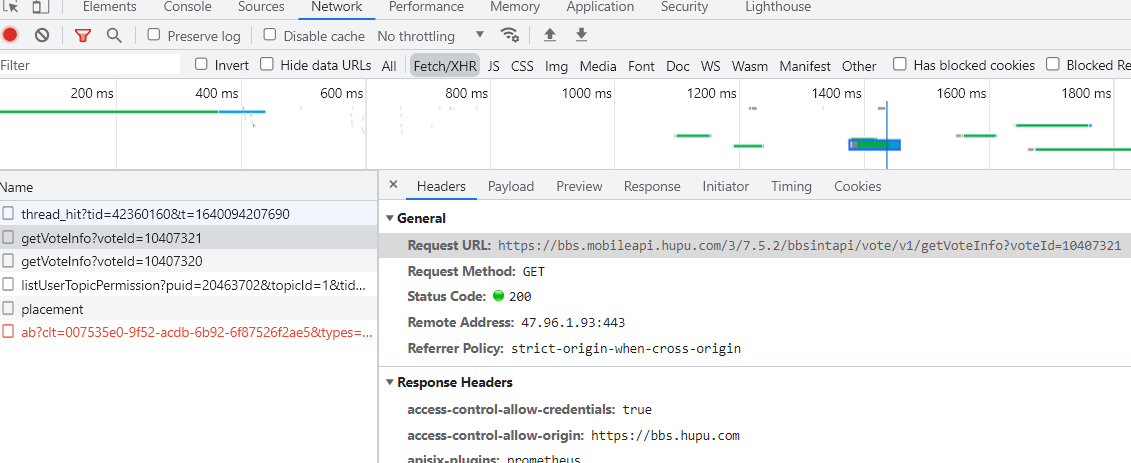
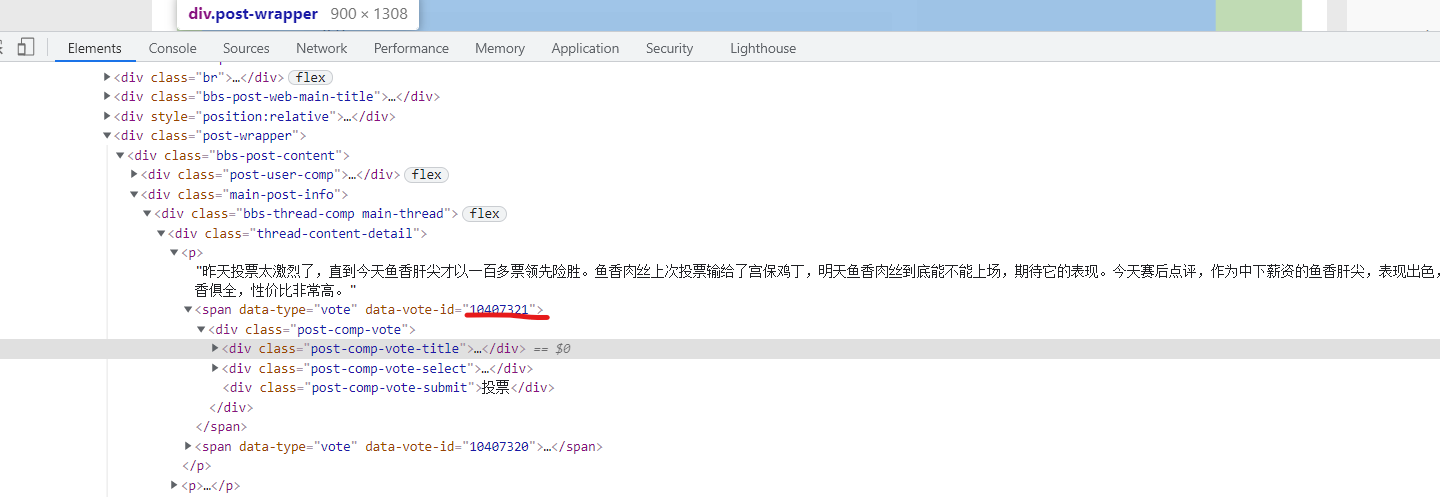
所以在获取投票的信息的时候先对帖子主页请求一次。
最后就是评论了,评论也是放在了源码里面,可以直接取到,第二页就是https://bbs.hupu.com/42360160-2.html,以此类推。

好了,知道数据在哪里之后,开始写代码。虎扑的爬虫比较简单,注意解析就可以了。
先定义好请求的模块。
这里只涉及到了get请求,但是也一起把post请求写了。requests.py
import time
import requests


class Requests:
    def __init__(self, cookie=''):
        self.session = requests.session()
        self.header = {
            'sec-ch-ua': '"Chromium";v="92", " Not A;Brand";v="99", "Google Chrome";v="92"',
            'accept': 'application/json, text/plain, */*',
            'sec-fetch-site': 'same-origin',
            'sec-fetch-mode': 'cors',
            'sec-fetch-dest': 'empty',
            'accept-language': 'en-US,en;q=0.9,zh-CN;q=0.8,zh-TW;q=0.7,zh;q=0.6',
            'cookie': cookie,
            'user-agent': 'Mozilla/5.0 (Windows NT 10.0; Win64; x64) AppleWebKit/537.36 (KHTML, like Gecko) Chrome/96.0.4664.110 Safari/537.36'
        }

    def __get(self, url):
        try:
            time.sleep(10)
            resp = self.session.get(url, headers=self.header)
            return resp
        except Exception as err:
            return None

    def __post(self, url, data):
        try:
            self.header.update({"Content-Type": "application/json;charset=UTF-8"})
            resp = self.session.post(url, data=data, headers=self.header)
            return resp
        except Exception as err:
            return None

    # 请求个人主页
    def get_posts(self, user_id, page=1):
        url = 'https://my.hupu.com/pcmapi/pc/space/v1/getThreadList?euid={}&page={}&pageSize=30'.format(user_id, page)
        resp = self.__get(url)
        return resp

    # 请求投票接口
    def get_vote(self, vote_id):
        url = 'https://bbs.mobileapi.hupu.com/3/7.5.2/bbsintapi/vote/v1/getVoteInfo?voteId={}'.format(vote_id)
        resp = self.__get(url)
        return resp

    # 请求帖子
    def get_post(self, tid):
        url = 'https://bbs.hupu.com/{}.html'.format(tid)
        resp = self.__get(url)
        return resp
请求到数据之后就是解析数据了,解析出自己需要的数据。parse.py
import logging
import re
import time
import json
from lxml import etree

logging.basicConfig(level=logging.DEBUG,#控制台打印的日志级别
                    filename='run_comment.log',
                    filemode='a',##模式,有w和a,w就是写模式,每次都会重新写日志,覆盖之前的日志
                    #a是追加模式,默认如果不写的话,就是追加模式
                    format=
                    '%(asctime)s - %(pathname)s[line:%(lineno)d] - %(levelname)s: %(message)s'
                    #日志格式
                    )


# 解析主页
def parse_posts(resp):
    try:
        posts_items = []
        data = json.loads(resp)
        if data['data']:
            for data in data['data']:
                posts_item = {}
                if '盖饭' not in data['title']:
                    continue
                posts_item['tid'] = data['tid']
                posts_item['title'] = data['title']
                name = re.search(' .*盖饭', data['title'])
                posts_item['name'] = name.group(0).strip() if name else ''
                posts_item['create_time'] = time.strftime('%Y-%m-%d %H:%M:%S', time.localtime(int(data['create_time'])))
                posts_item['lastpost_time'] = time.strftime('%Y-%m-%d %H:%M:%S',
                                                            time.localtime(int(data['lastpost_time'])))
                posts_item['read'] = int(data['visits'])
                posts_item['comments'] = int(data['replies'])
                posts_item['share'] = int(data['share_num'])
                posts_item['recommend'] = int(data['recommend_num'])

                posts_items.append(posts_item)
        return posts_items
    except Exception as err:
        logging.error(err)
        return None, None


# 解析投票接口
def parse_voted(resp, tid):
    try:
        items = []
        data = json.loads(resp)

        if '打分' in data['data']['title']:
            item = {}

            item['tid'] = tid
            avg_score = 0
            item['one'] = int(data['data']['voteDetailList'][9]['optionVoteCount'])
            avg_score += item['one']
            item['two'] = int(data['data']['voteDetailList'][8]['optionVoteCount'])
            avg_score += item['two'] * 2
            item['three'] = int(data['data']['voteDetailList'][7]['optionVoteCount'])
            avg_score += item['three'] * 3
            item['four'] = int(data['data']['voteDetailList'][6]['optionVoteCount'])
            avg_score += item['four'] * 4
            item['five'] = int(data['data']['voteDetailList'][5]['optionVoteCount'])
            avg_score += item['five'] * 5
            item['six'] = int(data['data']['voteDetailList'][4]['optionVoteCount'])
            avg_score += item['six'] * 6
            item['seven'] = int(data['data']['voteDetailList'][3]['optionVoteCount'])
            avg_score += item['seven'] * 7
            item['eight'] = int(data['data']['voteDetailList'][2]['optionVoteCount'])
            avg_score += item['eight'] * 8
            item['nine'] = int(data['data']['voteDetailList'][1]['optionVoteCount'])
            avg_score += item['nine'] * 9
            item['ten'] = int(data['data']['voteDetailList'][0]['optionVoteCount'])
            avg_score += item['ten'] * 10
            item['avg_score'] = round(avg_score / int(data['data']['voteCount']), 3)

            items.append(item)

            return items, int(data['data']['voteCount'])

        else:

            for vote_detail in data['data']['voteDetailList']:
                item = {}
                item['tid'] = tid
                item['name'] = vote_detail['content']
                item['vote'] = int(vote_detail['optionVoteCount'])
                item['prop'] = round(item['vote'] / int(data['data']['voteCount']), 2)
                items.append(item)
            return items, int(data['data']['voteCount'])

    except Exception as err:
        logging.error(err)
        return None, None


# 获取投票id
def parse_post_vote(resp):
    try:
        html = etree.HTML(resp)
        spans = html.xpath('//div[@class="seo-dom"]//span//@data-vote-id')
        return spans
    except Exception as err:
        logging.error(err)
        return None


# 解析评论
def parse_post_comments(resp, tid):
    try:
        html = etree.HTML(resp)
        max_page = html.xpath('//div[@class="pagination"]//ul//li[last()-1]//text()')[0]
        items = []
        for comment in html.xpath('//div[@class="bbs-post-wrapper gray"]//div[@class="post-reply-list "]'):
            item = {}
            item['tid'] = tid
            item['user_name'] = comment.xpath('.//div[@class="user-base-info"]//a//text()')[0]
            item['user_id'] = comment.xpath('.//div[@class="user-base-info"]//a//@href')[0].split('/')[-1]
            item['time'] = comment.xpath('.//div[@class="user-base-info"]//span[last()]//text()')[0]
            item['content'] = ''.join(comment.xpath('.//div[@class="thread-content-detail"]//text()'))
            item['lights'] = int(
                re.search('\d+', ''.join(comment.xpath('.//div[@class="todo-list light "]//text()'))).group(0))
            reply = ''.join(comment.xpath('.//div[@class="todo-list todo-list-replay"]//text()'))
            if reply:
                item['reply'] = int(re.search('\d+', reply).group(0))
            else:
                item['reply'] = 0
            items.append(item)
        return items, int(max_page)
    except Exception as err:
        logging.error(err)
        return None
然后就是保存数据,我选择的是postgresql去保存数据。用了records框架去操作数据库。
import logging
import records


logging.basicConfig(level=logging.DEBUG,#控制台打印的日志级别
                    filename='run_comment.log',
                    filemode='a',##模式,有w和a,w就是写模式,每次都会重新写日志,覆盖之前的日志
                    #a是追加模式,默认如果不写的话,就是追加模式
                    format=
                    '%(asctime)s - %(pathname)s[line:%(lineno)d] - %(levelname)s: %(message)s'
                    #日志格式
                    )


class Save:
    def __init__(self):
        self.db = records.Database('postgresql://用户名:密码@数据库地址/数据库名')

    # 保存posts的数据
    def save_posts(self, data):
        try:
            self.db.bulk_query(
                '''insert into posts(tid, title, name, create_time, lastpost_time, read, comments, share, recommend)
                values(:tid, :title, :name, :create_time, :lastpost_time, :read, :comments, :share, :recommend)''',
                data
            )
            logging.info('commit {} posts success'.format(len(data)))
        except Exception as err:
            logging.error(err)

    # 保存dishes的数据,但是这里没有用上,因为可以直接在posts采集下来之后再解析出来
    def save_dishes(self, data):
        try:
            self.db.bulk_query(
                '''
                insert into dishes(tid, name, price) values(:tid, :name, :price)
                ''',
                data
            )
            logging.info('commit {} dishes success'.format(len(data)))
        except Exception as err:
            logging.error(err)

    # 保存votes的数据
    def save_votes(self, data):
        try:
            self.db.bulk_query(
                '''
                insert into votes(tid, name, vote, prop) values(:tid, :name, :vote, :prop)
                ''',
                data
            )
            logging.info('commit {} votes success'.format(len(data)))
        except Exception as err:
            logging.error(err)

    # 插入dishes的数据
    def update_dishes(self, data):
        try:
            self.db.bulk_query(
                '''
                update dishes set one=:one, two=:two, three=:three, four=:four, five=:five, six=:six, seven=:seven,
                eight=:eight, nine=:nine, ten=:ten, avg_score=:avg_score where tid=:tid
                ''',
                data
            )
            logging.info('update {} dishes success'.format(len(data)))
        except Exception as err:
            logging.error(err)

    # 插入posts的数据
    def update_posts(self, data):
        data = [data]
        try:
            self.db.bulk_query(
                '''
                update posts set number_of_votes=:number_of_votes, number_of_scores=:number_of_scores
                where tid=:tid
                ''',
                data
            )
            logging.info('update posts success')
        except Exception as err:
            logging.error(err)

    # 保存comments的数据
    def save_comments(self, data):
        try:
            self.db.bulk_query(
                '''
                insert into comments(tid, user_id, user_name, content, time, lights, reply) values
                (:tid, :user_id, :user_name, :content, :time, :lights, :reply)
                ''',
                data
            )
            logging.info('commit {} comments success'.format(len(data)))
        except Exception as err:
            logging.error(err)

    # 从dishes表获取tid
    def get_tid(self):
        try:
            tids = self.db.query('select tid from dishes', True).all(True)
            return tids
        except Exception as err:
            logging.error(err)
            return None

    def close(self):
        self.db.close()
最后就是运行了。run.py
import logging
from hupu_save import Save
import hupu_parse as parse
from hupu_requests import Requests

req = Requests()
save = Save()

logging.basicConfig(level=logging.DEBUG,#控制台打印的日志级别
                    filename='run_comment.log',
                    filemode='a',##模式,有w和a,w就是写模式,每次都会重新写日志,覆盖之前的日志
                    #a是追加模式,默认如果不写的话,就是追加模式
                    format=
                    '%(asctime)s - %(pathname)s[line:%(lineno)d] - %(levelname)s: %(message)s'
                    #日志格式
                    )


# 个人主页,生成posts表的内容
def posts(user_id):
    page = 1
    posts_datas = []
    while True:
        resp = req.get_posts(user_id, page=page)
        posts_items = parse.parse_posts(resp.text)
        if len(posts_items):
            page += 1
            posts_datas += posts_items
        else:
            break
    save.save_posts(posts_datas)


# 投票,生成voted表的内容,更新dishes表和posts
def voted(tid):
    resp = req.get_post(tid)
    vote_ids = parse.parse_post_vote(resp.text)
    posts_item = {
        'tid': tid
    }
    dishes_datas = []
    votes_datas = []
    for vote_id in vote_ids:
        resp = req.get_vote(vote_id)
        voted_items, vote_count = parse.parse_voted(resp.text, tid)
        if len(voted_items) == 1:
            posts_item['number_of_scores'] = vote_count
            dishes_datas += voted_items
        else:
            posts_item['number_of_votes'] = vote_count
            votes_datas += voted_items
    save.save_votes(votes_datas)
    save.update_dishes(dishes_datas)
    save.update_posts(posts_item)


# 评论,生成评论表的内容
def comments(tid):
    page = 1
    while True:
        url = tid
        if page != 1:
            url = tid + '-' + str(page)
        resp = req.get_post(url)
        comment_items, max_page = parse.parse_post_comments(resp.text, tid)
        save.save_comments(comment_items)
        if page == max_page:
            break
        page += 1


if __name__ == '__main__':
    # 第一步
    posts('259452269228785')
    # 第二步
    '''
        insert into dishes(tid, name, price) select tid, name, substring(title, '\d+') from posts;
    '''
    # 第三步
    rows = save.get_tid()

    for row in rows:
        tid = row['tid']
        try:
            comments(tid)
            logging.info('finish {}'.format(tid))
        except Exception as err:
            logging.error(err)
            continue

    for row in rows:
        tid = row['tid']
        try:
            voted(tid)
            logging.info('finish {}'.format(tid))
        except Exception as err:
            logging.error(err)
            continue

    save.close()
第一步运行完,可以得到posts表的数据,采集到一些不属于盖饭系列的文章,手动删除一下,
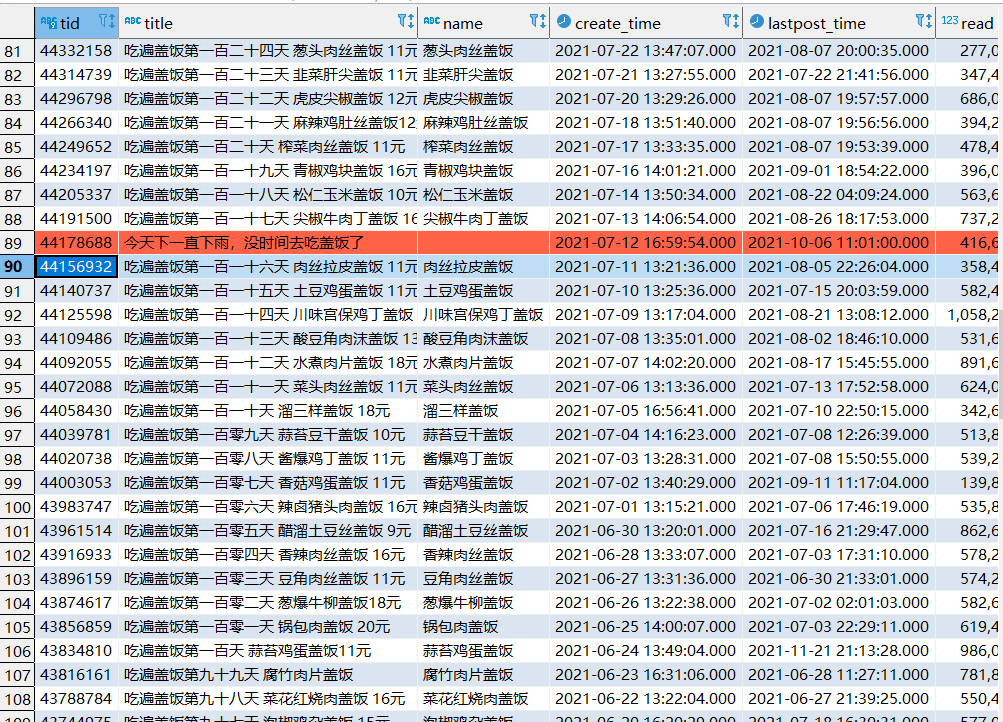
第二步执行sql语句,可以得到dishes表,一些标题没有写价格,所以有些数据解析出来也没有价格,需要手动补一下。

第三步,从dishes表获取帖子的id,然后对投票、打分、评论进行采集。最后可以得到完整的三张数据表。
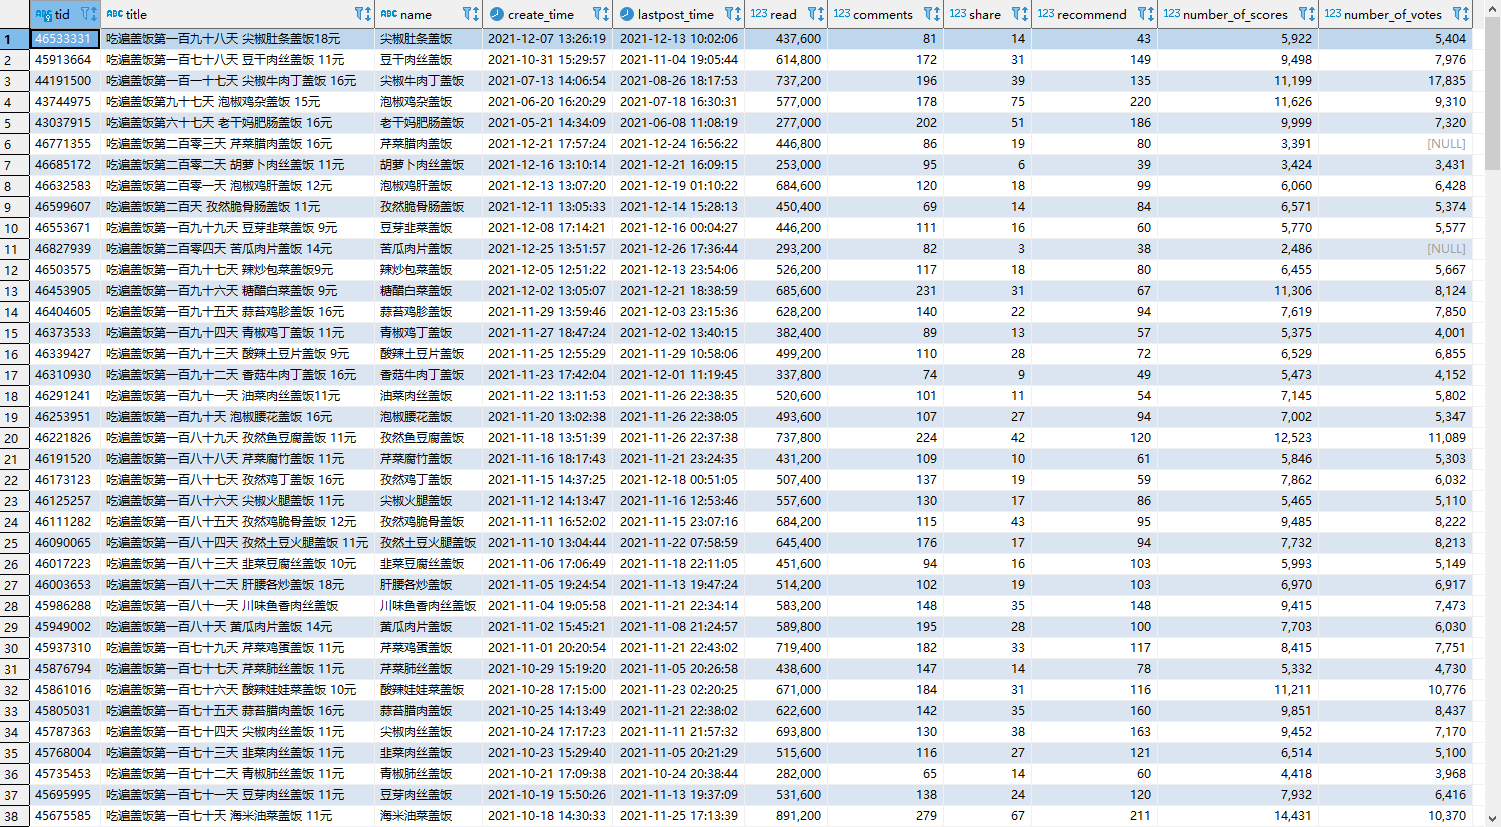
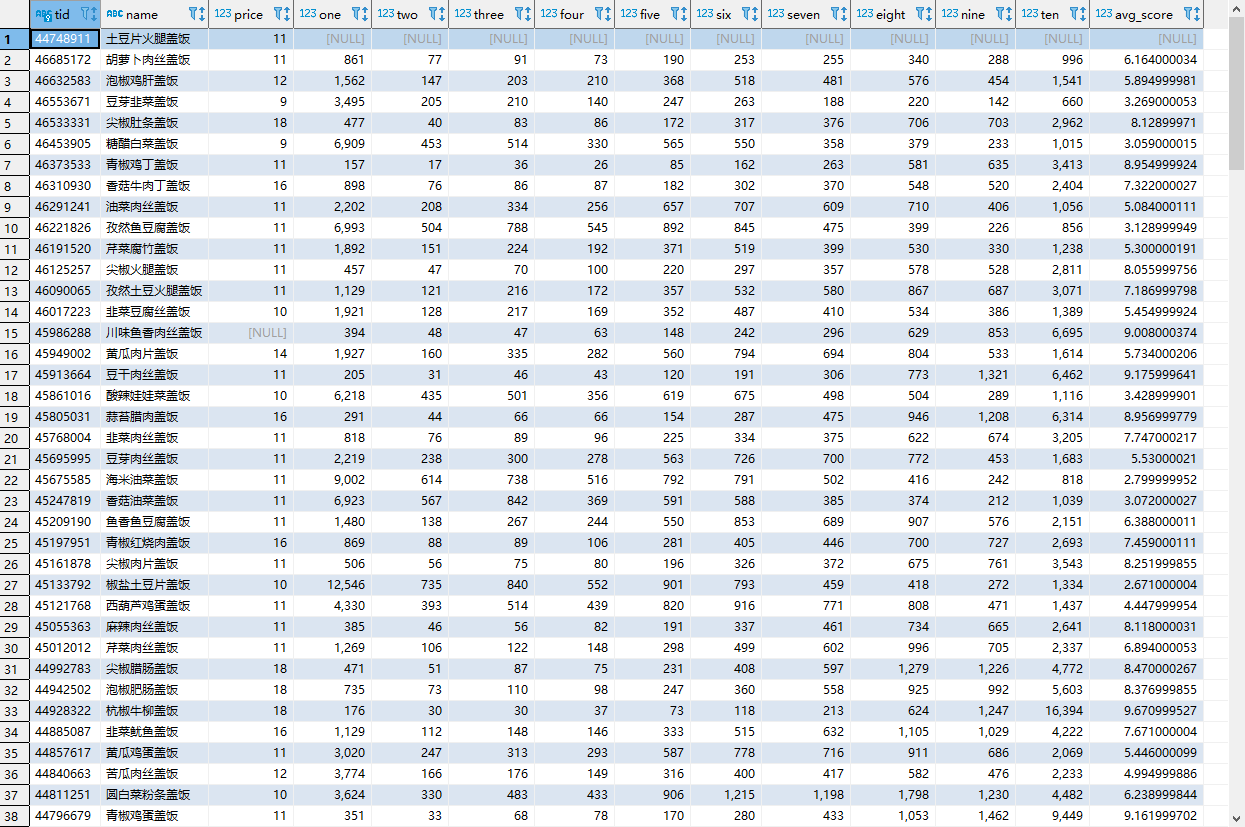
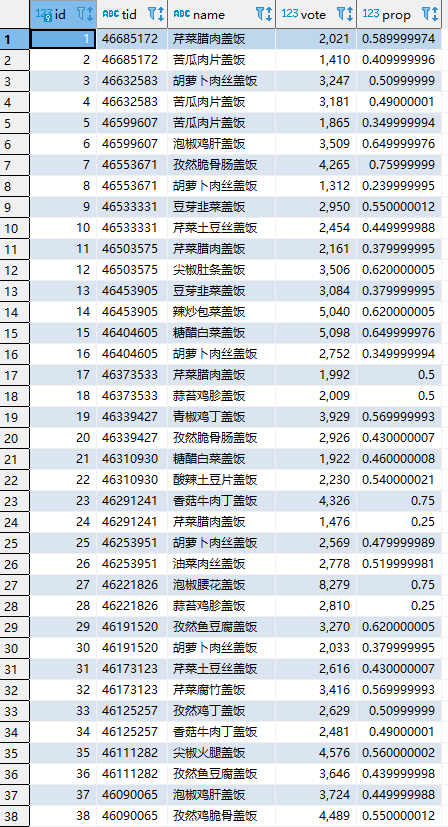
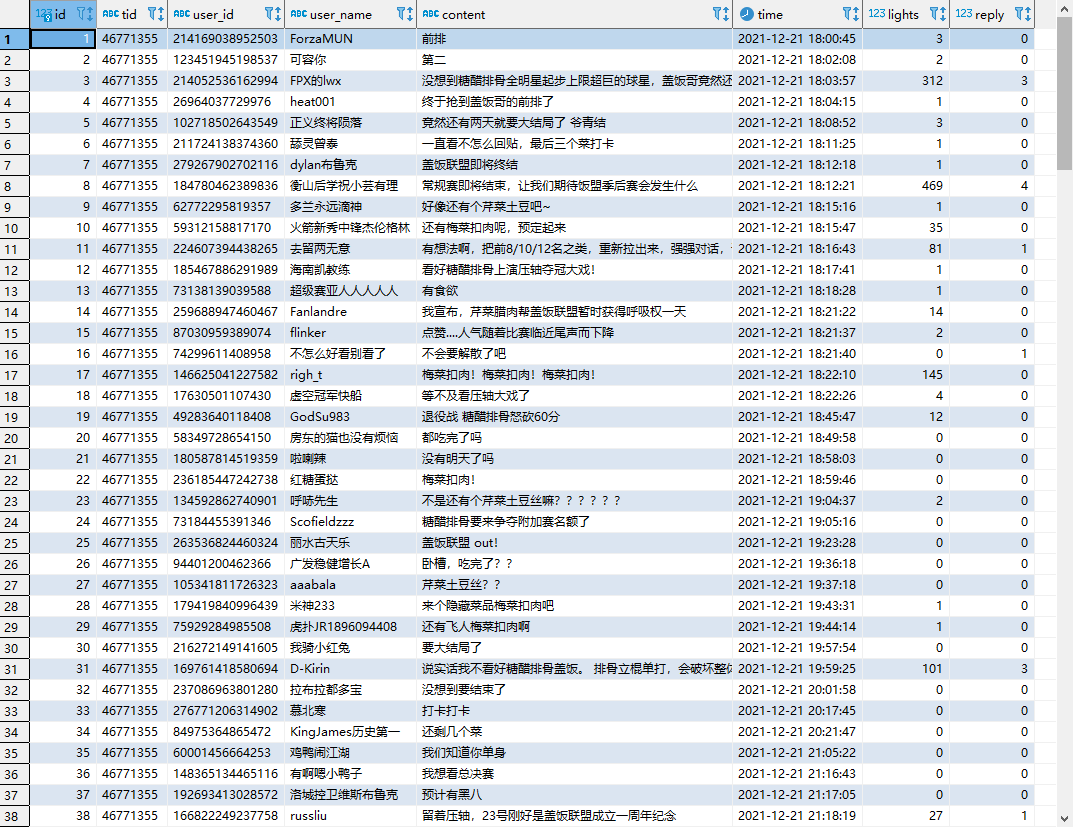
有了数据之后,就可以开始分析了,这里使用jupyter notebook来做,结果可以很直观地看到。
先导入一堆的包,连接上数据库。
# 导入一堆包
import re
import jieba
import records
from collections import Counter
from pyecharts import options as opts
from pyecharts.components import Image
from pyecharts.options import ComponentTitleOpts
from pyecharts.charts import Line, Bar, Scatter, WordCloud, Page
# 连接数据库
db = records.Database('postgresql://hupu:Wnx5i327m8BW@127.0.0.1/hupu')
首先将总阅读量、评论、分享、推荐统计一下(因为用了test模式下的表格,所以加前缀test.,如果是使用默认的public模式,就不用加前缀)。
# 总阅读量
total_read = db.query('select sum(read) from test.posts', True).one(as_dict=True)
total_read['sum']

# 总评论
total_comments = db.query('select sum(comments) from test.posts', True).one(as_dict=True)
total_comments['sum']

# 总分享
total_share = db.query('select sum(share) from test.posts', True).one(as_dict=True)
total_share['sum']

# 总推荐
total_recommend = db.query('select sum(recommend) from test.posts', True).one(as_dict=True)
total_recommend['sum']
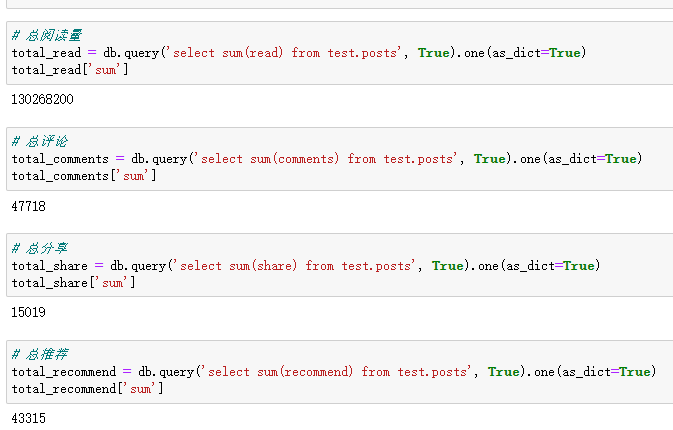
总共有一亿多的阅读量了,还是很牛逼的呀。然后看一下时间跨度最长的帖子是哪个。
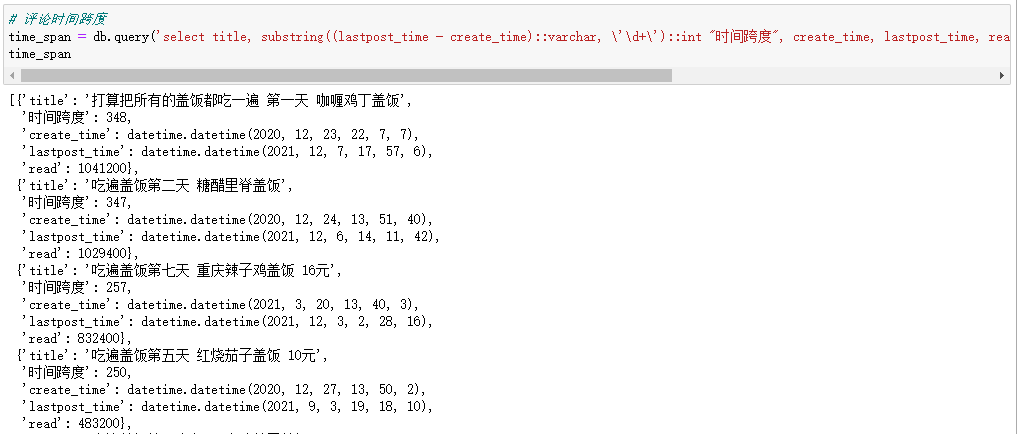
# 评论时间跨度
time_span = db.query('select title, substring((lastpost_time - create_time)::varchar, \'\d+\')::int "时间跨度", create_time, lastpost_time, read from test.posts order by "时间跨度" desc;', True).all(as_dict=True)
time_span
时间跨度最大的还是第一篇帖子呀,一直到12月7号都还有人评论,已经是一年前的帖子了。(数据采集时间是12月26号)
# 评论最多的用户
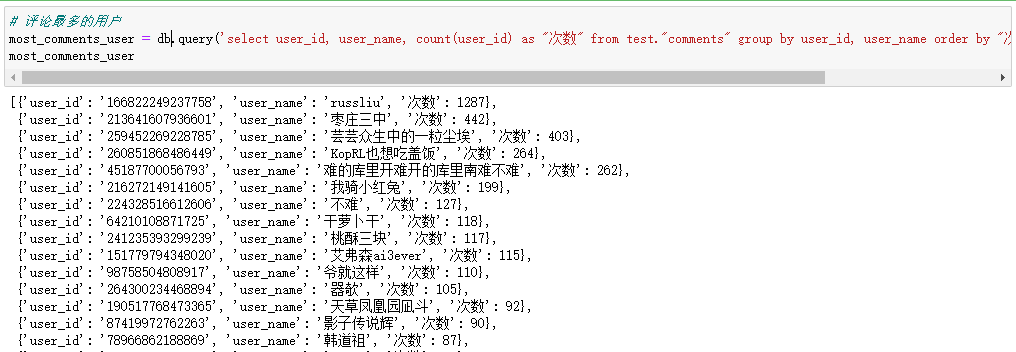
most_comments_user = db.query('select user_id, user_name, count(user_id) as "次数" from test."comments" group by user_id, user_name order by "次数" desc').all(as_dict=True)
most_comments_user
评论最多的用户是russliu,看了一下他的评论,大部分都是@下面的枣会计。(因为采集过程中可能会有遗漏的数据,所以次数并不是精确值)
# 评论最多帖子的用户
most_posts_comments_user = db.query('select distinct user_id, user_name, count(distinct tid) "帖子数" from test."comments" group by user_id, user_name order by "帖子数" desc ').all(True)
most_posts_comments_user
评论帖子最多的是我骑小红兔,两百出头的盖饭帖子,基本上他都去评论了,真粉丝呀。

# 评分最高的菜
top_dishes = db.query('select "name" , avg_score from test.dishes where avg_score is not null order by avg_score desc').all(True)
top_dishes
评分最高的菜是杭椒牛柳盖饭,看了一下图片,也确实很不错,能上9分以上的菜都是很下饭的。

# 评分最低的菜
worst_dishes = db.query('select "name" , avg_score from test.dishes where avg_score is not null order by avg_score').all(True)
worst_dishes
评分最低的菜就不说了,基本上不是很素就是很干的菜。

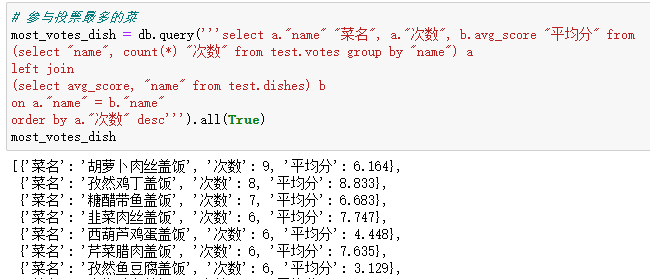
# 参与投票最多的菜
most_votes_dish = db.query('''select a."name" "菜名", a."次数", b.avg_score "平均分" from
(select "name", count(*) "次数" from test.votes group by "name") a
left join
(select avg_score, "name" from test.dishes) b
on a."name" = b."name"
order by a."次数" desc''').all(True)
most_votes_dish
参与投票最多的是胡萝卜肉丝盖饭,盖饭哥都是看jr们投票结果才去吃这道盖饭的,胡萝卜肉丝盖饭输了整整8次之多。
上面是基础的数据分析,下面就开始画图了,这里使用的工具的pyecharts,上面已经导包了。
首先是阅读量和打分人数、投票人数的折线图。
# 阅读,打分人数,投票人数折线图
line_data = db.query(
    '''
        select to_char(create_time, 'yyyy-mm-dd') "日期", read "阅读量", number_of_scores "打分人数", number_of_votes "投票人数" from test.posts
        order by "日期"
    '''
).all(True)
line_data
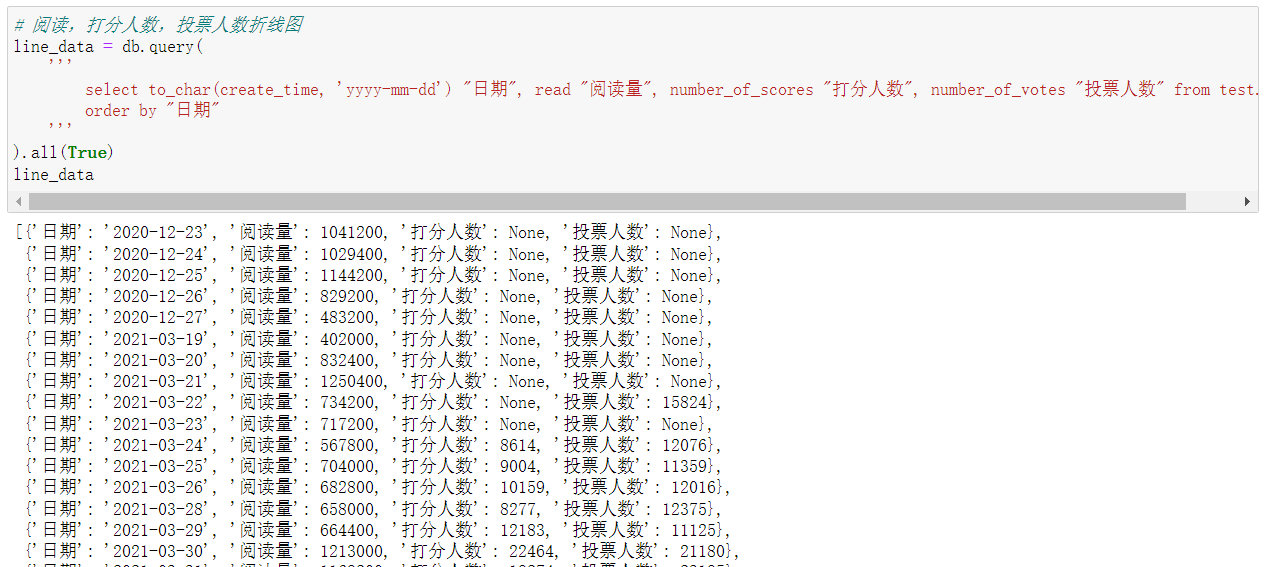
因为一开始的帖子没有设置打分和投票,所以没有数值。
line = (
    Line()
    .set_global_opts(
        tooltip_opts=opts.TooltipOpts(is_show=True),
        xaxis_opts=opts.AxisOpts(type_="category"),
        yaxis_opts=opts.AxisOpts(
            type_="value",
            name="阅读量",
            axistick_opts=opts.AxisTickOpts(is_show=True),
            splitline_opts=opts.SplitLineOpts(is_show=True),
        ),
        title_opts=opts.TitleOpts("盖饭系列-阅读-打分-投票"),
        datazoom_opts=[opts.DataZoomOpts()],
    )
    .add_xaxis(xaxis_data=[l['日期'] for l in line_data])
    .add_yaxis(
        series_name="阅读量",
        y_axis=[l['阅读量'] for l in line_data],
        symbol="emptyCircle",
        is_symbol_show=True,
        label_opts=opts.LabelOpts(is_show=False),
        yaxis_index=0,
    )
    .add_yaxis(
        series_name="打分人数",
        y_axis=[l['打分人数'] for l in line_data],
        symbol="emptyCircle",
        is_symbol_show=True,
        label_opts=opts.LabelOpts(is_show=False),
        yaxis_index=1,
    )
     .add_yaxis(
        series_name="投票人数",
        y_axis=[l['投票人数'] for l in line_data],
        symbol="emptyCircle",
        is_symbol_show=True,
        label_opts=opts.LabelOpts(is_show=False),
        yaxis_index=1,
    )
    .extend_axis(
        yaxis=opts.AxisOpts(
            name="打分-投票",
            type_="value",
            position="right",
            axislabel_opts=opts.LabelOpts(formatter="{value}"),
        )
    )
)
line.render_notebook()
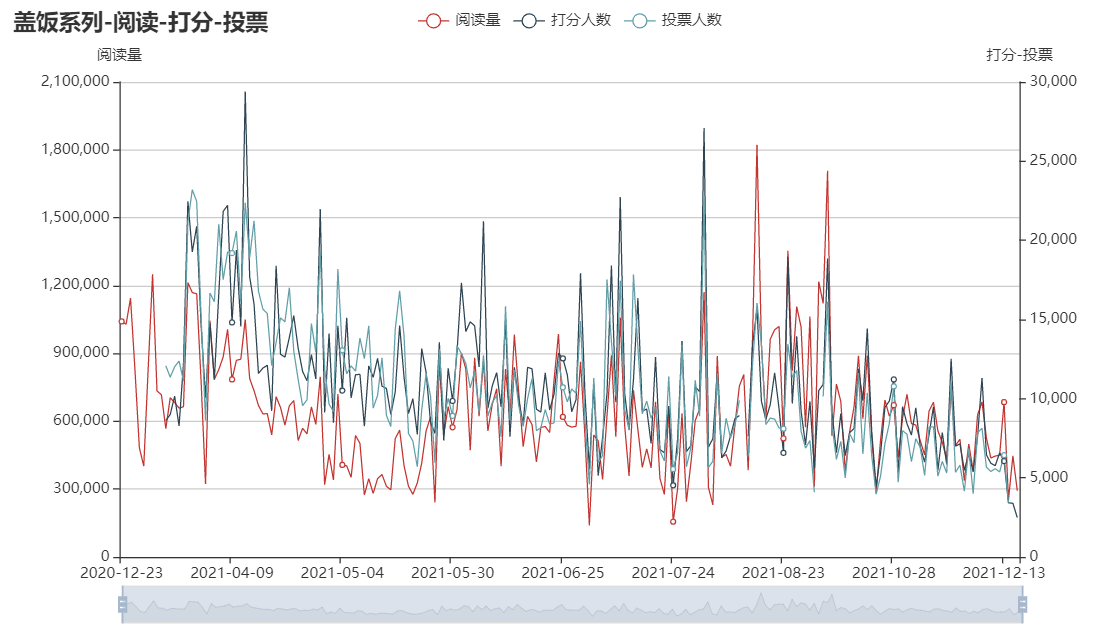
因为阅读量和打分、投票的人数差距太大了,所以分了两个y轴,可以看出来三个的趋势是基本一致的,波动也挺大的。我觉得折线图看起来太乱了,所以又画了一个柱状图看一下。
# 阅读,打分人数,投票人数柱状图
bar = (
    Bar()
    .set_global_opts(
        tooltip_opts=opts.TooltipOpts(is_show=True),
        xaxis_opts=opts.AxisOpts(type_="category"),
        yaxis_opts=opts.AxisOpts(
            type_="value",
            name="阅读量",
            axistick_opts=opts.AxisTickOpts(is_show=True),
            splitline_opts=opts.SplitLineOpts(is_show=True),
        ),
        title_opts=opts.TitleOpts("盖饭系列-阅读-打分-投票"),
        datazoom_opts=[opts.DataZoomOpts()],
    )
    .add_xaxis(xaxis_data=[l['日期'] for l in line_data])
    .add_yaxis(
        series_name="阅读量",
        y_axis=[l['阅读量'] for l in line_data],
        label_opts=opts.LabelOpts(is_show=False),
        yaxis_index=0,
    )
    .add_yaxis(
        series_name="打分人数",
        y_axis=[l['打分人数'] for l in line_data],
        label_opts=opts.LabelOpts(is_show=False),
        yaxis_index=1,
    )
     .add_yaxis(
        series_name="投票人数",
        y_axis=[l['投票人数'] for l in line_data],
        label_opts=opts.LabelOpts(is_show=False),
        yaxis_index=1,
    )
    .extend_axis(
        yaxis=opts.AxisOpts(
            name="打分-投票",
            type_="value",
            position="right",
            axislabel_opts=opts.LabelOpts(formatter="{value}"),
        )
    )
)
bar.render_notebook()
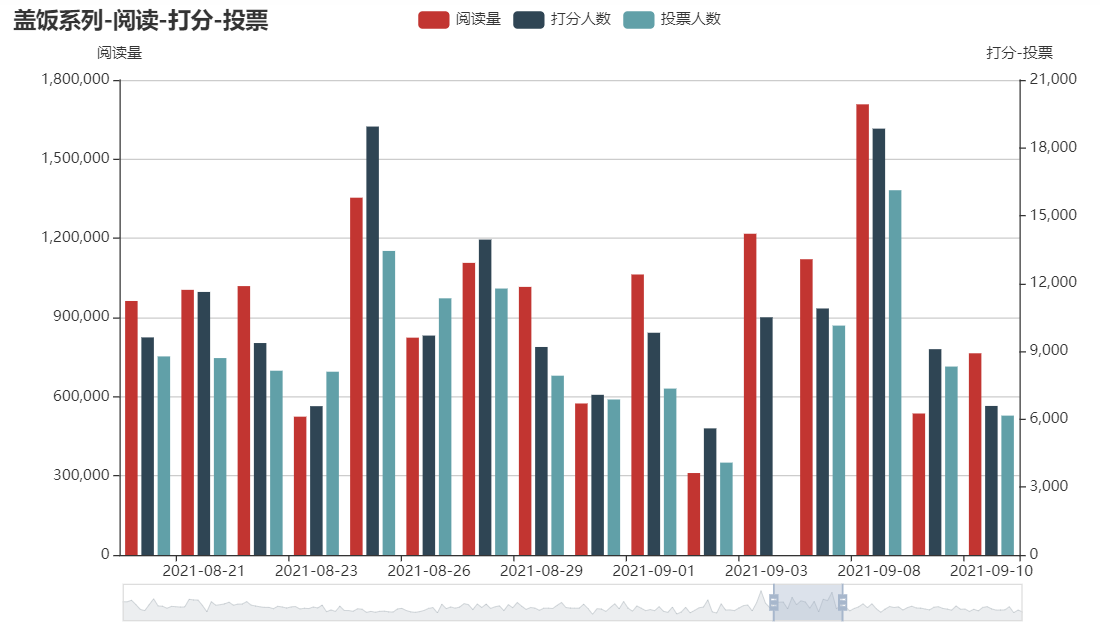
把区间拉小一点可以看出来jr们都是比较喜欢打分,投票的人数还是相对少一点。
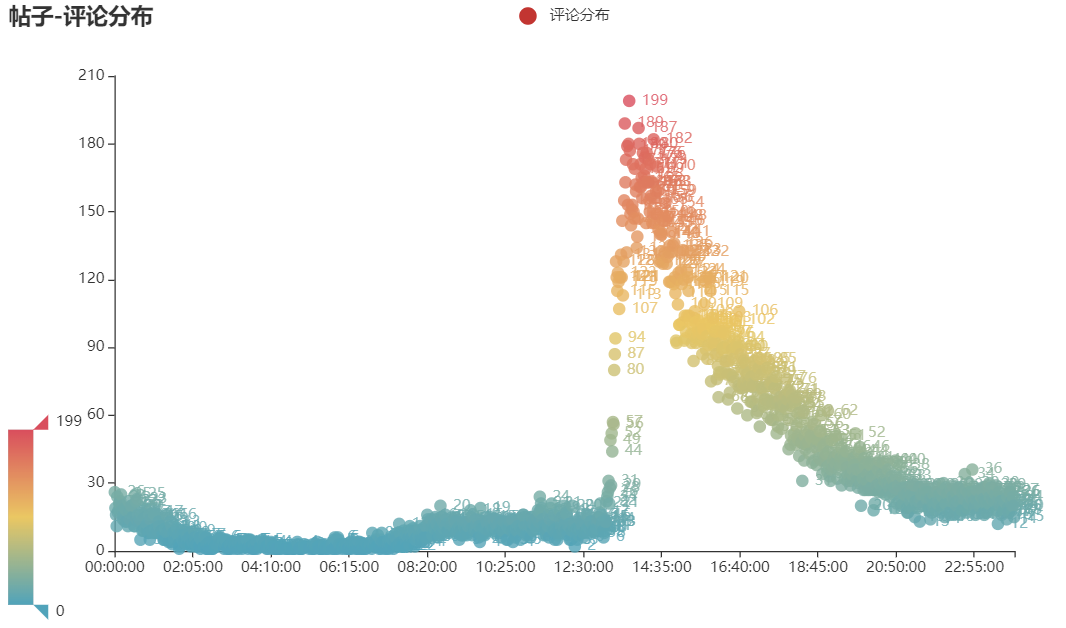
下面画一下帖子和评论的时间分布散点图。这里用一个字典取存取24个小时里面每分钟的帖子数量和评论数量。
# 帖子-评论时间分布散点图
scatter_posts = db.query(
    '''
        select to_char(create_time, 'hh24:mi:00') "时间", count(*) "分布次数" from test.posts group by "时间"
    '''
).all(True)

scatter_comments = db.query(
    '''
        select to_char(time,  'hh24:mi:00') "时间", count(*) "分布次数" from test."comments" group by "时间"
    '''
).all(True)

# 生成帖子和评论24个小时的字典
scatter_posts_data = {}
scatter_comments_data = {}
for h in ['{num:02d}'.format(num=i) for i in range(24)]:
    for m in ['{num:02d}'.format(num=i) for i in range(60)]:
        scatter_posts_data[f'{h}:{m}:00'] = None
        scatter_comments_data[f'{h}:{m}:00'] = None

# 将查询出来的数据放到字典里面去
for post in scatter_posts:
    scatter_posts_data[post['时间']] = post['分布次数']
for comments in scatter_comments:
    scatter_comments_data[comments['时间']] = comments['分布次数']
# 帖子分布
c1 = (
    Scatter()
    .add_xaxis(list(scatter_posts_data.keys()))
    .add_yaxis("帖子分布", list(scatter_posts_data.values()), yaxis_index=0)
    .set_global_opts(
        title_opts=opts.TitleOpts(title="帖子-评论分布"),
        visualmap_opts=opts.VisualMapOpts(max_=max([v for v in scatter_posts_data.values() if v is not None]), min_=0),
    )
)
c1.render_notebook()

# 评论分布
c2 = (
    Scatter()
    .add_xaxis(list(scatter_comments_data.keys()))
    .add_yaxis("评论分布", list(scatter_comments_data.values()), yaxis_index=0)
    .set_global_opts(
        title_opts=opts.TitleOpts(title="帖子-评论分布"),
        visualmap_opts=opts.VisualMapOpts(max_=max([v for v in scatter_comments_data.values() if v is not None]), min_=0),
    )
)
c2.render_notebook()
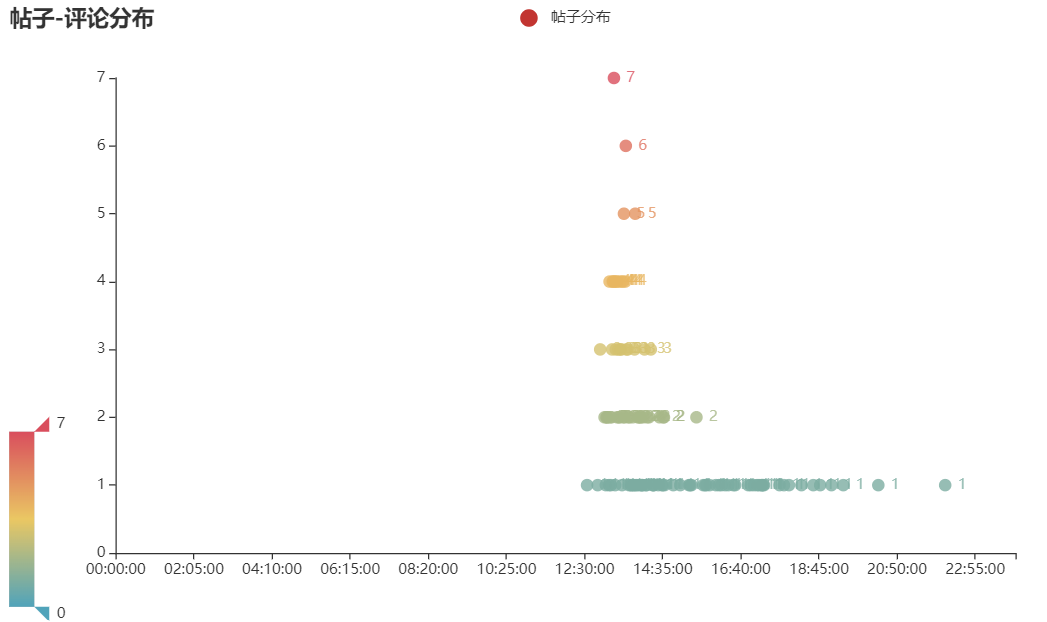
这里可以看出来盖饭哥的帖子都是在中午或者下午的时候发的,还没有在早上发过帖子。评论的话大部分都是在发帖子的时间前后,而且基本上24小时都有,看来虎扑jr是真的不用睡觉呀。
最后就是词云图了,先用jieba库对评论进行分词,这里要去除一下停用词,然后用collections库对分词后的结果进行词频统计,这里有个bug,第一次运行生成词云图的时候出不来,再跑一次就可以了。
# 词云图
comments = db.query(
    '''
        select content from test.comments
    '''
).all(True)

comments_cut = []
def tokenizer(content):
    with open('stopwords.txt', 'r')as fp:
        stop_words = [stop_word.strip() for stop_word in fp.readlines()]
    words = []
    for word in jieba.lcut(content):
        if word not in stop_words:
            words.append(word)
    return words

for c in comments:
    content = re.sub(r"[0-9,,。?!?!【】]+", "", c['content'])
    comments_cut += tokenizer(content)

comments_count = []
for key, value in Counter(comments_cut).items():
    comments_count.append((key, value))

w = (
    WordCloud()
    .add(series_name="", data_pair=comments_count, word_size_range=[10, 100], mask_image="盖饭.png")
    .set_global_opts(
        title_opts=opts.TitleOpts(
            title="", title_textstyle_opts=opts.TextStyleOpts(font_size=23)
        ),
        tooltip_opts=opts.TooltipOpts(is_show=True),
    )
)
w.render_notebook()
这里首先引入眼帘的就是这个狗头啊,看来大家都很喜欢发狗头保命,还有一些联盟、季后赛、巨星等字眼,原来虎扑还是一个体育论坛来着。

好了,把表格弄到之后,可以通过echarts里面的一个Page方法,把需要的图标都放进去,可以通过拖拉拽的方法布置成一个数据看板的形式。
这里先把前面统计的基础数据做成一个个小模块,这样就可一起在看板里面显示了。
# 数据看板模块设计

# 总阅读、评论、分享、推荐
total_text = (
    Image()
    .set_global_opts(
    title_opts=ComponentTitleOpts(title="总阅读-{}".format(total_read["sum"]),
                                  subtitle=f"评论-{total_comments['sum']}|分享-{total_share['sum']}|推荐-{total_recommend['sum']}")
    )
)
total_text.render_notebook()

# 时间跨度最大的帖子
time_span_text = (
    Image()
    .set_global_opts(
    title_opts=ComponentTitleOpts(title="时间跨度最大的帖子",
                                  subtitle=f"{time_span[0]['title']}\n{time_span[0]['时间跨度']}天\n发布时间{time_span[0]['create_time']}-最后评论{time_span[0]['lastpost_time']}\n总阅读量:{time_span[0]['read']}",
                                  subtitle_style={'text-align': 'center'}
                                 )
    )
)
time_span_text.render_notebook()

# 评论最多的用户
most_comments_user_text = (
    Image()
    .add(src='russliu.jpg',
         style_opts={"width": "100px", "height": "100px", "style": "margin-top: 20px"})
    .set_global_opts(
        title_opts=ComponentTitleOpts(title="评论最多的用户",
                                     subtitle=f"{most_comments_user[0]['user_name']}-{most_comments_user[0]['次数']}条评论")
    )
)
most_comments_user_text.render_notebook()

# 评论帖子最多top3标题
most_posts_comments_user_title = (
    Image()
    .set_global_opts(
        title_opts=ComponentTitleOpts(title="评论帖子最多top3")
    )
)
most_posts_comments_user_title.render_notebook()

# 评论帖子最多top3第一名
most_posts_comments_user_text1 = (
    Image()
    .add(src='我骑小红兔.jpg',
         style_opts={"width": "120px", "height": "120px", "style": "margin-top: 20px"})
    .set_global_opts(
        title_opts=ComponentTitleOpts(subtitle=f"{most_posts_comments_user[0]['user_name']}",
                                     subtitle_style={'text-align': 'center'})
    )
)
most_posts_comments_user_text1.render_notebook()

# 评论帖子最多top3第二名
most_posts_comments_user_text2 = (
    Image()
    .add(src='枣庄三中.png',
         style_opts={"width": "100px", "height": "100px", "style": "margin-top: 20px"})
    .set_global_opts(
        title_opts=ComponentTitleOpts(subtitle=f"{most_posts_comments_user[1]['user_name']}",
                                     subtitle_style={'text-align': 'center'})
    )
)
most_posts_comments_user_text2.render_notebook()

# 评论帖子最多top3第三名
most_posts_comments_user_text3 = (
    Image()
    .add(src='russliu.jpg',
         style_opts={"width": "80px", "height": "80px", "style": "margin-top: 20px"})
    .set_global_opts(
        title_opts=ComponentTitleOpts(subtitle=f"{most_posts_comments_user[2]['user_name']}",
                                     subtitle_style={'text-align': 'center'})
    )
)
most_posts_comments_user_text3.render_notebook()

# 评分前三和倒三的菜
top_dishes_title = (
    Image()
    .set_global_opts(
        title_opts=ComponentTitleOpts(title="评分前三和倒三的菜")
    )
)
top_dishes_title.render_notebook()

# 前三第一
top_dishes_text1 = (
    Image()
    .add(src='杭椒牛柳盖饭.png',
         style_opts={"width": "120px", "height": "120px", "style": "margin-top: 20px"})
    .set_global_opts(
        title_opts=ComponentTitleOpts(subtitle=f"{top_dishes[0]['name']}-{top_dishes[0]['avg_score']}分",
                                     subtitle_style={'text-align': 'center'})
    )
)
top_dishes_text1.render_notebook()


# 前三第二
top_dishes_text2 = (
    Image()
    .add(src='咖喱牛肉丁盖饭.jpg',
         style_opts={"width": "100px", "height": "100px", "style": "margin-top: 20px"})
    .set_global_opts(
        title_opts=ComponentTitleOpts(subtitle=f"{top_dishes[1]['name']}-{top_dishes[1]['avg_score']}分",
                                     subtitle_style={'text-align': 'center'})
    )
)
top_dishes_text2.render_notebook()

# 前三第三
top_dishes_text3 = (
    Image()
    .add(src='麻辣鸡丁盖饭.jpg',
         style_opts={"width": "80px", "height": "80px", "style": "margin-top: 20px"})
    .set_global_opts(
        title_opts=ComponentTitleOpts(subtitle=f"{top_dishes[2]['name']}-{top_dishes[2]['avg_score']}分",
                                     subtitle_style={'text-align': 'center'})
    )
)
top_dishes_text3.render_notebook()

# 倒一
worst_dishes_text1 = (
    Image()
    .add(src='豆芽粉条盖饭.jpg',
         style_opts={"width": "120px", "height": "120px", "style": "margin-top: 20px"})
    .set_global_opts(
        title_opts=ComponentTitleOpts(subtitle=f"{worst_dishes[0]['name']}-{worst_dishes[0]['avg_score']}分",
                                     subtitle_style={'text-align': 'center'})
    )
)
worst_dishes_text1.render_notebook()

# 倒二
worst_dishes_text2 = (
    Image()
    .add(src='椒盐土豆片盖饭.jpg',
         style_opts={"width": "100px", "height": "100px", "style": "margin-top: 20px"})
    .set_global_opts(
        title_opts=ComponentTitleOpts(subtitle=f"{worst_dishes[1]['name']}-{worst_dishes[1]['avg_score']}分",
                                     subtitle_style={'text-align': 'center'})
    )
)
worst_dishes_text2.render_notebook()

# 倒三
worst_dishes_text3 = (
    Image()
    .add(src='海米油菜盖饭.jpg',
         style_opts={"width": "80px", "height": "80px", "style": "margin-top: 20px"})
    .set_global_opts(
        title_opts=ComponentTitleOpts(subtitle=f"{worst_dishes[2]['name']}-{worst_dishes[2]['avg_score']}分",
                                     subtitle_style={'text-align': 'center'})
    )
)
worst_dishes_text3.render_notebook()

# 参与投票最多次的菜
most_votes_dish_text = (
    Image()
    .add(src='胡萝卜肉丝盖饭.jpg',
         style_opts={"width": "120px", "height": "120px", "style": "margin-top: 20px"})
    .set_global_opts(
        title_opts=ComponentTitleOpts(title='参与投票最多的菜',
                                     subtitle=f"{most_votes_dish[0]['菜名']}-{most_votes_dish[0]['次数']}次-{most_votes_dish[0]['平均分']}分",
                                     subtitle_style={'text-align': 'center'})
    )
)
most_votes_dish_text.render_notebook()

# 数据看板标题
page_title_text = (
    Image()
    .set_global_opts(
        title_opts=ComponentTitleOpts(title='盖饭数据统计--截止至2021-12-26')
    )
)
page_title_text.render_notebook()
最后将这里生成的基本数据的图表和上面的词云图这些都放进page里面,最后会生成一个html文件。
# 将上面的图表都放进page里面
page = Page(page_title="盖饭数据统计", layout=Page.DraggablePageLayout)
page.add(
    page_title_text,
    bar,
    c1,
    c2,
    w,
    total_text,
    time_span_text,
    most_comments_user_text,
    most_posts_comments_user_title,
    most_posts_comments_user_text1,
    most_posts_comments_user_text2,
    most_posts_comments_user_text3,
    top_dishes_title,
    top_dishes_text1,
    top_dishes_text2,
    top_dishes_text3,
    worst_dishes_text1,
    worst_dishes_text2,
    worst_dishes_text3,
    most_votes_dish_text
)
page.render("hupu_analysis.html")
打开这个文件,各个图表是按顺序排列下来的,可以自由拖动图表放置到不同的地方,也可以改变图表大小,最后点击左上角的save config就会保存一个json文件。
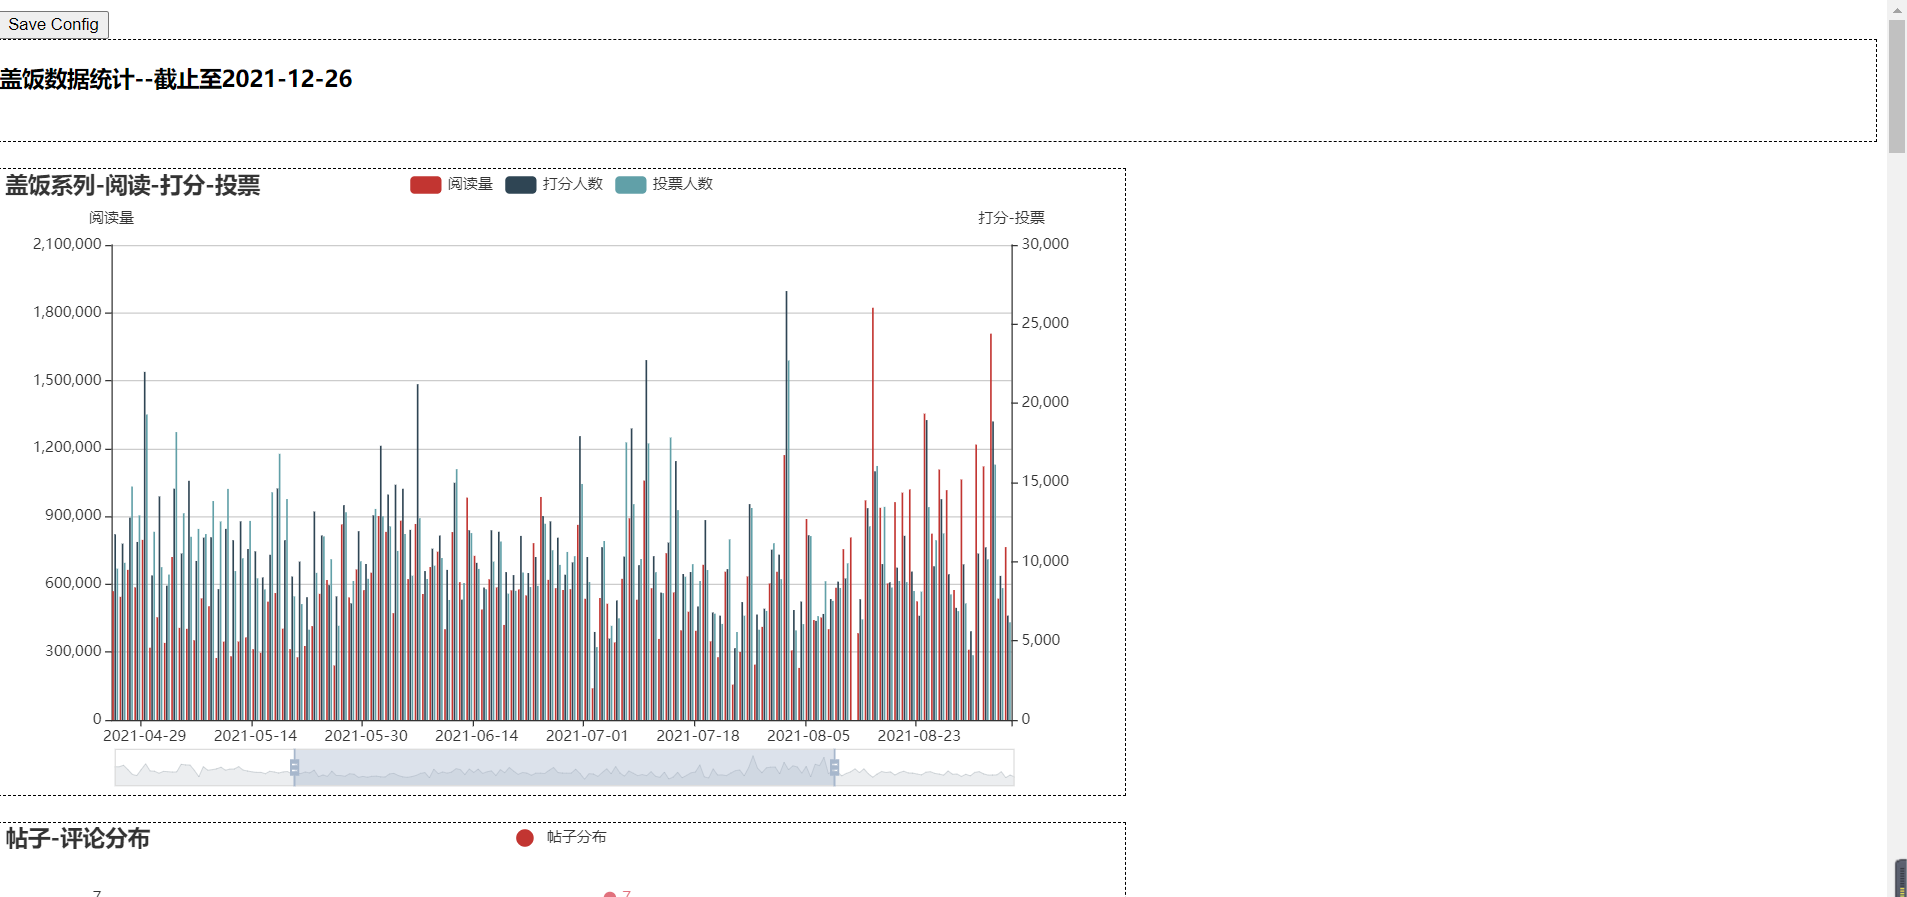
 将这一个json文件加载到原来的html里面,就可以按照刚刚拖拽的布局生成新的html文件了,如果不加dest参数就会把原来的覆盖掉。
Page.save_resize_html("hupu_analysis.html", cfg_file="chart_config.json", dest="hupu_analysis_resize.html")
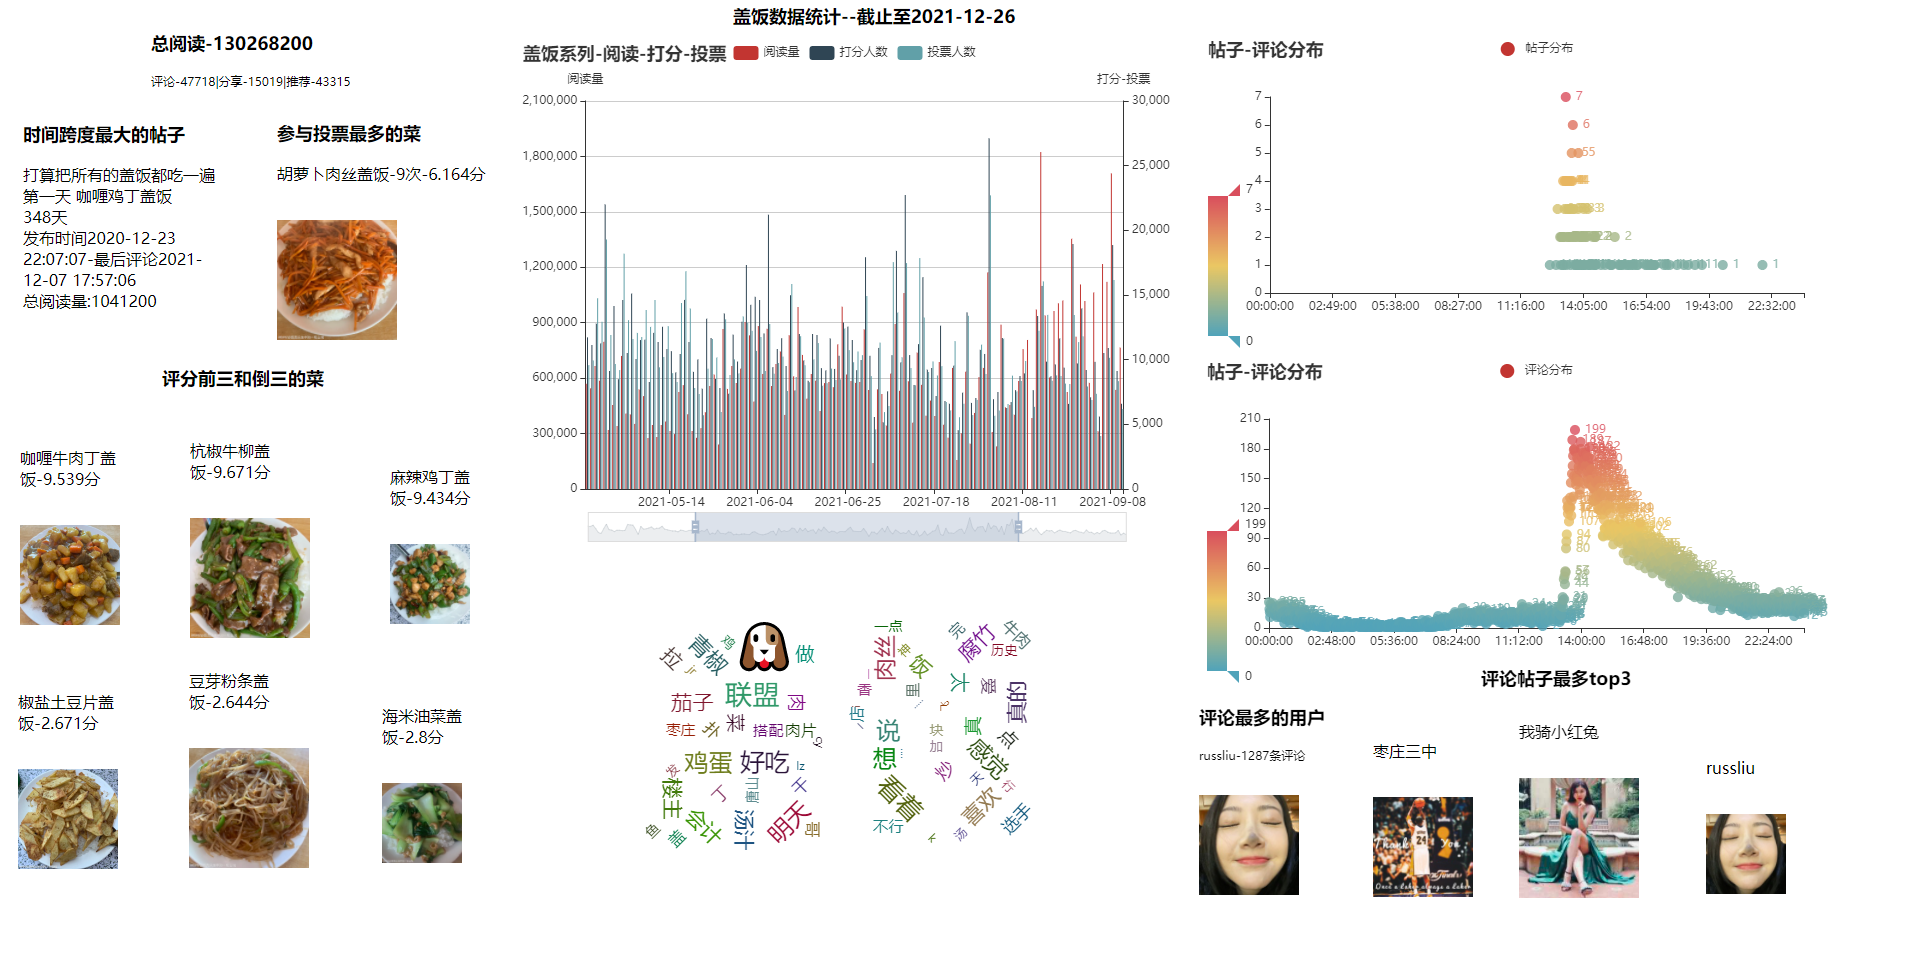
最后看一下成品,还是比较粗糙的。所有的代码都放在的百度网盘上了,还有采集下来的数据也生成csv文件一起放进去了,想玩一下的同学可以自行下载。好了,这一次的学习就到这了,感谢盖饭哥给的题材。
链接:https://pan.baidu.com/s/17pifw89xwZOdbThwCCz2rw
提取码:a4ob