
一、ELK收集Nginx日志
#由于10.192.27.111 上已经安装了ES 接下来安装Kibana
[root@web01 soft]# rpm -ivh kibana-6.6.0-x86_64.rpm
[root@web01 ~]# rpm -qc kibana  #查看Kibana配置文件
/etc/kibana/kibana.yml
[root@web01 ~]# grep "^[a-z]" /etc/kibana/kibana.yml #修改后的配置文件
server.port: 5601
server.host: "0.0.0.0"
elasticsearch.hosts: ["http://localhost:9200"]
kibana.index: ".kibana"
[root@web01 ~]#
[root@web01 ~]# systemctl start kibana
[root@web01 ~]# systemctl status kibana
[root@web01 ~]# netstat -lntup|grep 5601
tcp        0      0 0.0.0.0:5601            0.0.0.0:*               LISTEN      69594/node
[root@web01 ~]#
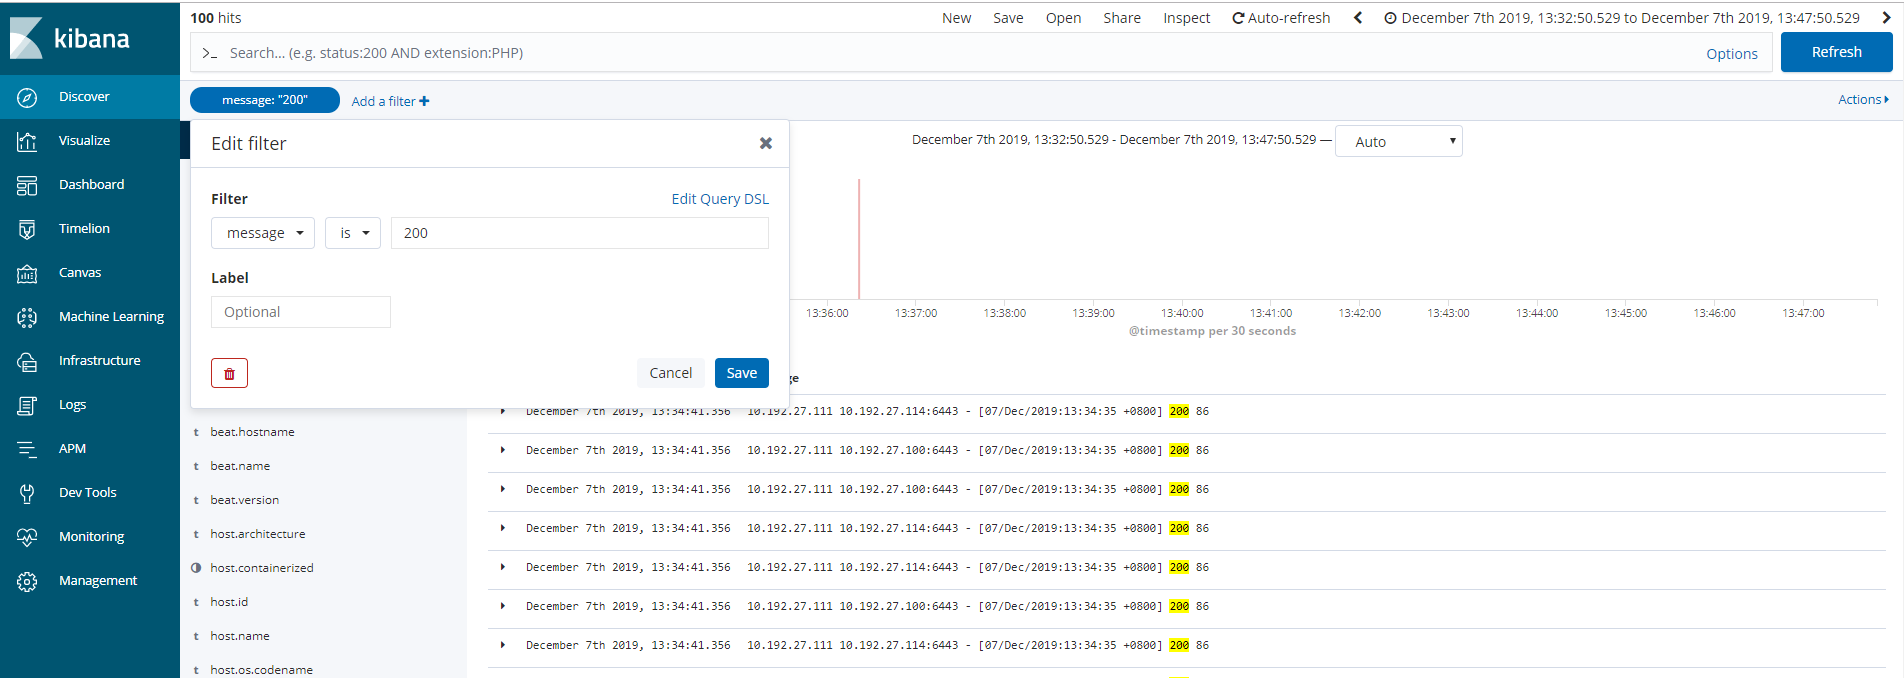
#测试Nginx负载均衡日志
[root@web01 ~]# ab -n 100 -c 100 http://10.192.27.111:6443/
[root@web01 ~]# tailf /var/log/nginx/k8s-access.log
10.192.27.111 10.192.27.114:6443 - [07/Dec/2019:11:45:45 +0800] 200 86
10.192.27.111 10.192.27.100:6443 - [07/Dec/2019:11:45:45 +0800] 200 86
10.192.27.111 10.192.27.114:6443 - [07/Dec/2019:11:45:45 +0800] 200 86
10.192.27.111 10.192.27.100:6443 - [07/Dec/2019:11:45:45 +0800] 200 86
10.192.27.111 10.192.27.114:6443 - [07/Dec/2019:11:45:45 +0800] 200 86
10.192.27.111 10.192.27.100:6443 - [07/Dec/2019:11:45:45 +0800] 200 86
10.192.27.111 10.192.27.114:6443 - [07/Dec/2019:11:45:45 +0800] 200 86
10.192.27.111 10.192.27.100:6443 - [07/Dec/2019:11:45:45 +0800] 200 86
10.192.27.111 10.192.27.114:6443 - [07/Dec/2019:11:45:45 +0800] 200 86
10.192.27.111 10.192.27.100:6443 - [07/Dec/2019:11:45:45 +0800] 200 86
#安装filebeat
[root@web01 soft]# rpm -ivh filebeat-6.6.0-x86_64.rpm
警告:filebeat-6.6.0-x86_64.rpm: 头V4 RSA/SHA512 Signature, 密钥 ID d88e42b4: NOKEY
准备中...                          ################################# [100%]
正在升级/安装...
   1:filebeat-6.6.0-1                 ################################# [100%]
[root@web01 soft]# rpm -qc filebeat
/etc/filebeat/filebeat.yml
/etc/filebeat/modules.d/apache2.yml.disabled
/etc/filebeat/modules.d/auditd.yml.disabled
/etc/filebeat/modules.d/elasticsearch.yml.disabled
/etc/filebeat/modules.d/haproxy.yml.disabled
/etc/filebeat/modules.d/icinga.yml.disabled
/etc/filebeat/modules.d/iis.yml.disabled
/etc/filebeat/modules.d/kafka.yml.disabled
/etc/filebeat/modules.d/kibana.yml.disabled
/etc/filebeat/modules.d/logstash.yml.disabled
/etc/filebeat/modules.d/mongodb.yml.disabled
/etc/filebeat/modules.d/mysql.yml.disabled
/etc/filebeat/modules.d/nginx.yml.disabled
/etc/filebeat/modules.d/osquery.yml.disabled
/etc/filebeat/modules.d/postgresql.yml.disabled
/etc/filebeat/modules.d/redis.yml.disabled
/etc/filebeat/modules.d/suricata.yml.disabled
/etc/filebeat/modules.d/system.yml.disabled
/etc/filebeat/modules.d/traefik.yml.disabled
[root@web01 soft]# cd
[root@web01 ~]# egrep -v "#|^$" /etc/filebeat/filebeat.yml #修改后的配置文件
filebeat.inputs:
- type: log  #log模式
  enabled: True
  paths:
    - /var/log/nginx/k8s-access.log  #日志目录
filebeat.config.modules:
  path: ${path.config}/modules.d/*.yml
  reload.enabled: false
setup.template.settings:
  index.number_of_shards: 3  #三个副本
setup.kibana:
output.elasticsearch:
  hosts: ["localhost:9200"]  #es地址
processors:
  - add_host_metadata: ~
  - add_cloud_metadata: ~
[root@web01 ~]#
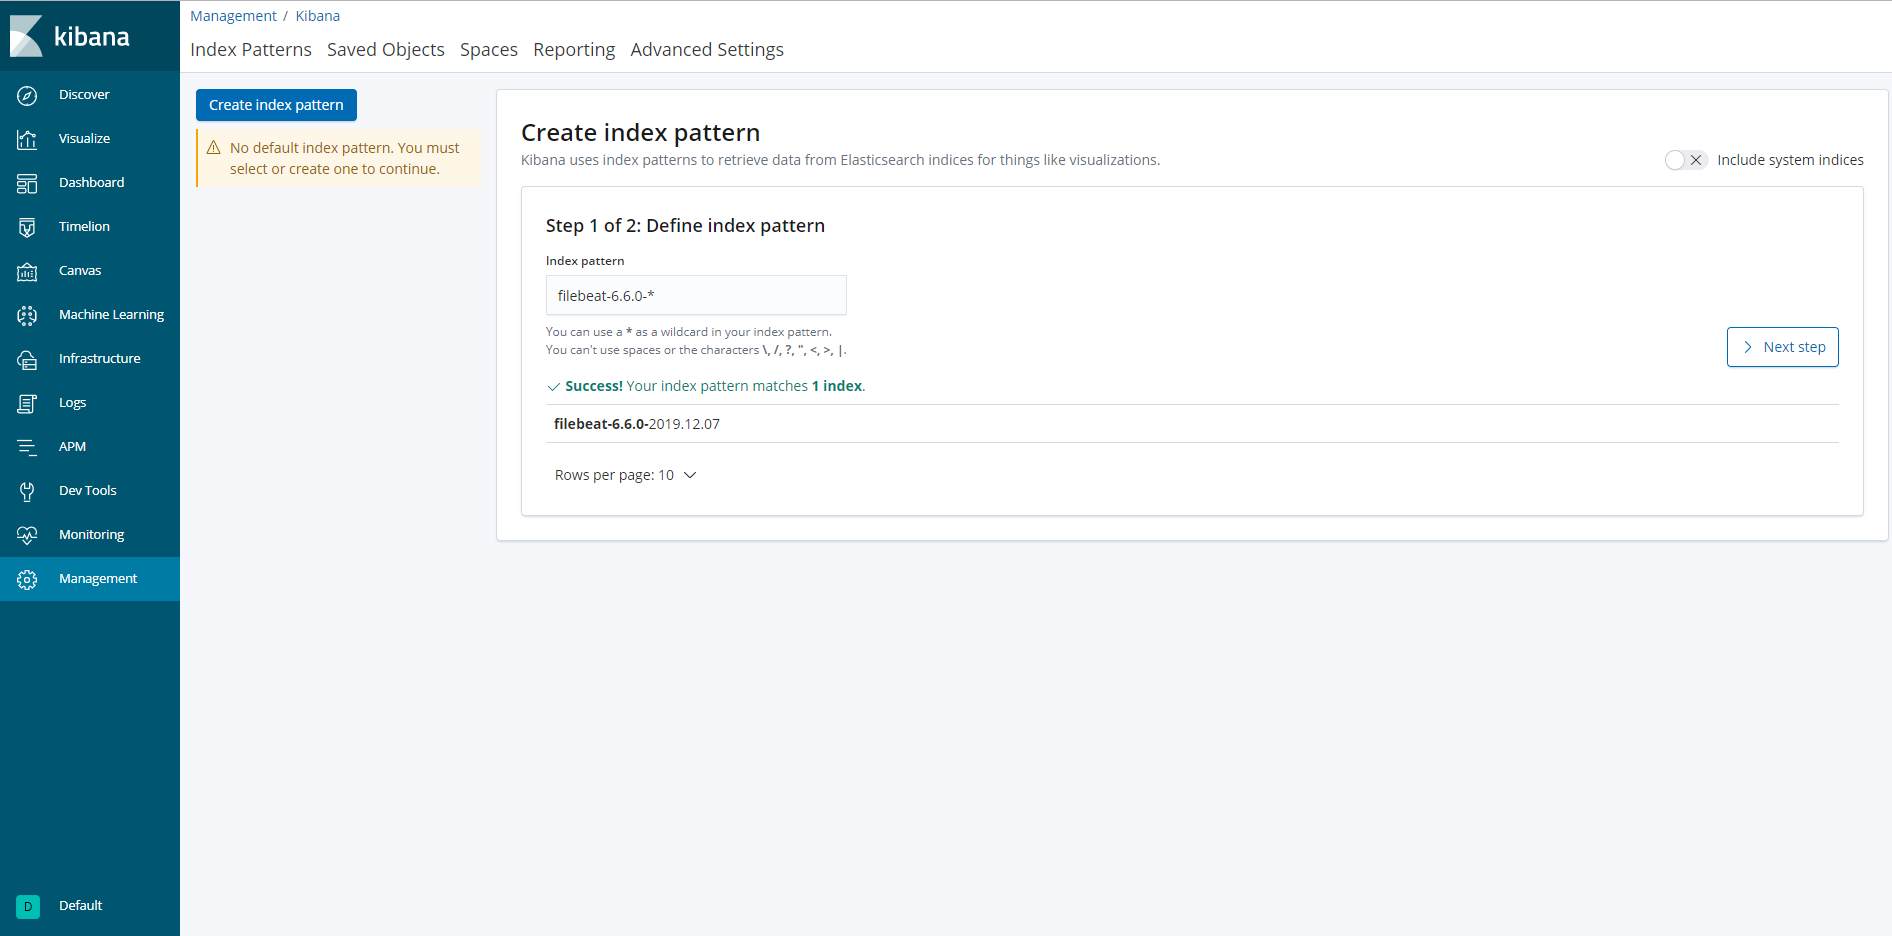
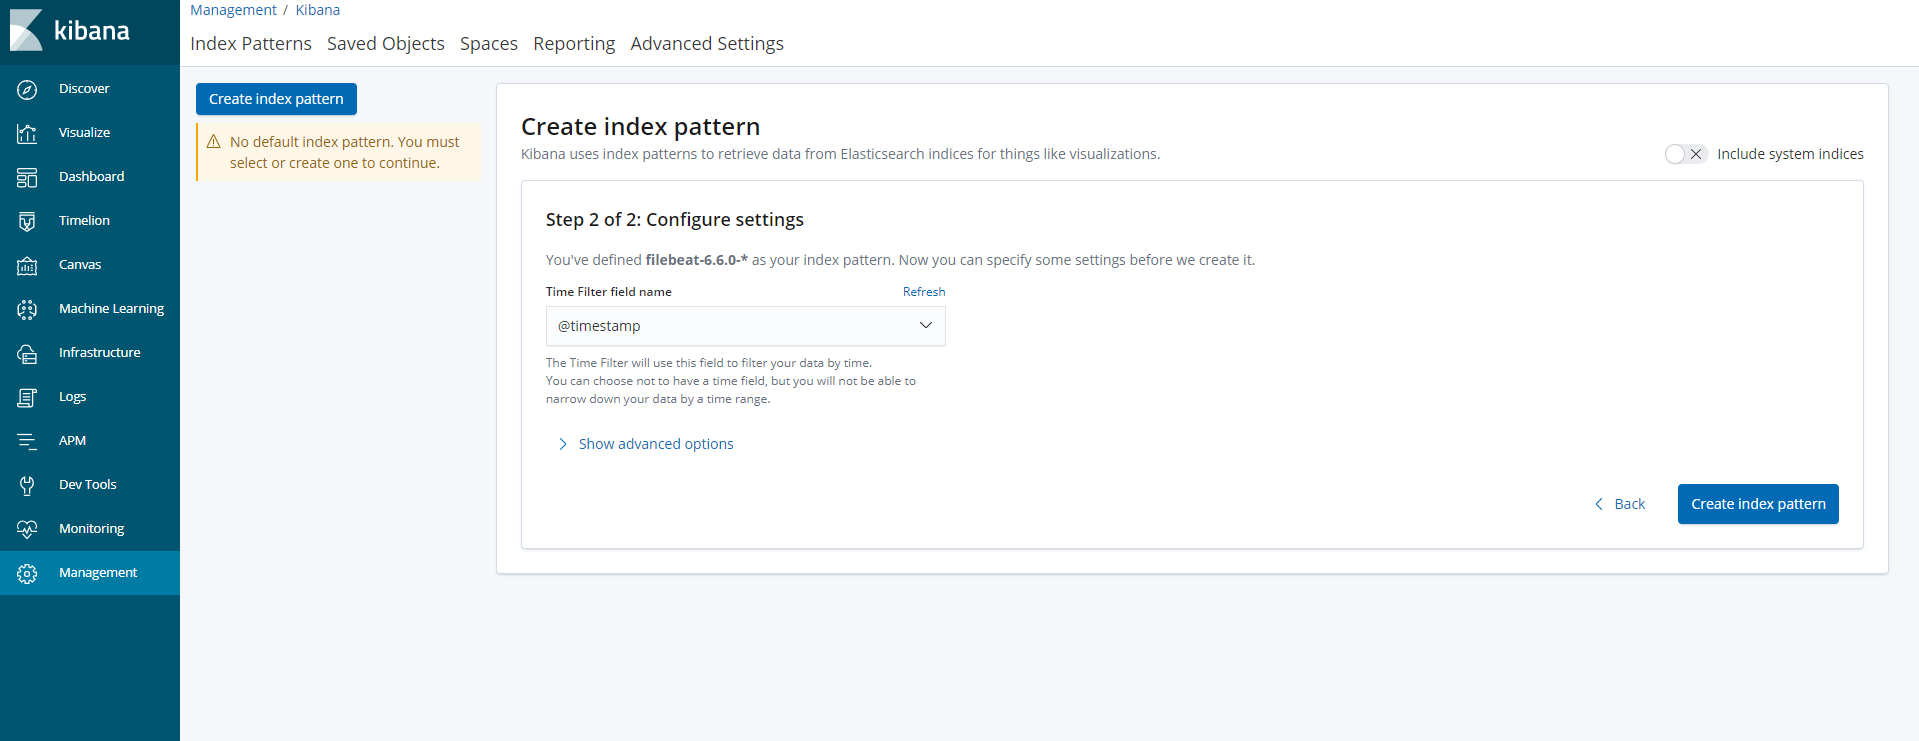
简单的访问一下:http://10.192.27.111:5601/

上面是收集简单的Nginx日志,接下来我们收集json格式的日志
例如:Nginx日志如下
user  nginx;
worker_processes  1;

error_log  /var/log/nginx/error.log warn;
pid        /var/run/nginx.pid;


events {
    worker_connections  1024;
}


http {
    include       /etc/nginx/mime.types;
    default_type  application/octet-stream;

    log_format main  '$remote_addr - $remote_user [$time_local] "$request" '
                      '$status $body_bytes_sent "$http_referer" '
                      '"$http_user_agent" "$http_x_forwarded_for"';

    log_format json  '{ "time_local": "$time_local", '
                          '"remote_addr": "$remote_addr", '
                          '"referer": "$http_referer", '
                          '"request": "$request", '
                          '"status": $status, '
                          '"bytes": $body_bytes_sent, '
                          '"agent": "$http_user_agent", '
                          '"x_forwarded": "$http_x_forwarded_for", '
                          '"up_addr": "$upstream_addr",'
                          '"up_host": "$upstream_http_host",'
                          '"upstream_time": "$upstream_response_time",'
                          '"request_time": "$request_time"'
' }';

    access_log  /var/log/nginx/access.log  json;

    sendfile        on;
    #tcp_nopush     on;

    keepalive_timeout  65;

    #gzip  on;

    include /etc/nginx/conf.d/*.conf;
}
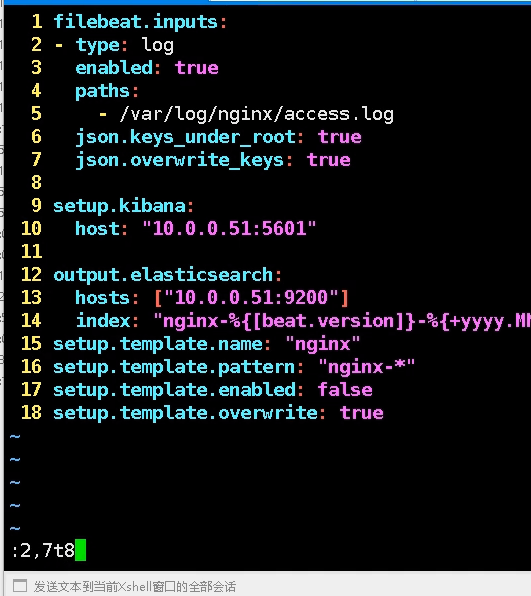
filebeat删减版日志
filebeat.inputs:
- type: log
  enabled: true
  paths:
    - /var/log/nginx/access.log
  json.keys_under_root: true #关键字顶级
  json.overwrite_keys: true  #

setup.kibana:
  host: "10.192.27.111:5601"

output.elasticsearch:
  hosts: ["10.192.27.111:9200"]
  index: "nginx-%{[beat.version]}-%{+yyyy.MM}"  #定义索引名称
setup.template.name: "nginx"     #定义模板名称
setup.template.pattern: "nginx-*"  #模板正则匹配
setup.template.enabled: false      #不使用系统模板
setup.template.overwrite: true     #覆盖
重启服务然后再次访问 步骤更上面一致
详细情况可以参考官网:https://www.elastic.co/guide/en/beats/filebeat/current/filebeat-input-log.html
日志拆分 收集多个日志 和多台机器日志汇总
可以将单台机器的Nginx配置文件(日志那部分配置也可以)拷到其它节点上,同时filebeat.yaml也一样 重启服务
filebeat.inputs:
- type: log
  enabled: true
  paths:
    - /var/log/nginx/access.log
  json.keys_under_root: true
  json.overwrite_keys: true
  tags: ["access"]   #打tag

- type: log
  enabled: true
  paths:
    - /var/log/nginx/error.log
  tags: ["error"]

setup.kibana:
  host: "10.192.27.111:5601"

output.elasticsearch:
  hosts: ["10.192.27.111:9200"]
  #index: "nginx-%{[beat.version]}-%{+yyyy.MM}"
  indices:
    - index: "nginx-access-%{[beat.version]}-%{+yyyy.MM}"
      when.contains:
        tags: "access"    #判断条件
    - index: "nginx-error-%{[beat.version]}-%{+yyyy.MM}"
      when.contains:
        tags: "error"

setup.template.name: "nginx"
setup.template.pattern: "nginx-*"
setup.template.enabled: false
setup.template.overwrite: true
重启服务然后再次访问 步骤更上面一致


使用filledeat modules配置
官方网址
https://www.elastic.co/guide/en/beats/filebeat/6.6/configuration-filebeat-modules.html
使用模版配置nginx正常日志
社区论坛:
https://discuss.elastic.co/t/filebeat-module-custom-index/181350


客户端(收集web服务器日志) 10.192.27.100

1、安装filebeat
[root@web01 ~]# rpm -ivh filebeat-6.6.0-x86_64.rpm
警告:filebeat-6.6.0-x86_64.rpm: 头V4 RSA/SHA512 Signature, 密钥 ID d88e42b4: NOKEY
准备中...                          ################################# [100%]
正在升级/安装...
   1:filebeat-6.6.0-1                 ################################# [100%]
[root@web01 soft]# rpm -qc filebeat
/etc/filebeat/filebeat.yml
/etc/filebeat/modules.d/apache2.yml.disabled
/etc/filebeat/modules.d/auditd.yml.disabled
/etc/filebeat/modules.d/elasticsearch.yml.disabled
/etc/filebeat/modules.d/haproxy.yml.disabled
/etc/filebeat/modules.d/icinga.yml.disabled
/etc/filebeat/modules.d/iis.yml.disabled
/etc/filebeat/modules.d/kafka.yml.disabled
/etc/filebeat/modules.d/kibana.yml.disabled
/etc/filebeat/modules.d/logstash.yml.disabled
/etc/filebeat/modules.d/mongodb.yml.disabled
/etc/filebeat/modules.d/mysql.yml.disabled
/etc/filebeat/modules.d/nginx.yml.disabled
/etc/filebeat/modules.d/osquery.yml.disabled
/etc/filebeat/modules.d/postgresql.yml.disabled
/etc/filebeat/modules.d/redis.yml.disabled
/etc/filebeat/modules.d/suricata.yml.disabled
/etc/filebeat/modules.d/system.yml.disabled
/etc/filebeat/modules.d/traefik.yml.disabled
[root@web01 soft]# cd

2、配置文件
[root@web01 ~]# egrep -v "#|^$" /etc/filebeat/filebeat.yml #修改后的配置文件
filebeat.config.modules:
  path: ${path.config}/modules.d/*.yml
  reload.enabled: true
  reload.period: 10s

setup.kibana:
  host: "10.192.27.111:5601"

output.elasticsearch:
  hosts: ["10.192.27.111:9200"]
  indices:
  - index: "nginx-access-%{[beat.version]}-%{+yyyy.MM}"
    when.contains:
      fileset.name: "access"

  - index: "nginx-error-%{[beat.version]}-%{+yyyy.MM}"
    when.contains:
      fileset.name: "error"

setup.template.name: "nginx"
setup.template.pattern: "nginx-*"
setup.template.enabled: false
setup.template.overwrite: true

3、filebeat modules配置
使用nginx模版配置需要安装2个插件,默认从官网下载速度太慢,可以提前下载然后离线安装
https://www.elastic.co/guide/en/elasticsearch/plugins/6.6/ingest-geoip.html
https://www.elastic.co/guide/en/elasticsearch/plugins/6.6/plugin-management-custom-url.html
在线安装:
[root@web01 ~]# /usr/share/elasticsearch/bin/elasticsearch-plugin install ingest-user-agent
[root@web01 ~]# /usr/share/elasticsearch/bin/elasticsearch-plugin install ingest-geoip
离线下载安装:
[root@web01 ~]# wget https://artifacts.elastic.co/downloads/elasticsearch-plugins/ingest-user-agent/ingest-user-agent-6.6.0.zip
[root@web01 ~]# wget https://artifacts.elastic.co/downloads/elasticsearch-plugins/ingest-geoip/ingest-geoip-6.6.0.zip
[root@web01 ~]# /usr/share/elasticsearch/bin/elasticsearch-plugin install file:///root/ingest-geoip-6.6.0.zip
[root@web01 ~]# /usr/share/elasticsearch/bin/elasticsearch-plugin install file:///root/ingest-user-agent-6.6.0.zip
注意:6.7之后这两个插件默认集成到了elasticsearch,不需要单独安装了

激活nginx模块:
[root@web01 ~]# filebeat modules enable nginx
Enabled nginx
[root@web01 ~]#  filebeat modules list
Enabled:
nginx

Disabled:
apache2
auditd
elasticsearch
haproxy
icinga
iis
kafka
kibana
logstash
mongodb
mysql
osquery
postgresql
redis
suricata
system
traefik
[root@web01 ~]#
[root@web01 ~]# egrep -v "#|^$" /etc/filebeat/modules.d/nginx.yml
- module: nginx
  access:
    enabled: true
    var.paths: ["/var/log/nginx/access.log"]
  error:
    enabled: true
    var.paths: ["/var/log/nginx/error.log"]


4、重启服务
[root@web01 ~]# systemctl start filebeat
[root@web01 ~]# systemctl status filebeat
● filebeat.service - Filebeat sends log files to Logstash or directly to Elasticsearch.
   Loaded: loaded (/usr/lib/systemd/system/filebeat.service; disabled; vendor preset: disabled)
   Active: active (running) since 二 2020-04-28 21:28:28 CST; 8s ago
     Docs: https://www.elastic.co/products/beats/filebeat
 Main PID: 10646 (filebeat)
   CGroup: /system.slice/filebeat.service
           └─10646 /usr/share/filebeat/bin/filebeat -c /etc/filebeat/filebeat.yml -path.home /usr/share/filebeat -path.config /etc/filebeat -path.data /var/lib/filebeat ...

4月 28 21:28:28 web01 systemd[1]: Started Filebeat sends log files to Logstash or directly to Elasticsearch..


[root@master01 filebeat]# tailf /var/log/filebeat/  #日志
[root@web01 ~]# netstat -anput | grep filebeat #查看端口连接情况
tcp        0      0 10.192.27.100:55290     10.192.27.111:9200      ESTABLISHED 3124/filebeat
[root@web01 ~]#


服务器端(es kibana) 10.192.27.111
省略 参考:https://www.cnblogs.com/linux985/p/11995364.html
https://www.cnblogs.com/linux985/p/12010657.html


5.3 使用模块收集系统日志message和secure日志
如果不需要转换,也可以直接按普通日志模式收集message和secure日志
5.4 导入kibana视图
默认如果使用filbeat模版导入视图会把所有的服务都导入进去,而我们实际上并不需要这么多视图,
而且默认的视图模版只能匹配filebeat-*开头的索引,所以这里我们有2个需要需要解决:
1.通过一定处理只导入我们需要的模版
2.导入的视图模版索引名称可以自定义
解决方法:
1.备份一份filebeat的kibana视图,删除不需要的视图模版文件
2.修改视图文件里默认的索引名称为我们需要的索引名称
cp -a /usr/share/filebeat/kibana /root
find . -type f ! -name "*nginx*"|xargs rm -rf
sed -i 's#filebeat-*#nginx-*#g' Filebeat-nginx-overview.json
替换索引名称
filebeat setup --dashboards -E setup.dashboards.directory=/root/kibana/
5.5 使用模块收集mysql日志和慢日志

5.6 使用模块收集mongo日志和redis日志

二、ELK收集Tomcat日志
1 安装tomcat
yum install tomcat tomcat-webapps tomcat-admin-webapps tomcat-docs-webapp tomcat-javadoc -y
2 启动检查
[root@tomcat ~]# systemctl start tomcat
[root@tomcat ~]# systemctl status tomcat
[root@tomcat ~]# lsof -i:8080
COMMAND   PID   USER   FD   TYPE DEVICE SIZE/OFF NODE NAME
java    18915 tomcat   49u  IPv6  61950      0t0  TCP *:webcache (LISTEN)
3 访问测试

4 修改日志为json格式 [root@tomcat ~]# vim /etc/tomcat/server.xml [root@tomcat ~]# cat -n /etc/tomcat/server.xml #删掉配文件139行 换成下面的 ---------------- 137 <Valve className="org.apache.catalina.valves.AccessLogValve" directory="logs" 138 prefix="localhost_access_log." suffix=".txt" 139 pattern="{"clientip":"%h","ClientUser":"%l","authenticated":"%u","AccessTime":"%t","method":"%r","status":"%s","SendBytes":"%b","Query?string":"%q","partner":"%{Referer}i","AgentVersion":"%{User-Agent}i"}"/> ---------------- 5 重启确认日志是否为json格式 [root@tomcat ~]# systemctl restart tomcat [root@tomcat ~]# tail -f /var/log/tomcat/localhost_access_log.2019-05-13.txt {"clientip":"192.168.47.1","ClientUser":"-","authenticated":"-","AccessTime":"[13/May/2019:13:18:03 +0800]","method":"GET /docs/images/tomcat.gif HTTP/1.1","status":"200","SendBytes":"2066","Query?string":"","partner":"http://192.168.47.175:8080/docs/realm-howto.html","AgentVersion":"Mozilla/5.0 (Macintosh; Intel Mac OS X 10_14_4) AppleWebKit/537.36 (KHTML, like Gecko) Chrome/72.0.3626.109 Safari/537.36"} 在线解析测试正确 6 filebeat配置 [root@tomcat ~]# cat /etc/filebeat/filebeat.yml filebeat.inputs: - type: log enabled: true paths: - /var/log/tomcat/localhost_access_log* json.keys_under_root: true json.overwrite_keys: true setup.kibana: host: "192.168.47.175:5601" output.elasticsearch: hosts: ["localhost:9200"] index: "tomcat-%{[beat.version]}-%{+yyyy.MM.dd}" setup.template.name: "tomcat" setup.template.pattern: "tomcatn-*" setup.template.enabled: false setup.template.overwrite: true 7 配置tomcat收集多个域名的日志 配置多个host标签
学习两个小技巧:将2到7行 复制到8行

三、ELK 收集Java日志

因为java日志的输出信息非常多,需要将多行拼成一个事件,所以需要多行匹配模式
因为elasticsearch本身就是java开发的,所以我们可以直接收集ES的日志
官方参考地址:https://www.elastic.co/guide/en/beats/filebeat/6.6/multiline-examples.html
filebeat配置
[root@master01 ~]# cat /etc/filebeat/filebeat.yml
filebeat.inputs:
- type: log
  enabled: true
  paths:
    - /var/log/elasticsearch/elasticsearch.log
  multiline.pattern: '^['
  multiline.negate: true
  multiline.match: after
setup.kibana:
  host: "10.192.27.111:5601"
output.elasticsearch:
  hosts: ["10.192.27.111:9200"]
  index: "es-%{[beat.version]}-%{+yyyy.MM.dd}"
setup.template.name: "es"
setup.template.pattern: "es-*"
setup.template.enabled: false
setup.template.overwrite: true
[root@master01 ~]#
4.4.1安装docker
rm -rf /etc/yum.repos.d/local.repo 删除本地yum
curl -o /etc/yum.repos.d/CentOS-Base.repo http://mirrors.aliyun.com/repo/Centos-7.repo   #将Centos-7.repo下载下来命令为CentOS-Base.repo
wget -O /etc/yum.repos.d/docker-ce.repo https://mirrors.ustc.edu.cn/docker-ce/linux/centos/docker-ce.repo
sed -i 's#download.docker.com#mirrors.tuna.tsinghua.edu.cn/docker-ce#g' /etc/yum.repos.d/docker-ce.repo

yum install docker-ce -y
systemctl start docker
vi /etc/docker/daemon.json
{
  "registry-mirrors": ["https://registry.docker-cn.com"]
  }
systemctl restart docker


4.4.2运行nginx镜像
[root@node01 ~]# docker pull 10.192.27.111/library/nginx:latest
[root@node01 ~]# docker run --name nginx -p 80:80 -d 10.192.27.111/library/nginx:latest
[root@node01 ~]# docker ps
CONTAINER ID        IMAGE                                   COMMAND                  CREATED             STATUS              PORTS                NAMES
a62d96de01b4        10.192.27.111/library/nginx:latest      "nginx -g 'daemon of…"   12 minutes ago      Up 12 minutes       0.0.0.0:80->80/tcp   nginx

[root@node01 ~]# docker logs -f nginx
10.192.33.11 - - [12/Dec/2019:03:07:16 +0000] "GET / HTTP/1.1" 200 612 "-" "Mozilla/5.0 (Windows NT 6.1; Win64; x64) AppleWebKit/537.36 (KHTML, like Gecko) Chrome/78.0.3904.108 Safari/537.36" "-"
2019/12/12 03:07:17 [error] 6#6: *3 open() "/usr/share/nginx/html/favicon.ico" failed (2: No such file or directory), client: 10.192.33.11, server: localhost, request: "GET /favicon.ico HTTP/1.1", host: "10.192.27.115", referrer: "http://10.192.27.115/"
10.192.33.11 - - [12/Dec/2019:03:07:17 +0000] "GET /favicon.ico HTTP/1.1" 404 555 "http://10.192.27.115/" "Mozilla/5.0 (Windows NT 6.1; Win64; x64) AppleWebKit/537.36 (KHTML, like Gecko) Chrome/78.0.3904.108 Safari/537.36" "-"
10.192.33.11 - - [12/Dec/2019:03:10:09 +0000] "GET / HTTP/1.1" 304 0 "-" "Mozilla/5.0 (Windows NT 6.1; Win64; x64) AppleWebKit/537.36 (KHTML, like Gecko) Chrome/78.0.3904.108 Safari/537.36" "-"

4.4.3配置filebeat收集单个docker日志
官方介绍:
https://www.elastic.co/guide/en/beats/filebeat/6.7/filebeat-input-docker.html
首先查看docker容器的ID
[root@node01 ~]# docker inspect nginx |grep -w "Id"
        "Id": "a62d96de01b44d4eb03f659443f7a0753bdf9c0a0cdb7bbbf9b2e1d6f0a17aca",
[root@node01 ~]#

配置文件
[root@node01 ~]# cat /etc/filebeat/filebeat.yml
filebeat.inputs:
- type: docker
  containers.ids:
    - 'a62d96de01b44d4eb03f659443f7a0753bdf9c0a0cdb7bbbf9b2e1d6f0a17aca'
  tags: ["docker-nginx"]
output.elasticsearch:
  hosts: ["10.192.27.111:9200"]
  index: "docker-nginx-%{[beat.version]}-%{+yyyy.MM.dd}"
setup.template.name: "docker"
setup.template.pattern: "docker-*"
setup.template.enabled: false
setup.template.overwrite: true


4.4.4使用通配符收集所有容器的日志
新版本的filebeat增加了收集多个容器的日志的选项
https://www.elastic.co/guide/en/beats/filebeat/7.2/filebeat-input-container.html

4.4.5配置filebeat通过标签收集多个容器日志
假如我们有多个docker镜像或者重新提交了新镜像,那么直接指定ID的就不是太方便了。
我们从当前的容器提交一个新的镜像并且运行起来
docker commit nginx nginx:v2
docker images
docker run --name nginx -p 8080:80 -d nginx:v2

此时我们的容器目录下就有了两个不同的容器目录
[root@node01 containers]# ls /var/lib/docker/containers/
2338d5038f7a2eac96d84d6cf424fb1829bd754ec5e0df944bdd29ba6d61a54e  3bb5250e7e50a4ed8d1fae7a43d3bf4294864ac4e0af125ae5231cd9bd76b914
如果直接配置filebeat存到es里本台机器所有的容器日志都会混在一起没有办法区分
多容器日志收集处理:
其实收集的日志本质来说还是文件,而这个日志是以容器-json.log命名存放在默认目录下的json格式的文件:
[root@node01 ~]# head -1 /var/lib/docker/containers/2338d5038f7a2eac96d84d6cf424fb1829bd754ec5e0df944bdd29ba6d61a54e/2338d5038f7a2eac96d84d6cf424fb1829bd754ec5e0df944bdd29ba6d61a54e-json.log
{"log":"192.168.47.1 - - [23/May/2019:19:12:04 +0000] "GET / HTTP/1.1" 200 612 "-" "Mozilla/5.0 (Macintosh; Intel Mac OS X 10_14_5) AppleWebKit/537.36 (KHTML, like Gecko) Chrome/74.0.3729.157 Safari/537.36" "-"
","stream":"stdout","time":"2019-05-23T19:12:04.939212514Z"}
但是每个容器的ID都不一样,为了区分不同服务运行的不同容器,可以使用docker-compose通过给容器添加labels标签来作为区分

然后filbeat把容器日志当作普通的json格式来解析并传输到es

操作步骤:
1.安装docker-compose
yum install -y python2-pip

2.这里使用pip安装,默认源为国外,可以使用国内加速,相关网站
https://mirrors.tuna.tsinghua.edu.cn/help/pypi/
pip加速操作命令
pip install -i https://pypi.tuna.tsinghua.edu.cn/simple pip -U
pip config set global.index-url https://pypi.tuna.tsinghua.edu.cn/simple

3.继续安装docker-compose
pip install docker-compose

4.检查
docker-compose version

5.编写docker-compose.yml
[root@node01 ~]# cat docker-compose.yml
version: '3'
services:
  nginx:
    image: nginx:v2
    labels:       #设置一个键值对标签
      service: nginx
    logging:       #日志中使用标签
      options:
        labels: "service"
    ports:
      - "8080:80"    #将80端口暴露给宿主机的8080端口
  db:
    image: nginx:latest
    labels:
      service: db
    logging:
      options:
        labels: "service"
    ports:
      - "80:80"

6.清理镜像
docker ps -a|awk 'NR>1{print "docker rm",$1}'|bash

7.运行docker-compose.yml
docker-compose up -d

8.检查日志是否增加了lable标签
[root@node01 ~]# tail -1 /var/lib/docker/containers/1bfd2c1b077e40b6900aedf23b59c7be32d473a35543032b0d9144c25c436c5a/1bfd2c1b077e40b6900aedf23b59c7be32d473a35543032b0d9144c25c436c5a-json.log
{"log":"2019/12/12 08:55:55 [error] 6#6: *1 open() "/usr/share/nginx/html/favicon.ico" failed (2: No such file or directory), client: 10.192.33.11, server: localhost, request: "GET /favicon.ico HTTP/1.1", host: "10.192.27.115:8080", referrer: "http://10.192.27.115:8080/"
","stream":"stderr","attrs":{"service":"nginx"},"time":"2019-12-12T08:55:55.957430092Z"}   #错误日志 lable标签已经加进去了:"attrs":{"service":"nginx"}
[root@node01 ~]# tail -1 /var/lib/docker/containers/1bfd2c1b077e40b6900aedf23b59c7be32d473a35543032b0d9144c25c436c5a/1bfd2c1b077e40b6900aedf23b59c7be32d473a35543032b0d9144c25c436c5a-json.log
{"log":"10.192.33.11 - - [12/Dec/2019:09:05:52 +0000] "GET / HTTP/1.1" 304 0 "-" "Mozilla/5.0 (Windows NT 6.1; Win64; x64) AppleWebKit/537.36 (KHTML, like Gecko) Chrome/78.0.3904.108 Safari/537.36" "-"
","stream":"stdout","attrs":{"service":"nginx"},"time":"2019-12-12T09:05:52.811988652Z"} #正确日志
[root@node01 ~]#


9.配置filebeat
[root@node01 ~]# cat /etc/filebeat/filebeat.yml
filebeat.inputs:
- type: log
  enabled: true
  paths:
    - /var/lib/docker/containers/*/*-json.log
  json.keys_under_root: true
  json.overwrite_keys: true
output.elasticsearch:
  hosts: ["192.168.47.175:9200"]
  indices:
    - index: "docker-nginx-%{[beat.version]}-%{+yyyy.MM.dd}"
      when.contains:
        attrs.service: "nginx"  #因为新设置的键值对是二级key ,属于attrs下面
    - index: "docker-db-%{[beat.version]}-%{+yyyy.MM.dd}"
      when.contains:
        attrs.service: "db"
setup.template.name: "docker"
setup.template.pattern: "docker-*"
setup.template.enabled: false
setup.template.overwrite: true


################


4.4.6配置filebeat通过服务类型和日志类型多条件创建不同索引
目前为止,已经可以按服务来收集日志了,但是错误日志和正确日志混在了一起,不好区分,所以可以进一步进行条件判断,根据服务和日志类型创建不同的索引
filebeat配置文件
[root@node01 ~]# cat /etc/filebeat/filebeat.yml
filebeat.inputs:
- type: log
  enabled: true
  paths:
    - /var/lib/docker/containers/*/*-json.log
  json.keys_under_root: true
  json.overwrite_keys: true
output.elasticsearch:
  hosts: ["10.192.27.111:9200"]
  indices:
    - index: "docker-nginx-access-%{[beat.version]}-%{+yyyy.MM.dd}"
      when.contains:
          attrs.service: "nginx"   #两个条件  and
          stream: "stdout"
    - index: "docker-nginx-error-%{[beat.version]}-%{+yyyy.MM.dd}"
      when.contains:
          attrs.service: "nginx"
          stream: "stderr"
    - index: "docker-db-access-%{[beat.version]}-%{+yyyy.MM.dd}"
      when.contains:
          attrs.service: "db"
          stream: "stdout"
    - index: "docker-db-error-%{[beat.version]}-%{+yyyy.MM.dd}"
      when.contains:
          attrs.service: "db"
          stream: "stderr"
setup.template.name: "docker"
setup.template.pattern: "docker-*"
setup.template.enabled: false
setup.template.overwrite: true


4.4.7验证提交新镜像运行后日志收集情况
1.提交新镜像
[root@node01 ~]# docker ps -a
CONTAINER ID        IMAGE               COMMAND                  CREATED             STATUS                      PORTS               NAMES
f92f4d747584        nginx:latest        "nginx -g 'daemon of…"   45 minutes ago      Exited (0) 51 seconds ago                       root_db_1
b2c1f4f7f5a2        nginx:v2            "nginx -g 'daemon of…"   45 minutes ago      Exited (0) 51 seconds ago                       root_nginx_1


[root@node01 ~]# docker commit root_nginx_1 nginx:v3
sha256:4457e2b7afc719ef185c75c02031b11c1407efe2e2e57b85f0c9347d04a9ff00
[root@node01 ~]# docker commit root_db_1 nginx:v4
sha256:a7e8d8b3290c817194956aa06fc486ef928853121d9c6224fd64fe759c967dda
[root@node01 ~]# docker images
REPOSITORY          TAG                 IMAGE ID            CREATED             SIZE
nginx               v4                  a7e8d8b3290c        35 seconds ago      109MB
nginx               v3                  4457e2b7afc7        45 seconds ago      109MB
nginx               v2                  c181c6355cd9        2 hours ago         109MB
nginx               latest              53f3fd8007f7        2 weeks ago         109MB
2.修改并运行docker-compose
[root@node01 ~]# cat docker-compose.yml
version: '3'
services:
  nginx:
    image: nginx:v3    # 设置labels
    labels:
      service: nginx
    logging:      # logging设置增加labels.service
      options:
        labels: "service"
    ports:
      - "8080:80"
  db:
    image: nginx:v4
    labels:          # 设置labels
      service: db
    logging:    # logging设置增加labels.service
      options:
        labels: "service"
    ports:
      - "80:80"
[root@node01 ~]# docker-compose up -d
Starting root_nginx_1 ...
Starting root_nginx_1 ... done
Starting root_db_1    ... done

[root@node01 ~]# docker ps
CONTAINER ID        IMAGE               COMMAND                  CREATED             STATUS              PORTS                  NAMES
04308aa3928b        nginx:v4            "nginx -g 'daemon of…"   30 seconds ago      Up 1 second         0.0.0.0:80->80/tcp     root_db_1
49d2e2210e6f        nginx:v3            "nginx -g 'daemon of…"   30 seconds ago      Up 1 second         0.0.0.0:8080->80/tcp   root_nginx_1


3.访问并查看是否有新数据生成
curl logcalhost/zhangya.html
curl logcalhost:8080/zhangya.html
4.经过查看发现已经成功收集到了日志,这样我们就做到了不用修改filebeat配置文件也可以持续的收集新镜像的日志并按分类创建不同的索引
4.4.8修改docker容器内日志类型为json
刚才收集的docker内的日志类型为普通格式,如果我们修改为json格式会如何呢?