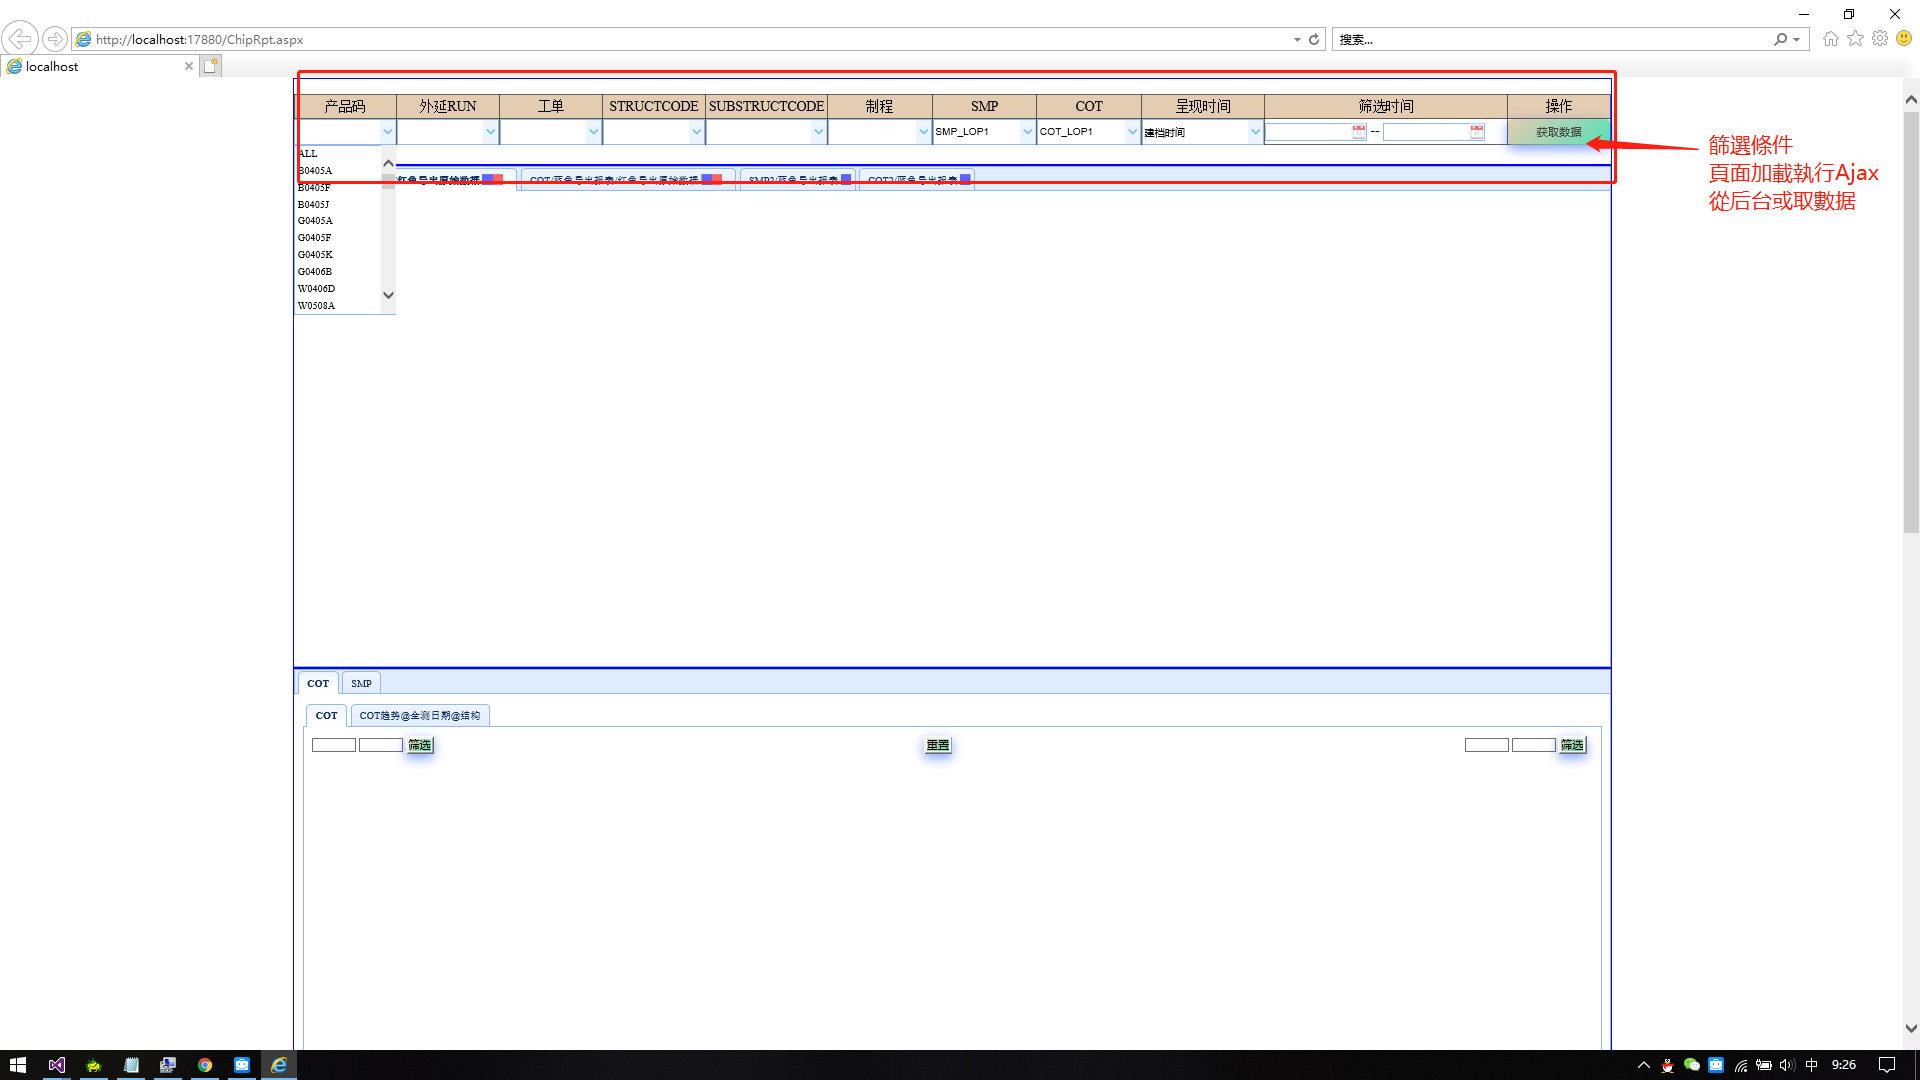
一.效果圖
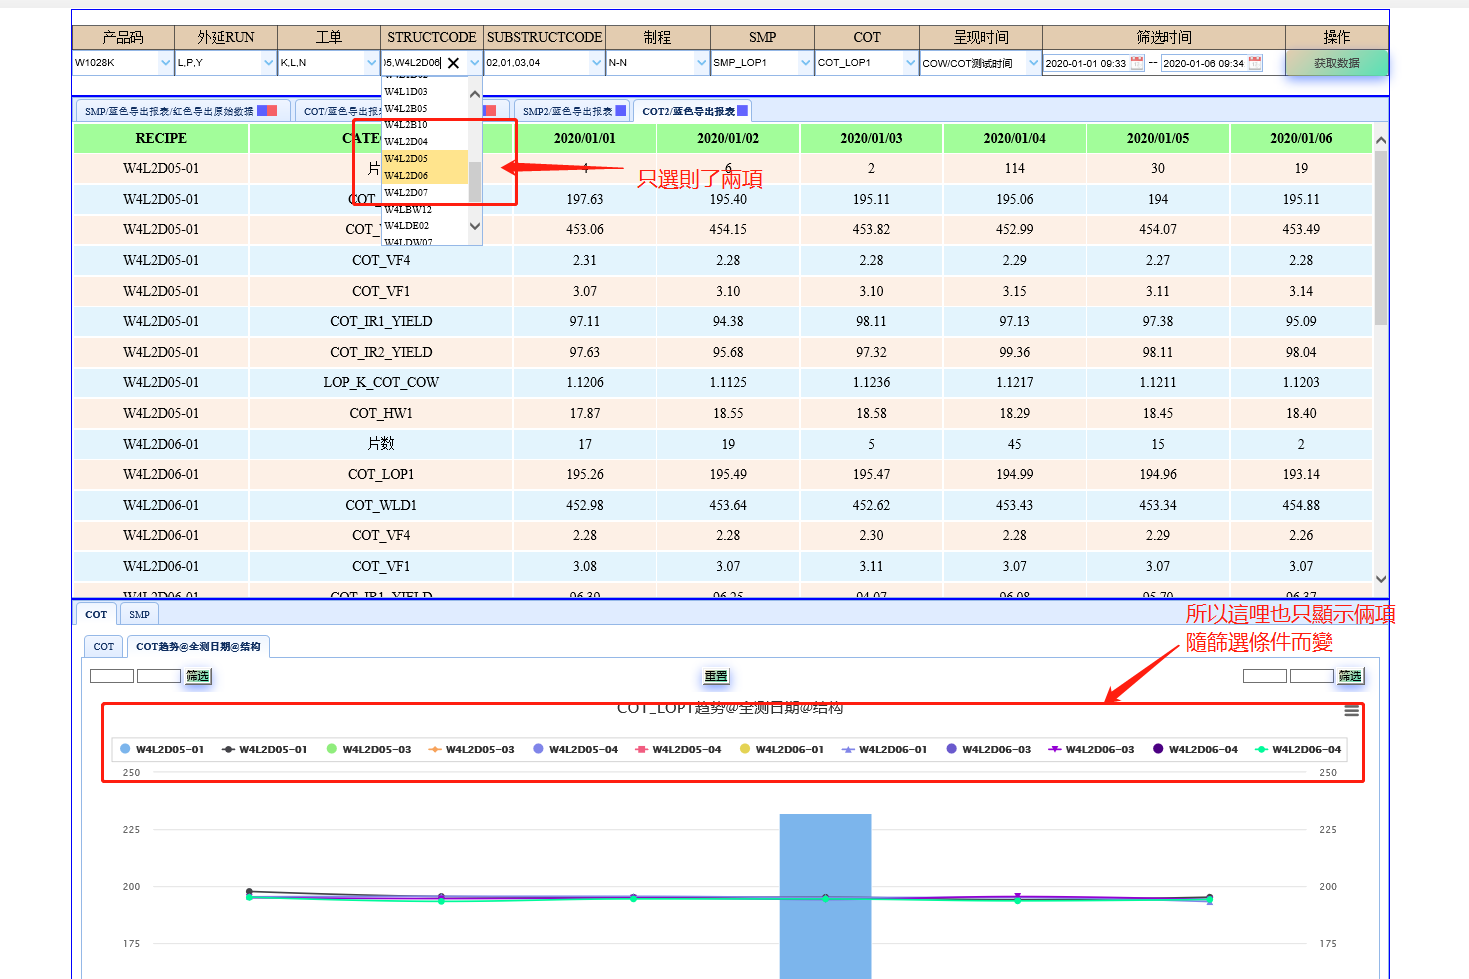
1.通過篩選條件獲得數据(數据可能是一條也可能是多條)

二.代碼 (實現方法有很多種 因爲是.net 所以好多技術也沒有如HashMap都沒有 只能字符串拼接的形式一步步實現)
<%@ Page Language="C#" AutoEventWireup="true" CodeBehind="ChipRpt.aspx.cs" Inherits="MESRPT.WebForm1" %<!DOCTYPE html><html xmlns="http://www.w3.org/1999/xhtml"><head runat="server">
<meta http-equiv="Content-Type" content="text/html; charset=utf-8" /> <title></title> <script type="text/javascript" src="easyui/jquery-3.2.1.min.js"></script <script type="text/javascript" src="highcharts/highcharts.js"></script> <script type="text/javascript" src="highcharts/highcharts-zh_CN.js"></script> <script type="text/javascript" src="highcharts/exporting.js"></script> <script type="text/javascript" src="highcharts/export-data.js"></script> <link type="text/css" href="easyui/easyui.css" rel="stylesheet" /> <script type="text/javascript" src="easyui/jquery.easyui.min.js"></script> <script type="text/javascript" src="easyui/easyui-lang-zh_CN.js"></script> <script type="text/javascript" src="easyui/jquery.jdirk.js"></script> <link type="text/css" href="easyui/jeasyui.extensions.css" rel="stylesheet" /> <script type="text/javascript" src="easyui/jeasyui.extensions.js"></script> <script type="text/javascript" src="easyui/jeasyui.extensions.linkbutton.js"></script> <script type="text/javascript" src="easyui/jeasyui.extensions.menu.js"></script> <script type="text/javascript" src="easyui/jeasyui.extensions.panel.js"></script> <script type="text/javascript" src="easyui/jeasyui.extensions.window.js"></script> <script type="text/javascript" src="easyui/jeasyui.extensions.dialog.js"></script> <script type="text/javascript" src="easyui/jeasyui.extensions.datagrid.js"></script> <script type="text/javascript" src="easyui/datagrid-export.js"></script> <!-- 表格JS--> <script type="text/javascript" src="DataTables/Table2.js"></script> <script type="text/javascript" src="DataTables/jquery.dataTables.min.js"></script> <link type="text/css" href="DataTables/jquery.dataTables.min.css" rel="stylesheet" /> <!-- 表格JS 上面引入記得引用自己的--> </head> <style> html,body{ width:100%; height:100%; } * { padding: 0px; margin: 0px; } #allpx { margin: 0px auto; width: 1550px; height: 1400px; } #screen { width: 1550px; height: 100px; border: 1px solid blue; } .present { width: 1550px; height: 800px; border: 1px solid blue; } .scr td { width: 110px; height: 27px; font-size: 16px; } .ui-widget-overlay { position: absolute; top: 0; left: 0; width: 100%; height: 100%; background-color: Gray; opacity: .30; filter: Alpha(Opacity=30); } .btbangr{ background: linear-gradient(-45deg, rgba(87, 225, 181, 1) 0%, rgba(200, 154, 97,0.5) 100%); box-shadow: 0 5px 20px rgba(0, 63, 255, .5); } </style> <body > <!--遮罩层,请求ajax时显示,屏幕无法再交互--> <div id="base" class="ui-widget-overlay" style="z-index: 997;"> <iframe class="ui-widget-overlay" runat="server" id="iFameBase" style="z-index: 998;"></iframe> </div> <div id="divSK" style="position: absolute; left: 45%; top: 42%; 30%; height: 30%; z-index: 999;"> <img runat="server" id="imgLoading" src="easyui/images/loading.gif" /> </div> <!--遮罩层,请求ajax时显示,屏幕无法再交互 這可以不用管--> <div id="allpx"> <div id="screen"> <br/> <table border="1" style="margin-left: 0px; border-collapse: collapse;"> <tr class="scr" style="background-color: rgba(200, 154, 97,0.5); text-align: center"> <td>产品码</td> <td>外延RUN</td> <td>工单</td> <td>STRUCTCODE</td> <td>SUBSTRUCTCODE</td> <td>制程</td> <td>SMP</td> <td>COT</td> <td>呈现时间</td> <td style="300px;">筛选时间</td> <td>操作</td> </tr> <tr> <td> <input id='productDevice' style=" 120px; height: 30px;" /> </td> <td> <input id='productEpitaxy' style=" 120px; height: 30px;" /> </td> <td> <input id='productWork' style=" 120px; height: 30px;" /> </td> <td> <input id='productStructure' style=" 120px; height: 30px;" /> </td> <td> <input id='productSubstructure' style=" 143px; height: 30px;" /> </td> <td> <input id='productProcess' style=" 122px; height: 30px;" /> </td> <%--smp--%> <td> <select id="S_smp" class="easyui-combobox" name="dept" style="122px;height:30px;"> <option value="SMP_LOP1">SMP_LOP1</option> <option value="SMP_VF1">SMP_VF1</option> <option value="SMP_WLD1">SMP_WLD1</option> <option value="BS">BS</option> <option value="MM400">MM400</option> <option value="SMP_VF4">SMP_VF4</option> <option value="SMP_HW1">SMP_HW1</option> <option value="SMP_IR1_YIELD">SMP_IR1_YIELD</option> <option value="SMP_VZ1">SMP_VZ1</option> <option value="ESD01_YIELD">ESD01_YIELD</option> <option value="ESD03_YIELD">ESD03_YIELD</option> <option value="COW_COT_LOP1">COW_COT_LOP1</option> </select> </td> <%--cot--%> <td> <select id="S_cot" class="easyui-combobox" name="dept" style="122px;height:30px;"> <option value="COT_LOP1">COT_LOP1</option> <option value="COT_WLD1">COT_WLD1</option> <option value="COT_VF4">COT_VF4</option> <option value="COT_VF1">COT_VF1</option> <option value="COT_IR1_YIELD">COT_IR1_YIELD</option> <option value="COT_IR2_YIELD">COT_IR2_YIELD</option> <option value="LOP_K_COT_COW">LOP_K_COT_COW</option> <option value="COT_HW1">COT_HW1</option> </select> </td> <td> <select id="select" class="easyui-combobox" name="dept" style="144px;height:30px;"> <option value="BUILD">建档时间</option> <option value="TEST">COW/COT测试时间</option> </select> </td> <td> <input style="float: left;120px;" id="starttime" name="datetimebox" class="easyui-datetimebox" /> -- <input style="float: left;120px;" id="endtime" name="datetimebox" class="easyui-datetimebox" /> </td> <td style="text-align: center"> <input id='subRpt' class="easyui-menubutton btbangr" style="120px;height:30px;" type="button" value="获取数据" /> </td> </tr> </table>
</div> <!-- 表格区域--> <div style=" 1550px; height: 590px; border: 1px solid blue;"> <div class="easyui-tabs" style=" 1550px; height: 590px;"> <div id="T_smp" title="SMP/蓝色导出报表/红色导出原始数据" data-options="tools:'#p-tools'"> </div> <div id="T_cot" title="COT/蓝色导出报表/红色导出原始数据" data-options="tools:'#p2-tools'"> </div> <div id="T_add_smp" title="SMP2/蓝色导出报表" data-options="tools:'#p3-tools'"> </div> <div id="T_add_cot" title="COT2/蓝色导出报表" data-options="tools:'#p4-tools'"> </div> </div> <div id="p-tools"> <a href="OUTEXCELSMP数据导出.xlsx" style="background-color:blue;" title="下载表格数据"></a> <a href="javascript:void(0)" style="background-color:red;" title="下载原始数据" onclick="Donload('SMP')"></a> <a href="OUTEXCELSMP原始数据导出.xlsx" id="get_SMP_resource" hidden="hidden"></a> </div> <div id="p2-tools"> <a href="OUTEXCELCOT数据导出.xlsx" style="background-color:blue;" title="下载表格数据"></a> <a href="javascript:void(0)" style="background-color:red;" title="下载原始数据" onclick="Donload('COT')"></a> <a href="OUTEXCELCOT原始数据导出.xlsx" id="get_COT_resource" hidden="hidden"></a> </div> <div id="p3-tools"> <a href="OUTEXCELT_add_smp数据导出.xlsx" style="background-color:blue;" title="下载表格数据"></a> </div> <div id="p4-tools"> <a href="OUTEXCELT_add_cot数据导出.xlsx" style="background-color:blue;" title="下载表格数据"></a> </div> </div> <script>
//Ajax下載導出 excel文檔的一個異步請求方法 function Donload(str) { var starttime = $("#starttime").datetimebox("getValue").substring(0, 10).replace(/-/g, "/"); var endtime = $("#endtime").datetimebox("getValue").substring(0, 10).replace(/-/g, "/"); var select = $("#select").combobox("getValue"); $.ajax({ url: 'Initialize.ashx?type=D', data: { "starttime": starttime, "endtime": endtime, "select": select, }, dataType: 'text', success: function (result) { //alert("开始下载数据?") if (str == 'COT') { //$("#get_COT_resource").trigger("click"); var a = document.getElementById("get_COT_resource"); a.click(); } else { //$("#get_SMP_resource").trigger("click"); var a = document.getElementById("get_SMP_resource"); a.click(); } // alert("over"); }, cache: false }); } </script> <!-- 表格区域--> <div class="present" style="height:950px;"> <div class="easyui-tabs" data-options="tools:'#tab-tools'" style=" 1550px; height:950px"> <div title="COT" style="padding: 10px;"> <div class="easyui-tabs" data-options="fit:true,plain:true"> <div title="COT" style="padding: 10px;"> <div style="float:left;150px;height:30px;"> <input type="text" id="min" style="50px;"/> <input type="text" id="max" style="50px;"/> <input type="button" value="筛选" onclick="cot_lop1()" class="btbangr"/> </div> <div style="float:left;margin-left:570px;"> <input type="button" value="重置" onclick="chiprptcs1()" class="btbangr"/> </div> <div style="float:right;150px;height:30px;"> <input type="text" id="min2" style="50px;"/> <input type="text" id="max2" style="50px;"/> <input type="button" value="筛选" onclick="cot_lop1()" class="btbangr""/> </div> <!-- 图表容器 DOM --> <div id="container1" style="min- 1500px; height: 800px"></div> <div class="message" ></div> </div> <div title="COT趋势@全测日期@结构" style="padding: 10px;"> <div style="float:left;150px;height:30px;"> <input type="text" id="min3" style="50px;"/> <input type="text" id="max3" style="50px;"/> <input type="button" value="筛选" onclick="cot_lop1_gz()" class="btbangr"/> </div> <div style="float:left;margin-left:570px;"> <input type="button" value="重置" onclick="chiprptcs2()" class="btbangr"/> </div> <div style="float:right;150px;height:30px;"> <input type="text" id="min4" style="50px;"/> <input type="text" id="max4" style="50px;"/> <input type="button" value="筛选" onclick="cot_lop1_gz()" class="btbangr"/> </div> <!-- 图表容器 DOM --> <div id="container2" style="min- 1500px; height: 800px"></div> <div class="message"></div> </div> <%--<div title="量产图表 - 全测日期" style="padding: 10px;"> <div> <!-- 图表容器 DOM --> <div id="container3" style="min- 1000px; height: 600px"></div> <div class="message"></div> </div> </div>--%> </div> </div> <div title="SMP" style="padding: 10px;"> <div class="easyui-tabs" data-options="fit:true,plain:true"> <div title="SMP" style="padding: 10px;" id="smp_lop1"> <div style="float:left;150px;height:30px;"> <input type="text" id="min7" style="50px;"/> <input type="text" id="max7" style="50px;"/> <input type="button" value="筛选" onclick="smp_lop1()" class="btbangr"/> </div> <div style="float:left;margin-left:570px;"> <input type="button" value="重置" onclick="chiprptcs4()" class="btbangr"/> </div> <div style="float:right;150px;height:30px;"> <input type="text" id="min8" style="50px;"/> <input type="text" id="max8" style="50px;"/> <input type="button" value="筛选" onclick="smp_lop1()" class="btbangr"/> </div> <!-- 图表容器 DOM --> <div id="container4" style="min- 1500px; height: 800px"></div> <div class="message"></div> </div> <div title="SMP趋势@抽测日期@结构" style="padding: 10px;"> <div style="float:left;150px;height:30px;"> <input type="text" id="min9" style="50px;"/> <input type="text" id="max9" style="50px;"/> <input type="button" value="筛选" onclick="smp_lop1_gz()" class="btbangr"/> </div> <div style="float:left;margin-left:570px;"> <input type="button" value="重置" onclick="chiprptcs5()" class="btbangr"/> </div> <div style="float:right;150px;height:30px;"> <input type="text" id="min10" style="50px;"/> <input type="text" id="max10" style="50px;"/> <input type="button" value="筛选" onclick="smp_lop1_gz()" class="btbangr"/> </div> <!-- 图表容器 DOM --> <div id="container5" style="min- 1500px; height: 800px"></div> <div class="message"></div> </div> </div> </div> </div> </div> <div class="present"> <div class="easyui-tabs" data-options="fit:true,plain:true"> <div title="量产图表 - 全测日期" style="padding: 10px;"> <div style="float:left;150px;height:30px;"> <input type="text" id="min5" style="50px;"/> <input type="text" id="max5" style="50px;"/> <input type="button" value="筛选" onclick="smp_lop1_lc()" class="btbangr"/> </div> <div style="float:left;margin-left:570px;"> <input type="button" value="重置" onclick="chiprptcs3()" class="btbangr"/> </div> <div style="float:right;150px;height:30px;"> <input type="text" id="min6" style="50px;"/> <input type="text" id="max6" style="50px;"/> <input type="button" value="筛选" onclick="smp_lop1_lc()" class="btbangr"/> </div> <!-- 图表容器 DOM --> <div id="container3" style="min- 1500px; height: 700px"></div> <div class="message"></div> </div> <div title="量产图表 - 抽测日期" style="padding: 10px;"> <div style="float:left;150px;height:30px;"> <input type="text" id="min11" style="50px;"/> <input type="text" id="max11" style="50px;"/> <input type="button" value="筛选" onclick="cot_lop1_lc()" class="btbangr"/> </div> <div style="float:left;margin-left:570px;"> <input type="button" value="重置" onclick="chiprptcs6()" class="btbangr"/> </div> <div style="float:right;150px;height:30px;"> <input type="text" id="min12" style="50px;"/> <input type="text" id="max12" style="50px;"/> <input type="button" value="筛选" onclick="cot_lop1_lc()" class="btbangr"/> </div> <!-- 图表容器 DOM --> <div id="container6" style="min- 1500px; height: 700px"></div> <div class="message"></div> </div> </div> </div> </div> <script>
//Ajax的數据負值給全局變量 主要爲了實現 坐標y軸值 自定億修改 復位 var SMP = ""; var COT = ""; var title1 = "";//COT_sum var data1 = ""; var title4 = "";//SMP_sum var data4 = ""; var title2 = "";//COT_recipe var data2 = ""; var title5 = "";//SMP_recipe var data5 = ""; var title3 = "";//COT_wo var data3 = ""; var title6 = "";//SMP_wo var data6 = ""; var Text = ""; var Text2 = ""; //顔色數組 var color = [ '#7cb5ec', '#434348', '#90ed7d', '#f7a35c', '#8085e9', '#f15c80', '#e4d354', '#8085e8', '#6A5ACD', '#9400D3']; //将后台传来的字符串数据转为下拉框列表 function listTodata(list) { var data = "{id:'ALL',text:'ALL'},"; for (var i = 0; i < list.length; i++) { data += "{id:'" + list[i] + "', text:'" + list[i] + "'}," } data = eval("[" + data.substr(0, data.length - 1) + "]"); return data; } $(function () { $("#base").hide(); //遮盖层隐藏 $("#divSK").hide(); $('#productDevice').combobox({ //多选下拉框初始化 valueField: 'id', textField: 'text', multiple: true }); $('#productEpitaxy').combobox({ //多选下拉框初始化 valueField: 'id', textField: 'text', multiple: true }); $('#productWork').combobox({ //多选下拉框初始化 valueField: 'id', textField: 'text', multiple: true }); $('#productStructure').combobox({ //多选下拉框初始化 valueField: 'id', textField: 'text', multiple: true }); $('#productSubstructure').combobox({ //多选下拉框初始化 valueField: 'id', textField: 'text', multiple: true }); $('#productProcess').combobox({ //多选下拉框初始化 valueField: 'id', textField: 'text', multiple: true }); //页面亲求Ajax时显示遮盖层 $(document).ajaxStart(function () { $("#base").show(); $("#divSK").show(); }).ajaxStop(function () { $("#base").hide(); $("#divSK").hide(); }); //页面加载完成时初始化,填充下拉款数据 $.ajax({ url: 'Initialize.ashx?type=I', success: function (result) { var productNo = result.split('&')[0].split(','); var epiRun = result.split('&')[1].split(','); var Wo = result.split('&')[2].split(','); var Struct = result.split('&')[3].split(','); var subStruct = result.split('&')[4].split(','); var Recipe = result.split('&')[5].split(','); var showTime = result.split('&')[6].split(','); //多选下拉框加载数据 $('#productDevice').combobox('loadData', listTodata(productNo)); $('#productEpitaxy').combobox('loadData', listTodata(epiRun)); $('#productWork').combobox('loadData', listTodata(Wo)); $('#productStructure').combobox('loadData', listTodata(Struct)); $('#productSubstructure').combobox('loadData', listTodata(subStruct)); $('#productProcess').combobox('loadData', listTodata(Recipe)); }, cache: false }); /**********************************開始Highcharts**************************************************************/ Highcharts.setOptions({ // 所有语言文字相关配置都设置在 lang 里 lang: { printChart: "打印图表", downloadJPEG: "下载JPEG 图片", resetZoom: '重置', resetZoomTitle: '重置缩放比例' } }); //点击按钮获取数据 $("#subRpt").click(function () { var starttime = $("#starttime").datetimebox("getValue").substring(0, 10).replace(/-/g, "/"); var endtime = $("#endtime").datetimebox("getValue").substring(0, 10).replace(/-/g, "/"); if (starttime == "" || endtime == "") { starttime = "2019/11/01"; endtime = "2019/11/21"; //alert("请选则时间段!!") //return; } var select2 = $("#select").combobox("getValue"); SMP = $("#S_smp").combobox("getValue"); COT = $("#S_cot").combobox("getValue"); //获取多选下拉框的值 var productDevice = $("#productDevice").datetimebox("getValues").toString(); var productEpitaxy = $("#productEpitaxy").datetimebox("getValues").toString(); var productWork = $("#productWork").datetimebox("getValues").toString(); var productStructure = $("#productStructure").datetimebox("getValues").toString(); var productSubstructure = $("#productSubstructure").datetimebox("getValues").toString(); var productProcess = $("#productProcess").datetimebox("getValues").toString();
//異步到ashx頁面查詢數据 $.ajax({ url: "Initialize.ashx?type=T", data: { "productDevice": productDevice,//产品码 "productEpitaxy": productEpitaxy,//外延RUN "productWork": productWork,//工单 "productStructure": productStructure,//STRUCTCODE "productSubstructure": productSubstructure,//SUBSTRUCTCODE "productProcess": productProcess,//制程 "starttime": starttime,//在 "endtime": endtime,//之间 "select": select2,//呈现时间 "SMP": SMP, "COT": COT }, dataType: 'text', success: function (result) {//后台將數据格式轉換后 以字符串合并 前端以后台拼接的#或&等等 劃分 if (result.indexOf("Error")!=-1) { alert(result+"此筛选条件下暂无数据!!!" + result); return; } //T_cot var table1 = eval(result.split('#')[0].split('&')[0]); var title_1 = eval(result.split('#')[0].split('&')[1]); //T_smp var table2 = eval(result.split('#')[1].split('&')[0]); var title_2 = eval(result.split('#')[1].split('&')[1]); //t_add_smp var table_add_smp = eval(result.split('#')[8].split('&')[0]);//smp var title_add_smp = eval(result.split('#')[8].split('&')[1]); //t_add_cot var table_add_cot = eval(result.split('#')[9].split('&')[0]);//cot var title_add_cot = eval(result.split('#')[9].split('&')[1]);
//画表
Table().init({ id: 'T_add_cot', header: title_add_cot, data: table_add_cot });//table表格數据直接顯示 DataTables.js封裝的方法工具


                        Table().init({
                            id: 'T_add_smp',
                            header: title_add_smp,
                            data: table_add_smp
                        });
                        Table().init({
                            id: 'T_cot',
                            header: title_1,
                            data: table1
                        });

                        Table().init({
                            id: 'T_smp',
                            header: title_2,
                            data: table2
                        });
title1 = eval(result.split('#')[2].split('&')[1]);//COT_sum data1 = eval(result.split('#')[2].split('&')[0]); title4 = eval(result.split('#')[3].split('&')[1]);//SMP_sum data4 = eval(result.split('#')[3].split('&')[0]); title2 = eval(result.split('#')[4].split('&')[1]);//COT_recipe data2 = eval(result.split('#')[4].split('&')[0]); title5 = eval(result.split('#')[5].split('&')[1]);//SMP_recipe data5 = eval(result.split('#')[5].split('&')[0]); title3 = eval(result.split('#')[6].split('&')[1]);//COT_wo data3 = eval(result.split('#')[6].split('&')[0]); title6 = eval(result.split('#')[7].split('&')[1]);//SMP_wo data6 = eval(result.split('#')[7].split('&')[0]); //画图 数据显示 if (select2 == "TEST") { //测式 Text= SMP+"抽测日期"; Text2 =COT+"全测日期"; } else { //建档 Text = SMP+"建档日期"; Text2 = COT+"建档日期"; } chiprptcs1();//調用方法 chiprptcs2();// chiprptcs3(); chiprptcs4(); chiprptcs5(); chiprptcs6(); }, cache: false, error: function (xhr) { $.messager.alert('异常', ' ' + xhr); } }) }) ////////////////////////js脚本结束 }); //Ajax回調的數据已經付給了全局便量 然後直接將全侷變量值賦給highcharts對映的方法上 function chiprptcs1() { //*********************************************************************cot_总计************************** $("#min").val(""); $("#max").val(""); $("#min2").val(""); $("#max2").val(""); var chart1 = Highcharts.chart('container1', { chart: { //type: 'column' zoomType: 'y', }, title: { text: Text2//'COW_LOP1_AVG趋势@抽测日期@结构' }, xAxis: { categories: title1 }, yAxis: [{ min: 0, title: { }, stackLabels: { // 堆叠数据标签 enabled: true, style: { fontWeight: 'bold', color: (Highcharts.theme && Highcharts.theme.textColor) || 'gray' } } }, { min: 0, title: { }, opposite: true } ], tooltip: { formatter: function () { return '<b>' + this.x + '</b><br/>' + this.series.name + ': ' + this.y + '<br/>' } }, legend: { align: 'center', x: 0, verticalAlign: 'top', //layout: 'vertical', y: 0, floating: false, backgroundColor: (Highcharts.theme && Highcharts.theme.background2) || 'white', borderColor: '#CCC', borderWidth: 1, shadow: false }, plotOptions: { column: { stacking: 'normal', dataLabels: { enabled: false, color: (Highcharts.theme && Highcharts.theme.dataLabelsColor) || 'white', style: { textOutline: '1px 1px black' } } } }, series: data1 //數据1 }); //*********************************************************************cot_总计************************* } function chiprptcs4() { $("#min7").val(""); $("#max7").val(""); $("#min8").val(""); $("#max8").val(""); //*********************************************************************smp——总计************************** var chart4 = Highcharts.chart('container4', { chart: { zoomType: 'y', }, title: { text: Text// 'COW_LOP1_AVG趋势@抽测日期@结构' }, xAxis: { categories: title4 }, yAxis: [{ min: 0, title: { }, stackLabels: { // 堆叠数据标签 enabled: true, style: { fontWeight: 'bold', color: (Highcharts.theme && Highcharts.theme.textColor) || 'gray' } } }, { min: 0, title: { }, opposite: true } ], legend: { align: 'center', x: 0, verticalAlign: 'top', //layout: 'vertical', y: 0, floating: false, backgroundColor: (Highcharts.theme && Highcharts.theme.background2) || 'white', borderColor: '#CCC', borderWidth: 1, shadow: false }, tooltip: { formatter: function () { return '<b>' + this.x + '</b><br/>' + this.series.name + ': ' + this.y + '<br/>' } }, plotOptions: { column: { stacking: 'normal', dataLabels: { enabled: false, color: (Highcharts.theme && Highcharts.theme.dataLabelsColor) || 'white', style: { textOutline: '1px 1px black' } } } }, series: data4 }); //*********************************************************************smp--总计 } function chiprptcs2() { $("#min3").val(""); $("#max3").val(""); $("#min4").val(""); $("#max4").val(""); //*********************************************************************cot结构************************** var chart2 = Highcharts.chart('container2', { chart: { zoomType: 'y', //type: 'column' }, colors: color, title: { text: COT+'趋势@全测日期@结构' }, xAxis: { categories: title2 }, yAxis: [{ min: 0, title: { //text: '水果消费总量' }, stackLabels: { // 堆叠数据标签 enabled: true, style: { fontWeight: 'bold', color: (Highcharts.theme && Highcharts.theme.textColor) || 'gray' } } }, { min: 0, title: { //text: '水果消费总量' }, opposite: true } ], legend: { align: 'center', x: 0, verticalAlign: 'top', //layout: 'vertical', y: 0, floating: false, backgroundColor: (Highcharts.theme && Highcharts.theme.background2) || 'white', borderColor: '#CCC', borderWidth: 1, shadow: false }, tooltip: { formatter: function () { return '<b>' + this.x + '</b><br/>' + this.series.name + ': ' + this.y + '<br/>' '总量: ' + this.point.stackTotal; } }, plotOptions: { column: { stacking: 'normal', dataLabels: { enabled: false, color: (Highcharts.theme && Highcharts.theme.dataLabelsColor) || 'white', style: { // 如果不需要数据标签阴影,可以将 textOutline 设置为 'none' textOutline: '1px 1px black' } } } }, series: data2 }); //*********************************************************************cot结构 } function chiprptcs5() { $("#min9").val(""); $("#max9").val(""); $("#min10").val(""); $("#max10").val(""); //*********************************************************************cot结构************************** var chart5 = Highcharts.chart('container5', { chart: { zoomType: 'y', //type: 'column' }, colors: color, title: { text: SMP+'趋势@抽测日期@结构' }, xAxis: { categories: title5 }, yAxis: [{ min: 0, title: { //text: '水果消费总量' }, stackLabels: { // 堆叠数据标签 enabled: true, style: { fontWeight: 'bold', color: (Highcharts.theme && Highcharts.theme.textColor) || 'gray' } } }, { min: 0, title: { //text: '水果消费总量' }, opposite: true } ], legend: { align: 'center', x: 0, verticalAlign: 'top', //layout: 'vertical', y: 0, floating: false, backgroundColor: (Highcharts.theme && Highcharts.theme.background2) || 'white', borderColor: '#CCC', borderWidth: 1, shadow: false }, tooltip: { formatter: function () { return '<b>' + this.x + '</b><br/>' + this.series.name + ': ' + this.y + '<br/>' '总量: ' + this.point.stackTotal; } }, plotOptions: { column: { stacking: 'normal', dataLabels: { enabled: false, color: (Highcharts.theme && Highcharts.theme.dataLabelsColor) || 'white', style: { // 如果不需要数据标签阴影,可以将 textOutline 设置为 'none' textOutline: '1px 1px black' } } } }, series: data5 }); //*********************************************************************smp结构 } function chiprptcs3() { $("#min5").val(""); $("#max5").val(""); $("#min6").val(""); $("#max6").val(""); //*********************************************************************cot_wo************************** var chart3 = Highcharts.chart('container3', { chart: { zoomType: 'y', //type: 'column' }, colors: color, title: { text: COT+'@全测日期' }, xAxis: { categories: title3 }, yAxis: [{ min: 0, title: { //text: '水果消费总量' }, stackLabels: { // 堆叠数据标签 enabled: true, style: { fontWeight: 'bold', color: (Highcharts.theme && Highcharts.theme.textColor) || 'gray' } } }, { min: 0, title: { //text: '水果消费总量' }, opposite: true } ], legend: { align: 'center', x: 0, verticalAlign: 'top', //layout: 'vertical', y: 0, floating: false, backgroundColor: (Highcharts.theme && Highcharts.theme.background2) || 'white', borderColor: '#CCC', borderWidth: 1, shadow: false }, tooltip: { formatter: function () { return '<b>' + this.x + '</b><br/>' + this.series.name + ': ' + this.y + '<br/>' '总量: ' + this.point.stackTotal; } }, plotOptions: { column: { stacking: 'normal', dataLabels: { enabled: false, color: (Highcharts.theme && Highcharts.theme.dataLabelsColor) || 'white', style: { // 如果不需要数据标签阴影,可以将 textOutline 设置为 'none' textOutline: '1px 1px black' } } } }, series: data3 }); //*********************************************************************cot_wo } function chiprptcs6() { $("#min11").val(""); $("#max11").val(""); $("#min12").val(""); $("#max12").val(""); //*********************************************************************smp_wo************************** var chart6 = Highcharts.chart('container6', { chart: { zoomType: 'y', //type: 'column' }, colors: color, title: { text: SMP+'趋势@抽测日期' }, xAxis: { categories: title6 }, yAxis: [{ min: 0, title: { //text: '水果消费总量' }, stackLabels: { // 堆叠数据标签 enabled: true, style: { fontWeight: 'bold', color: (Highcharts.theme && Highcharts.theme.textColor) || 'gray' } } }, { min: 0, title: { //text: '水果消费总量' }, opposite: true } ], legend: { align: 'center', x: 0, verticalAlign: 'top', //layout: 'vertical', y: 0, floating: false, backgroundColor: (Highcharts.theme && Highcharts.theme.background2) || 'white', borderColor: '#CCC', borderWidth: 1, shadow: false }, tooltip: { formatter: function () { return '<b>' + this.x + '</b><br/>' + this.series.name + ': ' + this.y + '<br/>' '总量: ' + this.point.stackTotal; } }, plotOptions: { column: { stacking: 'normal', dataLabels: { enabled: false, color: (Highcharts.theme && Highcharts.theme.dataLabelsColor) || 'white', style: { // 如果不需要数据标签阴影,可以将 textOutline 设置为 'none' textOutline: '1px 1px black' } } } }, series: data6 }); //*********************************************************************smp_wo } /************真想打提需求的人 hcharts都自帶放大縮小還要我做個 自定亦賦值y軸 操****************/ function cot_lop1_lc() { var m = $("#min11").val(); var mx = $("#max11").val(); var m2 = $("#min12").val(); var mx2 = $("#max12").val(); //*********************************************************************smp_wo************************** var chart6 = Highcharts.chart('container6', { chart: { zoomType: 'y', //type: 'column' }, title: { text: SMP + '趋势@抽测日期' }, colors: color, xAxis: { categories: title6 }, yAxis: [{ min: m, max: mx, title: { //text: '水果消费总量' }, stackLabels: { // 堆叠数据标签 enabled: true, style: { fontWeight: 'bold', color: (Highcharts.theme && Highcharts.theme.textColor) || 'gray' } } }, { min: m2, max:mx2, title: { //text: '水果消费总量' }, opposite: true } ], legend: { align: 'center', x: 0, verticalAlign: 'top', //layout: 'vertical', y: 0, floating: false, backgroundColor: (Highcharts.theme && Highcharts.theme.background2) || 'white', borderColor: '#CCC', borderWidth: 1, shadow: false }, tooltip: { formatter: function () { return '<b>' + this.x + '</b><br/>' + this.series.name + ': ' + this.y + '<br/>' '总量: ' + this.point.stackTotal; } }, plotOptions: { column: { stacking: 'normal', dataLabels: { enabled: false, color: (Highcharts.theme && Highcharts.theme.dataLabelsColor) || 'white', style: { // 如果不需要数据标签阴影,可以将 textOutline 设置为 'none' textOutline: '1px 1px black' } } } }, series: data6 }); //*********************************************************************smp_wo } function smp_lop1_gz() { var m = $("#min9").val(); var mx = $("#max9").val(); var m2 = $("#min10").val(); var mx2 = $("#max10").val(); //*********************************************************************cot结构************************** var chart5 = Highcharts.chart('container5', { chart: { zoomType: 'y', //type: 'column' }, title: { text: SMP + '趋势@抽测日期@结构' }, colors: color, xAxis: { categories: title5 }, yAxis: [{ min: m, max: mx, title: { //text: '水果消费总量' }, stackLabels: { // 堆叠数据标签 enabled: true, style: { fontWeight: 'bold', color: (Highcharts.theme && Highcharts.theme.textColor) || 'gray' } } }, { min: m2, max:mx2, title: { //text: '水果消费总量' }, opposite: true } ], legend: { align: 'center', x: 0, verticalAlign: 'top', //layout: 'vertical', y: 0, floating: false, backgroundColor: (Highcharts.theme && Highcharts.theme.background2) || 'white', borderColor: '#CCC', borderWidth: 1, shadow: false }, tooltip: { formatter: function () { return '<b>' + this.x + '</b><br/>' + this.series.name + ': ' + this.y + '<br/>' '总量: ' + this.point.stackTotal; } }, plotOptions: { column: { stacking: 'normal', dataLabels: { enabled: false, color: (Highcharts.theme && Highcharts.theme.dataLabelsColor) || 'white', style: { // 如果不需要数据标签阴影,可以将 textOutline 设置为 'none' textOutline: '1px 1px black' } } } }, series: data5 }); //*********************************************************************smp结构 } function smp_lop1() { var m = $("#min7").val(); var mx = $("#max7").val(); var m2 = $("#min8").val(); var mx2 = $("#max8").val(); //*********************************************************************smp——总计************************** var chart4 = Highcharts.chart('container4', { chart: { zoomType: 'y', }, title: { text: Text// 'COW_LOP1_AVG趋势@抽测日期@结构' }, xAxis: { categories: title4 }, yAxis: [{ min: m, max: mx, title: { }, stackLabels: { // 堆叠数据标签 enabled: true, style: { fontWeight: 'bold', color: (Highcharts.theme && Highcharts.theme.textColor) || 'gray' } } }, { min: m2, max: mx2, title: { }, opposite: true } ], legend: { align: 'center', x: 0, verticalAlign: 'top', //layout: 'vertical', y: 0, floating: false, backgroundColor: (Highcharts.theme && Highcharts.theme.background2) || 'white', borderColor: '#CCC', borderWidth: 1, shadow: false }, tooltip: { formatter: function () { return '<b>' + this.x + '</b><br/>' + this.series.name + ': ' + this.y + '<br/>' } }, plotOptions: { column: { stacking: 'normal', dataLabels: { enabled: false, color: (Highcharts.theme && Highcharts.theme.dataLabelsColor) || 'white', style: { textOutline: '1px 1px black' } } } }, series: data4 }); //*********************************************************************smp--总计 } function smp_lop1_lc() { var m = $("#min5").val(); var mx = $("#max5").val(); var m2 = $("#min6").val(); var mx2 = $("#max6").val(); //*********************************************************************cot_wo************************** var chart3 = Highcharts.chart('container3', { chart: { zoomType: 'y', //type: 'column' }, title: { text: COT + '@全测日期' }, colors: color, xAxis: { categories: title3 }, yAxis: [{ min: m, max: mx, title: { //text: '水果消费总量' }, stackLabels: { // 堆叠数据标签 enabled: true, style: { fontWeight: 'bold', color: (Highcharts.theme && Highcharts.theme.textColor) || 'gray' } } }, { min: m2, max: mx2, title: { //text: '水果消费总量' }, opposite: true } ], legend: { align: 'center', x: 0, verticalAlign: 'top', //layout: 'vertical', y: 0, floating: false, backgroundColor: (Highcharts.theme && Highcharts.theme.background2) || 'white', borderColor: '#CCC', borderWidth: 1, shadow: false }, tooltip: { formatter: function () { return '<b>' + this.x + '</b><br/>' + this.series.name + ': ' + this.y + '<br/>' '总量: ' + this.point.stackTotal; } }, plotOptions: { column: { stacking: 'normal', dataLabels: { enabled: false, color: (Highcharts.theme && Highcharts.theme.dataLabelsColor) || 'white', style: { // 如果不需要数据标签阴影,可以将 textOutline 设置为 'none' textOutline: '1px 1px black' } } } }, series: data3 }); //*********************************************************************cot_wo } function cot_lop1_gz(){ var m = $("#min3").val(); var mx = $("#max3").val(); var m2 = $("#min4").val(); var mx2 = $("#max4").val(); //*********************************************************************cot结构************************** var chart2 = Highcharts.chart('container2', { chart: { zoomType: 'y', //type: 'column' }, title: { text: COT + '趋势@全测日期@结构' }, colors: color, xAxis: { categories: title2 }, yAxis: [{ min: m, max: mx, title: { //text: '水果消费总量' }, stackLabels: { // 堆叠数据标签 enabled: true, style: { fontWeight: 'bold', color: (Highcharts.theme && Highcharts.theme.textColor) || 'gray' } } }, { min: m2, max: mx2, title: { //text: '水果消费总量' }, opposite: true } ], legend: { align: 'center', x: 0, verticalAlign: 'top', //layout: 'vertical', y: 0, floating: false, backgroundColor: (Highcharts.theme && Highcharts.theme.background2) || 'white', borderColor: '#CCC', borderWidth: 1, shadow: false }, tooltip: { formatter: function () { return '<b>' + this.x + '</b><br/>' + this.series.name + ': ' + this.y + '<br/>' '总量: ' + this.point.stackTotal; } }, plotOptions: { column: { stacking: 'normal', dataLabels: { enabled: false, color: (Highcharts.theme && Highcharts.theme.dataLabelsColor) || 'white', style: { // 如果不需要数据标签阴影,可以将 textOutline 设置为 'none' textOutline: '1px 1px black' } } } }, series: data2 }); //*********************************************************************cot结构 } function cot_lop1() { var m = $("#min").val(); var mx = $("#max").val(); var m2 = $("#min2").val(); var mx2 = $("#max2").val(); //*********************************************************************cot_总计************************** var chart1 = Highcharts.chart('container1', { chart: { //type: 'column' zoomType: 'y', }, title: { text: Text2//'COW_LOP1_AVG趋势@抽测日期@结构' }, xAxis: { categories: title1 }, yAxis: [{ min: m, max: mx, title: { }, stackLabels: { // 堆叠数据标签 enabled: true, style: { fontWeight: 'bold', color: (Highcharts.theme && Highcharts.theme.textColor) || 'gray' } } }, { min: m2, max: mx2, title: { }, opposite: true } ], legend: { align: 'center', x: 0, verticalAlign: 'top', //layout: 'vertical', y: 0, floating: false, backgroundColor: (Highcharts.theme && Highcharts.theme.background2) || 'white', borderColor: '#CCC', borderWidth: 1, shadow: false }, tooltip: { formatter: function () { return '<b>' + this.x + '</b><br/>' + this.series.name + ': ' + this.y + '<br/>' } }, plotOptions: { column: { stacking: 'normal', dataLabels: { enabled: false, color: (Highcharts.theme && Highcharts.theme.dataLabelsColor) || 'white', style: { textOutline: '1px 1px black' } } } }, series: data1 }); //*********************************************************************cot_总计************************* } </script> </body> </html>
        using Newtonsoft.Json;
        using Newtonsoft.Json.Converters;
        using System;
        using System.Collections.Generic;
        using System.Configuration;
        using System.Data;
        using System.Data.OracleClient;
        using System.IO;
        using System.Linq;
        using System.Text;
        using System.Web;
        using System.Web.Security;
        using System.Web.UI;
        using System.Web.UI.HtmlControls;
        using System.Web.UI.WebControls;
        using System.Web.UI.WebControls.WebParts;
        using OfficeOpenXml;

        //using NPOI.XSSF.UserModel;
        using System.Threading.Tasks;


        namespace MESRPT
        {
            /// <summary>
            /// Initialize 的摘要说明
            /// </summary>
            public class Initialize : IHttpHandler
            {

                public void ProcessRequest(HttpContext context)
                {

                    try
                    {
                        context.Response.ContentType = "text/plain";
                        context.Request.ContentEncoding = Encoding.GetEncoding("gb2312");

                        if (context.Request["type"] == "I")
                        {
                            string sql_productNo = @"select ord.* from(select distinct substr(CREATELOT,3,6) as productNo from 表 union  select distinct substr(CREATELOT,3,6)  from 表) ord order by productNo";
DataTable dt = GetData(sql_productNo); string[] arrRate = dt.AsEnumerable().Select(d => d.Field<string>("productNo")).ToArray(); string productNo = string.Join(",", arrRate); string sql_epiRun = @"SELECT DISTINCT SUBSTR (epicomponentid, 12, 1) epiRun FROM 表 where epicomponentid is not null UNION SELECT DISTINCT SUBSTR (epicomponentid, 12, 1) FROM 表 where epicomponentid is not null";
dt = GetData(sql_epiRun); arrRate = dt.AsEnumerable().Select(d => d.Field<string>("epiRun")).ToArray(); string epiRun = string.Join(",", arrRate); string sql_wo = @"select distinct SUBSTR (CREATELOT, 2, 1) wo from 表 union select distinct SUBSTR (CREATELOT, 2, 1) from 表 ";
dt = GetData(sql_wo); arrRate = dt.AsEnumerable().Select(d => d.Field<string>("wo")).ToArray(); string Wo = string.Join(",", arrRate); string sql_Struct = @"select distinct RECIPE from 表 union select distinct RECIPE from 表 ";
dt = GetData(sql_Struct); arrRate = dt.AsEnumerable().Select(d => d.Field<string>("RECIPE")).ToArray(); string Struct = string.Join(",", arrRate); string subStruct = "01,02,03,04,05,06"; string Recipe = "J-N,N-N"; string showTime = "COW测试时间,COT测试时间,建档时间"; context.Response.Write(productNo + "&" + epiRun + "&" + Wo + "&" + Struct + "&" + subStruct + "&" + Recipe + "&" + showTime); } else if (context.Request["type"] == "T") { try { string productDevice = stringToin(context.Request["productDevice"]); // string productEpitaxy = stringToin(context.Request["productEpitaxy"]); // string productWork = stringToin(context.Request["productWork"]); // string productStructure = stringToin(context.Request["productStructure"]); // string productSubstructure = stringToin(context.Request["productSubstructure"]); // string productProcess = stringToin(context.Request["productProcess"]); // 备用 string starttime = context.Request["starttime"]; // string endtime = context.Request["endtime"]; //呈现时间 string select = context.Request["select"]; // string SMP = context.Request["SMP"]; //SMP string COT = context.Request["COT"]; //COT #region sql语句2.0 string sql_cot = @" SELECT {6} time1, {7} COUNT (*) 片数, ROUND (AVG (LOP1_AVG), 2) AS COT_LOP1, ROUND (AVG (WLD1_AVG), 2) AS COT_WLD1, ROUND (AVG (VF4_AVG), 2) AS COT_VF4, ROUND (AVG (VF1_AVG), 2) AS COT_VF1, ROUND (AVG (IR1_YIELD), 2) AS COT_IR1_YIELD, ROUND (AVG (IR2_YIELD), 2) AS COT_IR2_YIELD, {8} FROM (SELECT DISTINCT SUBSTR (pro.UPDATETIME, 1, 10) time_test, SUBSTR (wms.EPI_OUTTIME, 1, 10) time_build, substr(comp.CREATELOT,3,6) recipe, b.STRUCTCODE, b.SUBSTRUCTCODE, pro.LOP1_AVG, pro.WLD1_AVG, pro.VF4_AVG, pro.VF1_AVG, pro.IR1_YIELD, pro.IR2_YIELD, sd.SMP_LOP1_AVG, SD.COW_LOP1_AVG_K, pro.HW1_AVG FROM 表 wms,
CHIP_PROBER_RECORD pro, CHIP_SMP_DETAIL sd, (SELECT * FROM (SELECT SMP.*, RANK () OVER (PARTITION BY WIP_COMP_SID, LOADERTYPE ORDER BY SMP_RECORD_SID DESC) AS RANK FROM 表 SMP
WHERE LOADERTYPE = 'COW') WHERE RANK = 1) sr, (SELECT * FROM 表
UNION SELECT * FROM 表) comp,
(SELECT lot, wo, COMPONENTID, STRUCTCODE, SUBSTRUCTCODE FROM 表, 表
WHERE epi.MES_EPI_WO_BOOK.lot = epi.MES_WIP_COMP_CREATE.CREATELOT) b WHERE wms.WAFERID = comp.EPICOMPONENTID AND wms.WAFERID = b.COMPONENTID AND comp.PROBER_RECORD_SID = pro.PROBER_RECORD_SID AND comp.WIP_COMP_SID = sr.WIP_COMP_SID AND sr.HINT_RULE_SID = sd.SMP_DETAIL_SID --and substr(pro.UPDATETIME,1,10)='2019/11/01' {0}{1}{2}{3}{4}{5} ) GROUP BY {7} {6} order by {6}"; string sql_smp = @" SELECT {6} time1, {7} COUNT (*) 片数, ROUND (AVG (COW_LOP1_AVG_K), 2) AS COW_LOP1_AVG_K, ROUND (AVG (COW_LOP1_AVG), 2) AS SMP_LOP1, ROUND (AVG (COW_LOP2_AVG), 2) AS SMP_LOP2, ROUND (AVG (COW_VF1_AVG), 2) SMP_VF1, ROUND (AVG (COW_WLD1_AVG), 2) SMP_WLD1, ROUND (AVG (COW_ESD04_YIELD), 2) MM400, --ROUND (AVG (COW_WLD2_AVG - COW_WLD1_AVG), 4) BS, ROUND (AVG (COW_VF4_AVG), 2) SMP_VF4, ROUND (AVG (COW_HW1_AVG), 2) SMP_HW1, ROUND (AVG (COW_IR1_YIELD), 2) SMP_IR1_YIELD, ROUND (AVG (COW_VZ1_AVG), 2) SMP_VZ1, ROUND (AVG (COW_ESD01_YIELD), 2) ESD01_YIELD, ROUND (AVG (COW_ESD03_YIELD), 2) ESD03_YIELD, ROUND (AVG (droop), 2) AS Droop FROM (SELECT DISTINCT SUBSTR (dm.COW_STARTTIME, 1, 10) time_test , SUBSTR (EPI_OUTTIME, 1, 10) time_build, SUBSTR (dm.lot, 3, 6) recipe, b.STRUCTCODE, b.SUBSTRUCTCODE, dm.COW_LOP1_AVG, dm.COW_LOP2_AVG, dm.COW_LOP1_AVG/dm.COW_LOP2_AVG as droop, dm.COW_LOP1_AVG_K, dm.COW_VF1_AVG, dm.COW_WLD1_AVG, dm.COW_WLD2_AVG, dm.COW_VF4_AVG, dm.COW_HW1_AVG, dm.COW_IR1_YIELD, dm.COW_VZ1_AVG, dm.COW_ESD01_YIELD, dm.COW_ESD03_YIELD, dm.COW_ESD04_YIELD FROM 表 dm,
(SELECT lot, wo, COMPONENTID, STRUCTCODE, SUBSTRUCTCODE FROM 表, 表
WHERE epi.MES_EPI_WO_BOOK.lot = epi.MES_WIP_COMP_CREATE.CREATELOT) b, mes_wms_lot_nonactive wms WHERE dm.epicomponentid = wms.waferid AND dm.COW_STARTTIME IS NOT NULL AND dm.epicomponentid = b.COMPONENTID and dm.COW_LOP2_AVG <>0 and dm.COW_LOP2_AVG is not null {0}{1}{2}{3}{4}{5} ) GROUP BY {7} {6} order by {6} "; #endregion string ti = ""; string sqlTime1 = ""; string sqlTime2 = ""; string sqlProductNo1 = ""; string sqlProductNo2 = ""; string sqlEpiRun = ""; string sqlWo1 = ""; string sqlWo2 = ""; string sqlStr = ""; string sqlSubStr = ""; string sql_7 = ""; string sqlALL_1 = ""; string sqlALL_2 = ""; string sql_CotRows = ""; if (select == "TEST") { ti = "time_test"; sql_CotRows = @"ROUND (AVG (COW_LOP1_AVG_K), 2) AS COW_LOP1_AVG_K, ROUND (AVG (HW1_AVG), 2) COT_HW1, ROUND ( AVG ( ROUND ( CASE WHEN SMP_LOP1_AVG = 0 THEN NULL ELSE LOP1_AVG / SMP_LOP1_AVG END, 4)), 4) AS LOP_K_COT_COW"; sqlTime1 = @"and substr(pro.UPDATETIME,1,10) >='" + starttime + "'" + @" and substr(pro.UPDATETIME,1,10) <='" + endtime + "'"; sqlTime2 = @"and substr(dm.COW_STARTTIME,1,10) >='" + starttime + "'" + @" and substr(dm.COW_STARTTIME,1,10) <='" + endtime + "'"; sqlALL_1 = @"select * from 表 where substr(cot_updatetime,1,10) >='" + starttime + "'" + @" and substr(cot_updatetime,1,10) <='" + endtime + "'";
sqlALL_2 = @"select * from 表 where substr(starttime,1,10) >='" + starttime + "'" + @" and substr(starttime,1,10) <='" + endtime + "'";
} else { ti = "time_build"; sql_CotRows = @"ROUND ( AVG ( ROUND ( CASE WHEN SMP_LOP1_AVG = 0 THEN NULL ELSE LOP1_AVG / SMP_LOP1_AVG END, 4)), 4) AS LOP_K_COT_COW, ROUND (AVG (HW1_AVG), 2) COT_HW1, ROUND (AVG (COW_LOP1_AVG_K), 2) AS COW_LOP1_AVG_K"; sqlTime1 = @"and substr(wms.EPI_OUTTIME,1,10) >='" + starttime + "'" + @" and substr(wms.EPI_OUTTIME,1,10) <='" + endtime + "'"; sqlTime2 = @"and substr(EPI_OUTTIME,1,10) >='" + starttime + "'" + @" and substr(EPI_OUTTIME,1,10)<='" + endtime + "'"; sqlALL_1 = @"select * from 表 where substr(epi_outtime,1,10)>='" + starttime + "'" + @" and substr(epi_outtime,1,10) <='" + endtime + "'";
sqlALL_2 = @"select * from 表 where substr(epi_outtime,1,10) >='" + starttime + "'" + @" and substr(epi_outtime,1,10) <='" + endtime + "'";
} if (!productDevice.Contains("ALL")) { sqlProductNo1 = @"and substr(comp.CREATELOT,3,6) in (" + productDevice + ")"; sqlProductNo2 = @"and substr(dm.lot,3,6) in (" + productDevice + ")"; } if (!productEpitaxy.Contains("ALL")) { sqlEpiRun = @"and SUBSTR (b.COMPONENTID, 12, 1) in (" + productEpitaxy + ")"; //外延RUN } if (!productWork.Contains("ALL")) { //sqlWo = @"and substr(b.WO,4,1) in (" + productWork + ")"; //工单 sqlWo1 = @"AND SUBSTR (comp.CREATELOT, 2, 1) in (" + productWork + ")"; sqlWo2 = @"AND SUBSTR (dm.LOT, 2, 1) in (" + productWork + ")"; } if (!productStructure.Contains("ALL")) { sqlStr = @"and b.STRUCTCODE in (" + productStructure + ")"; //STRUCTCODE } if (!productSubstructure.Contains("ALL")) { sqlSubStr = @"and b.SUBSTRUCTCODE in (" + productSubstructure + ")"; //SUBSTRUCTCODE } //第一种格式--表格 string SQL_1 = string.Format(sql_cot, sqlTime1, sqlProductNo1, sqlEpiRun, sqlWo1, sqlStr, sqlSubStr, ti, sql_7, sql_CotRows); string SQL_2 = string.Format(sql_smp, sqlTime2, sqlProductNo2, sqlEpiRun, sqlWo2, sqlStr, sqlSubStr, ti, sql_7); DataTable dt1 = GetData(SQL_1);//COT DataTable dt2 = GetData(SQL_2);//SMP OutExcel(@"OUTEXCELCOT数据导出.xlsx", dt1); OutExcel(@"OUTEXCELSMP数据导出.xlsx", dt2); //第二种格式--图表 结构码-子结构码 sql_7 = @"STRUCTCODE,SUBSTRUCTCODE,"; string SQL_3 = string.Format(sql_cot, sqlTime1, sqlProductNo1, sqlEpiRun, sqlWo1, sqlStr, sqlSubStr, ti, sql_7, sql_CotRows); string SQL_4 = string.Format(sql_smp, sqlTime2, sqlProductNo2, sqlEpiRun, sqlWo2, sqlStr, sqlSubStr, ti, sql_7); string t_seq = ""; DateTime s_dt = Convert.ToDateTime(starttime); DateTime e_dt = Convert.ToDateTime(endtime); for (DateTime dt = s_dt; dt <= e_dt; dt=dt.AddDays(1)) { t_seq += "'" + DateTime.Parse(dt.ToShortDateString()).ToString("yyyy/MM/dd") + "' as "" + DateTime.Parse(dt.ToShortDateString()).ToString("yyyy/MM/dd") +"","; } t_seq = t_seq.Substring(0, t_seq.Length - 1); //抓列抓行 string sql_add_smp = @"select * from ( select time1,structcode||'-'||substructcode ss, case when category='片数' then '片数' when category='COW_LOP1_AVG_K' then 'COW_LOP1_AVG_K' when category='SMP_LOP1' then 'SMP_LOP1' when category='SMP_LOP2' then 'SMP_LOP2' when category='SMP_VF1' then 'SMP_VF1' when category='SMP_WLD1' then 'SMP_WLD1' --when category='BS' then 'BS' when category='MM400' then 'MM400' when category='SMP_VF4' then 'SMP_VF4' when category='SMP_HW1' then 'SMP_HW1' when category='SMP_IR1_YIELD' then 'SMP_IR1_YIELD' when category='SMP_VZ1' then 'SMP_VZ1' when category='ESD01_YIELD' then 'ESD01_YIELD' --when category='ESD03_YIELD' then 'ESD03-YIELD' when category='DROOP' then 'DROOP' end category ,value as aa from (" + SQL_4+ @") unpivot(value for category in ( 片数, COW_LOP1_AVG_K, SMP_LOP1, SMP_LOP2, SMP_VF1 , SMP_WLD1, MM400, --BS, SMP_VF4, SMP_HW1, SMP_IR1_YIELD, SMP_VZ1, ESD01_YIELD, --ESD03_YIELD, Droop )) ) pivot (max(aa) for time1 in ( " + t_seq+@" )) order by ss ,decode(category,'片数',1,'COW_LOP1_AVG_K',2,'SMP_LOP1',3,'SMP_LOP2',4,'SMP_VF1',5,'SMP_WLD1',6,'MM400',7,'SMP_VF4',8,'SMP_HW1',9,'SMP_IR1_YIELD',10,'SMP_VZ1',11,'ESD01_YIELD',12,'Droop',13) asc"; string sql_add_cot = @" SELECT * FROM (SELECT time1, structcode || '-' || substructcode ss, CASE WHEN category = '片数' THEN '片数' WHEN category = 'COT_LOP1' THEN 'COT_LOP1' WHEN category = 'COT_WLD1' THEN 'COT_WLD1' WHEN category = 'COT_VF4' THEN 'COT_VF4' WHEN category = 'COT_VF1' THEN 'COT_VF1' WHEN category = 'COT_IR1_YIELD' THEN 'COT_IR1_YIELD' WHEN category = 'COT_IR2_YIELD' THEN 'COT_IR2_YIELD' WHEN category = 'LOP_K_COT_COW' THEN 'LOP_K_COT_COW' WHEN category = 'COT_HW1' THEN 'COT_HW1' END category, VALUE AS aa FROM ( "+SQL_3+ @")UNPIVOT (VALUE FOR category IN (片数, COT_LOP1, COT_WLD1, COT_VF4, COT_VF1, COT_IR1_YIELD, COT_IR2_YIELD, LOP_K_COT_COW, COT_HW1))) PIVOT (MAX (aa) FOR time1 IN (" + t_seq + @" )) order by ss ,decode(category,'片数',1,'COT_LOP1',2,'COT_WLD1',3,'COT_VF4',4,'COT_VF1',5,'COT_IR1_YIELD',6,'COT_IR2_YIELD',7,'LOP_K_COT_COW',8,'COT_HW1',9) asc"; DataTable dt7 = GetData(sql_add_smp);//SMP DataTable dt8 = GetData(sql_add_cot);//COT OutExcel(@"OUTEXCELT_add_smp数据导出.xlsx", dt7); OutExcel(@"OUTEXCELT_add_cot数据导出.xlsx", dt8); DataTable dt3 = GetData(SQL_3);//COT DataTable dt4 = GetData(SQL_4);//SMP //第三种格式--图表 产品型号 sql_7 = @"recipe,"; string SQL_5 = string.Format(sql_cot, sqlTime1, sqlProductNo1, sqlEpiRun, sqlWo1, sqlStr, sqlSubStr, ti, sql_7, sql_CotRows); string SQL_6 = string.Format(sql_smp, sqlTime2, sqlProductNo2, sqlEpiRun, sqlWo2, sqlStr, sqlSubStr, ti, sql_7); DataTable dt5 = GetData(SQL_5);//COT DataTable dt6 = GetData(SQL_6);//SMP //aaaaaaaaaaaaaaaaaaaaaaaaaaaaaaaaaaaaaaaaaaaaaaaaaaaaa 都是將從數据庫 查出來的DataTable 表轉換成前端需要的格式
context.Response.Write(ToArry2(dt1) + "#" + ToArry2(dt2) + "#" + DataToChart(dt1, COT) + "#" + DataToChart(dt2, SMP) + "#" + DataToChart2(dt3, COT) + "#" + DataToChart2(dt4, SMP) + "#" + DataToChart3(dt5, COT) + "#" + DataToChart3(dt6, SMP) + "#" + ToArry(dt7) + "#" + ToArry(dt8) ); } catch (Exception ex) { context.Response.Write("Error:" + ex); } } else if (context.Request["type"] == "D") { string starttime = context.Request["starttime"]; // string endtime = context.Request["endtime"]; //呈现时间 string select = context.Request["select"]; // string sqlALL_1 = ""; string sqlALL_2 = ""; if (select == "TEST") { sqlALL_1 = @"select * from 表 where substr(cot_updatetime,1,10) >='" + starttime + "'" + @" and substr(cot_updatetime,1,10) <='" + endtime + "'";
sqlALL_2 = @"select * from 表 where substr(starttime,1,10) >='" + starttime + "'" + @" and substr(starttime,1,10) <='" + endtime + "'";
} else { sqlALL_1 = @"select * from 表 where substr(epi_outtime,1,10)>='" + starttime + "'" + @" and substr(epi_outtime,1,10) <='" + endtime + "'";
sqlALL_2 = @"select * from 表 where substr(epi_outtime,1,10) >='" + starttime + "'" + @" and substr(epi_outtime,1,10) <='" + endtime + "'";
} DataTable dt1 = GetData(sqlALL_1);//COT DataTable dt2 = GetData(sqlALL_2);//SMP OutExcel(@"OUTEXCELCOT原始数据导出.xlsx", dt1); OutExcel(@"OUTEXCELSMP原始数据导出.xlsx", dt2); context.Response.Write("OK"); } } catch (Exception ex) { context.Response.Write("" + ex); } } /// <summary> /// 生成JSON字符串 /// </summary> /// <param name="obj">生成json的对象</param> /// <param name="formatjson">是否格式化</param> /// <returns></returns> public static string ToJson(object obj, bool formatjson) { StringBuilder sb = new StringBuilder(); StringWriter sw = new StringWriter(sb); IsoDateTimeConverter idtc = new IsoDateTimeConverter(); idtc.DateTimeFormat = "yyyy-MM-dd HH:mm:ss"; JsonSerializer serializer = new JsonSerializer(); serializer.Converters.Add(idtc); JsonWriter jw = new JsonTextWriter(sw); if (formatjson) { jw.Formatting = Formatting.Indented; } serializer.Serialize(jw, obj); return sb.ToString(); } public bool IsReusable { get { return false; } } public string stringToin(string str) { string [] list = str.Split(','); for (int i = 0; i < list.Length; i++) { list[i]="'"+ list[i]+"'"; } return string.Join(",", list); } private DataTable GetData(string strSql)//和Java一樣 JDBC { string strConn = ConfigurationManager.ConnectionStrings["Connection"].ConnectionString; OracleConnection SqlConn = new OracleConnection(strConn); OracleDataAdapter SqlCmd = new OracleDataAdapter(strSql, SqlConn); DataSet SqlDS = new DataSet(); SqlCmd.Fill(SqlDS); SqlConn.Close(); return SqlDS.Tables[0]; } public static string ToArry2(DataTable dt) //转为表格格式字符串 { string data = ""; string title = "'Pram',"; if (dt.Rows.Count != 0) { for (int item = 0; item < dt.Rows.Count; item++) { title += "'" + dt.Rows[item][0].ToString() + "',"; } for (int i = 1; i < dt.Columns.Count; i++) { data += "['" + dt.Columns[i].ColumnName.ToString() + "',"; for (int item = 0; item < dt.Rows.Count; item++) { data += "'" + dt.Rows[item][i].ToString() + "',"; } data = data.Substring(0, data.Length - 1); data += "],"; } data = data.Substring(0, data.Length - 1); title = title.Substring(0, title.Length - 1); return "[" + data + "]" + "&" + "[" + title + "]"; } else { return "Error"; } } public static string ToArry(DataTable dt) //转为表格格式字符串 { string data = ""; string title = "' RECIPE ',"; if (dt.Rows.Count != 0) { for (int i = 1; i < dt.Columns.Count; i++) { title += "'" + dt.Columns[i].ColumnName.ToString() + "',"; } for (int item = 0; item < dt.Rows.Count; item++) { data += "["; for (int i = 0; i < dt.Columns.Count; i++) { data += "'" + dt.Rows[item][i].ToString() + "',"; } data = data.Substring(0, data.Length - 1); data += "],"; } data = data.Substring(0, data.Length - 1); title = title.Substring(0, title.Length - 1); return "[" + data + "]" + "&" + "[" + title + "]"; } else { return "Error"; } } private string DataToChart(DataTable dt,string pram)//一個表的 { string title = "'" + string.Join("','", dt.AsEnumerable().Select(c => c.Field<string>("time1")).ToList()) + "'"; string data = string.Join(",", dt.AsEnumerable().Select(c => c.Field<decimal>("片数")).ToList()); //string line = string.Join(",", dt.AsEnumerable().Select(c => c.Field<decimal>("LOP1_AVG")).ToList()); string line = string.Join(",", dt.AsEnumerable().Select(c => c.Field<decimal>(pram)).ToList()); data = "{type: 'column',yAxis:1,name: '"+pram+"-count'" + ",data:[" + data + "]}, " + "{type: 'spline',yAxis:0,name: '"+pram+"-avg'" + ",data:[" + line + "]}"; return "[" + data + "]" + "&" + "[" + title + "]" ; } private string DataToChart2(DataTable dt, string pram) { string data = ""; string X = "'"+string.Join("','",dt.AsEnumerable().Select(c => c.Field<string>("time1")).ToList().Distinct())+"'"; List<string> timeList = dt.AsEnumerable().Select(c => c.Field<string>("time1")).ToList().Distinct().ToList(); List<string> structList = dt.AsEnumerable().Select(c => c.Field<string>("STRUCTCODE")).ToList().Distinct().ToList(); List<string> subStructList = dt.AsEnumerable().Select(c => c.Field<string>("SUBSTRUCTCODE")).ToList().Distinct().ToList(); foreach (var a in structList) { foreach (var b in subStructList) { DataRow[] drs2 = dt.Select("STRUCTCODE = '" + a + "' and SUBSTRUCTCODE='"+b+"'"); DataTable dtNew = dt.Clone(); for (int i = 0; i < drs2.Length; i++) { dtNew.ImportRow(drs2[i]); } string[] te = new string[timeList.Count]; string[] li = new string[timeList.Count]; for (int i = 0; i < te.Length; i++) { te[i] = "0"; li[i] = "0"; } foreach (DataRow c in dtNew.Rows) { te[timeList.IndexOf(c["time1"].ToString())] = c["片数"].ToString(); //li[timeList.IndexOf(c["time1"].ToString())] = c["LOP1_AVG"].ToString(); li[timeList.IndexOf(c["time1"].ToString())] = c[pram].ToString(); } string str = string.Join(",", te); string str2 = string.Join(",", li); data += "{type: 'column',yAxis:1,name: '" + a + "-" + b + "',data:[" + str + "]}, "; data += "{type: 'spline',yAxis:0,name: '" + a + "-" + b + "',data:[" + str2 + "]}, "; } } data = data.Substring(0, data.Length - 1); return "["+data+"]&["+X+"]"; } private string DataToChart3(DataTable dt, string pram)//轉換格式 可能會看不懂 { string data = ""; string X = "'" + string.Join("','", dt.AsEnumerable().Select(c => c.Field<string>("time1")).ToList().Distinct()) + "'"; List<string> timeList = dt.AsEnumerable().Select(c => c.Field<string>("time1")).ToList().Distinct().ToList(); List<string> recList = dt.AsEnumerable().Select(c => c.Field<string>("recipe")).ToList().Distinct().ToList(); foreach (var a in recList) { DataRow[] drs2 = dt.Select("recipe = '" + a + "'"); DataTable dtNew = dt.Clone(); for (int i = 0; i < drs2.Length; i++) { dtNew.ImportRow(drs2[i]); } string[] te = new string[timeList.Count]; string[] li = new string[timeList.Count]; for (int i = 0; i < te.Length; i++) { te[i] = "0"; li[i] = "0"; } foreach (DataRow c in dtNew.Rows) { te[timeList.IndexOf(c["time1"].ToString())] = c["片数"].ToString(); // li[timeList.IndexOf(c["time1"].ToString())] = c["LOP1_AVG"].ToString(); li[timeList.IndexOf(c["time1"].ToString())] = c[pram].ToString(); } string str = string.Join(",", te); string str2 = string.Join(",", li); data += "{type: 'column',yAxis:1,name: '" + a + "',data:[" + str + "]}, "; data += "{type: 'spline',yAxis:0,name: '" + a + "',data:[" + str2 + "]}, "; } data = data.Substring(0, data.Length - 1); return "[" + data + "]&[" + X + "]";//主要轉換成這種格式 } public static void OutExcel(String filename, DataTable dt1)//服務器上到出excel報表方法 { var source = dt1; //var source2 = dt2; //filename = @"D:fileNCMESRPTMESRPTMESRPT" + filename; filename = @"D:MESRPT" + filename; var fi = new FileInfo(filename); if (File.Exists(filename)) { File.Delete(filename); } using (ExcelPackage pck = new ExcelPackage(fi)) { ExcelWorksheet wsData = pck.Workbook.Worksheets.Add("Data"); wsData.Cells["A1"].LoadFromDataTable(source, true); wsData.Column(1).AutoFit(); pck.Save(); } } } }