1.安装和配置prometheus
tar zxvf prometheus-2.3.0.linux-amd64.tar.gz -C /usr/local/
ln -sv /usr/local/prometheus-2.3.0.linux-amd64/ /usr/local/prometheus
cd /usr/local/prometheus
[root@do1cloud03 prometheus]# cat prometheus.yml |egrep -v '#'
global:

alerting:
  alertmanagers:
  - static_configs:
    - targets:

rule_files:

scrape_configs:
  - job_name: linux
    static_configs:
      - targets: ['192.168.1.46:9100']
        labels:
          instance: db1
  - job_name: node45
    static_configs:
      - targets: ['192.168.1.45:9100']
        labels:
          instance: node45

/data/prometheus-2.3.0.linux-amd64/prometheus --config.file=/data/prometheus-2.3.0.linux-amd64/prometheus.yml --web.listen-address=10.253.124.27:9090
2.安装node-exporter
tar -zxvf node_exporter-0.16.0.linux-arm64.tar.gz
mv node_exporter-0.16.0.linux-amd64 /usr/local/node_exporter
./node_exporter --web.listen-address="10.253.124.7:50002" &
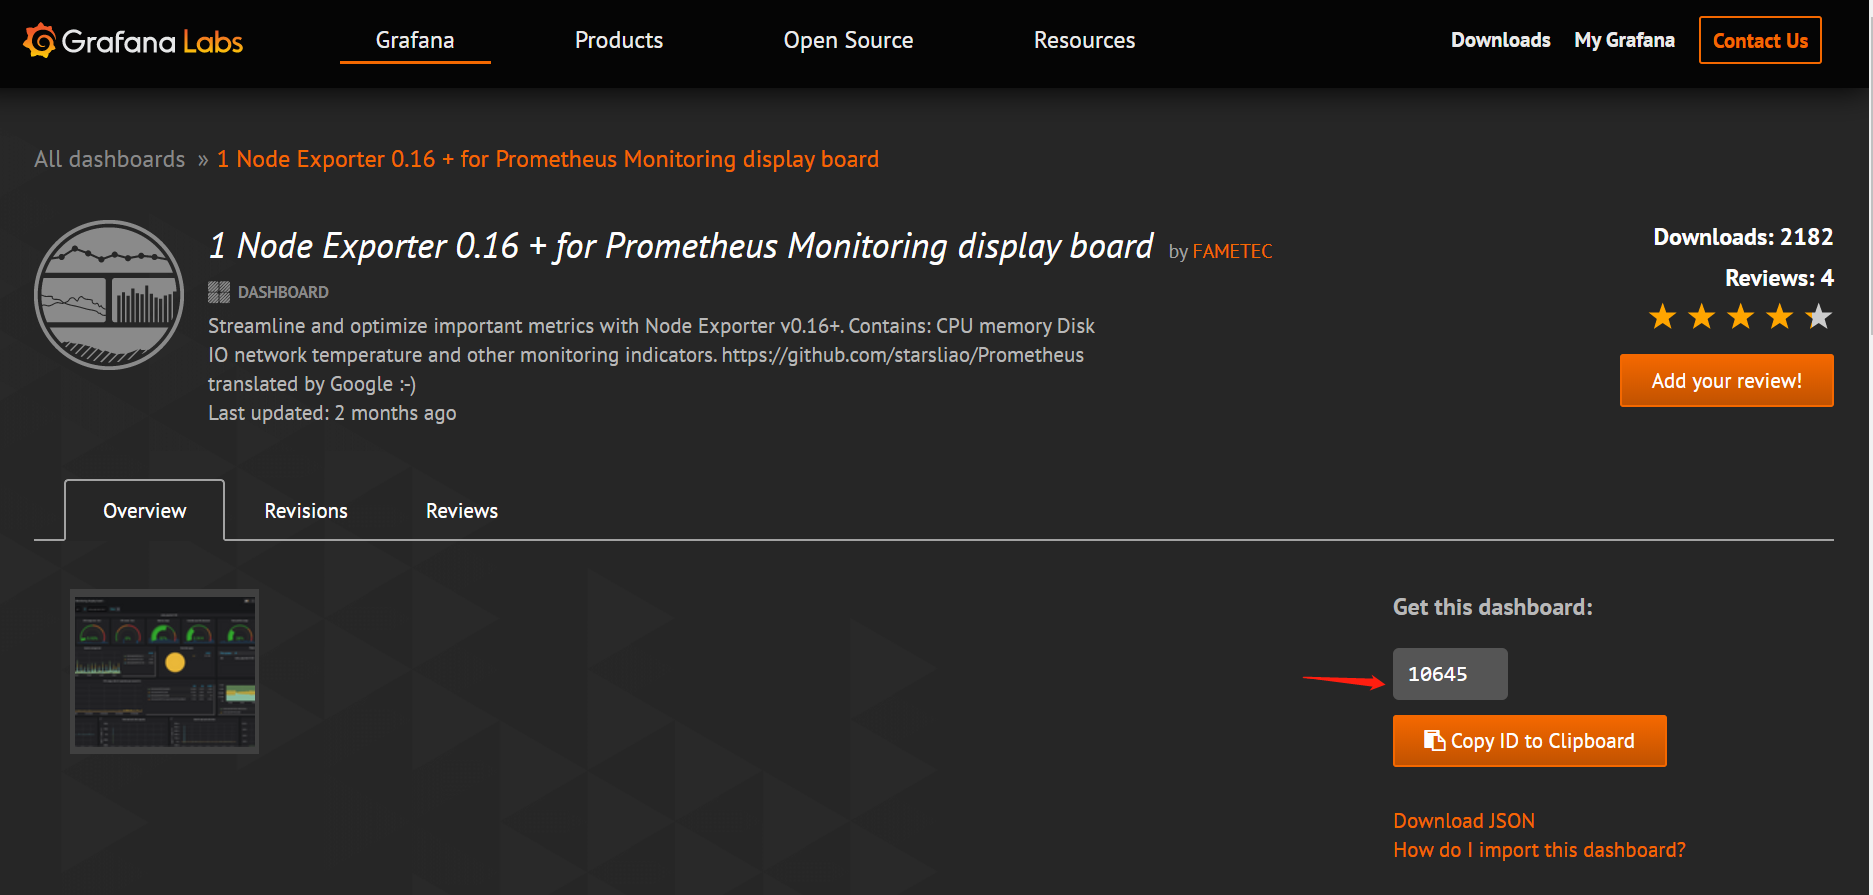
3.去官网下载node-exporter-1.6.0对应的dashboard
https://grafana.com/grafana/dashboards
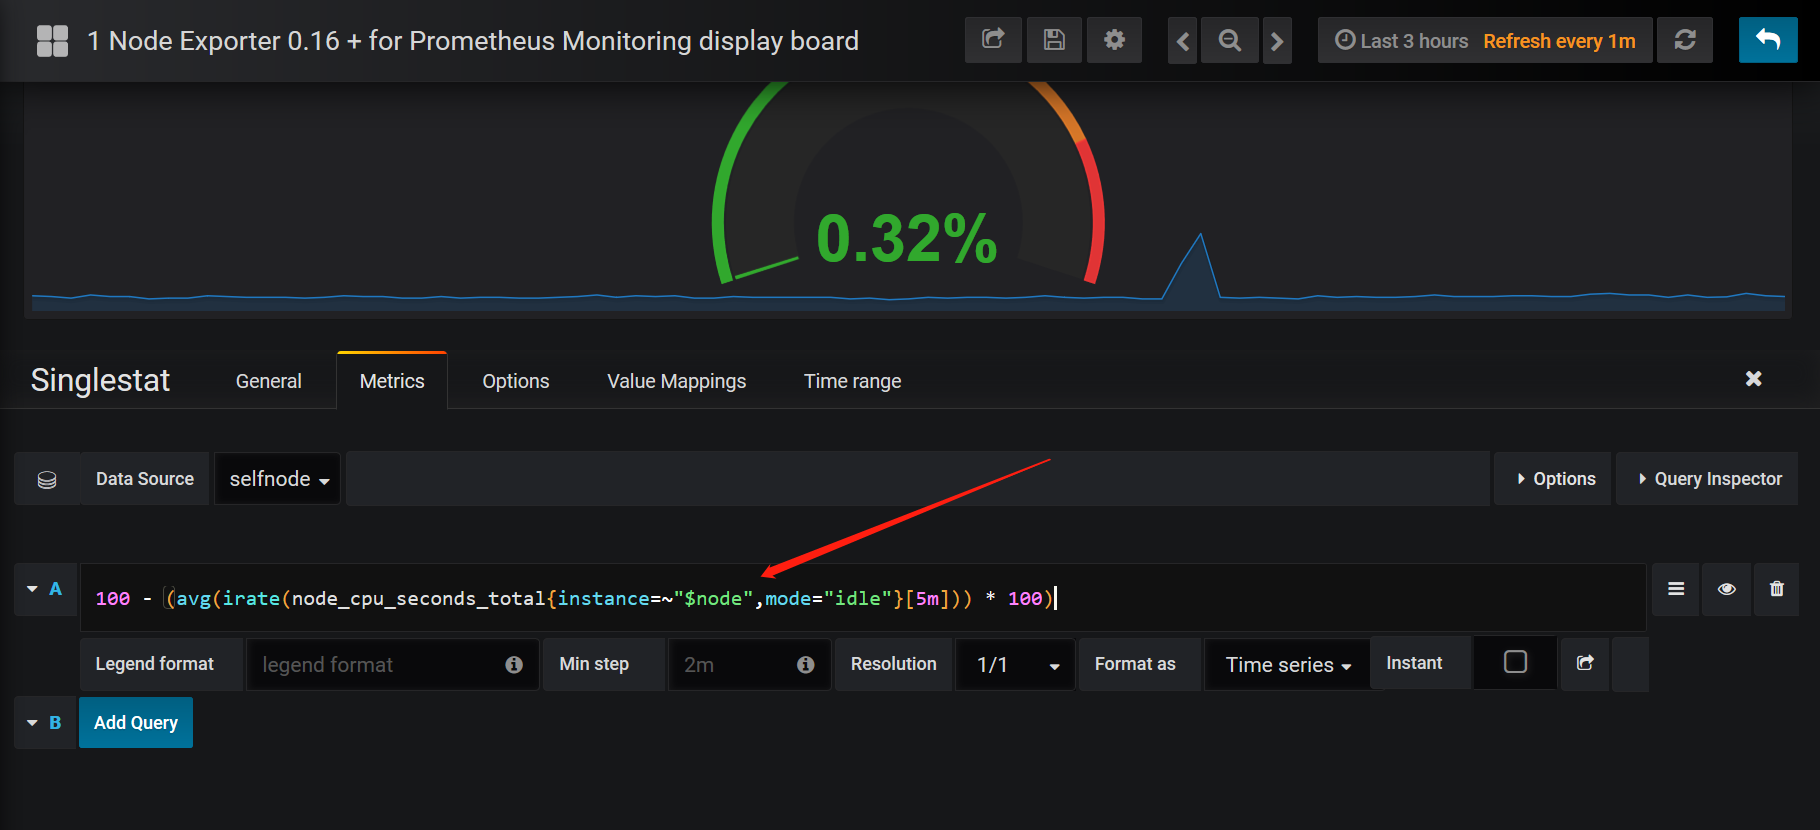
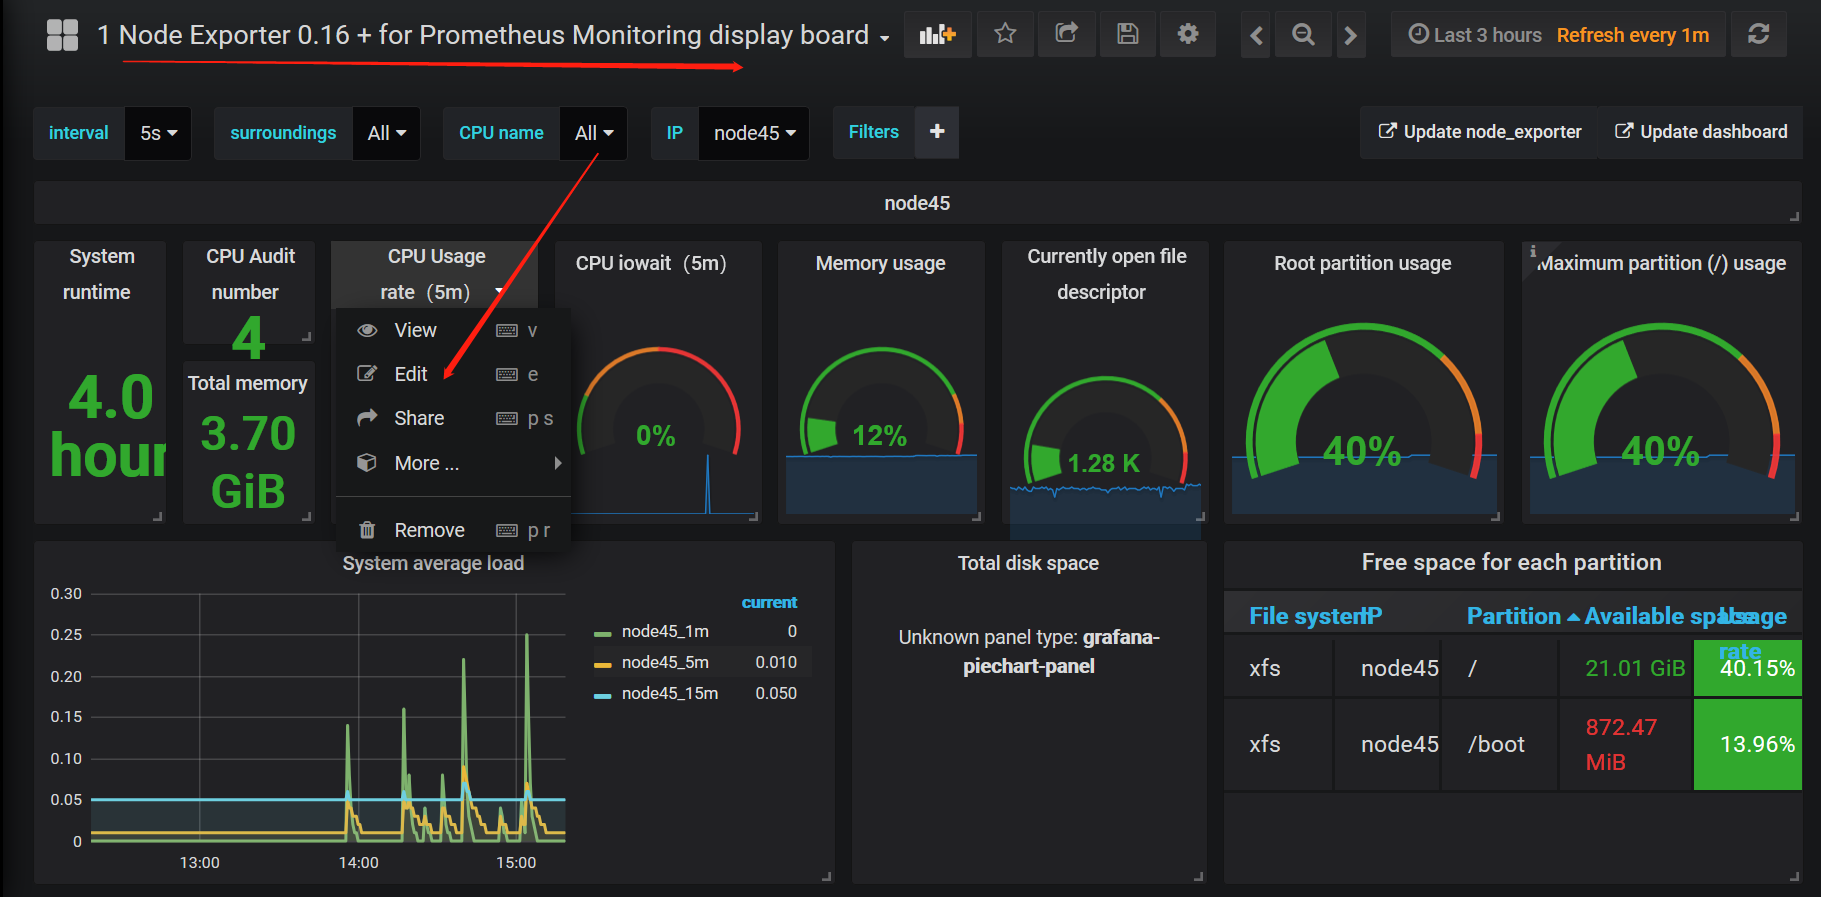
4.去dashboard设置
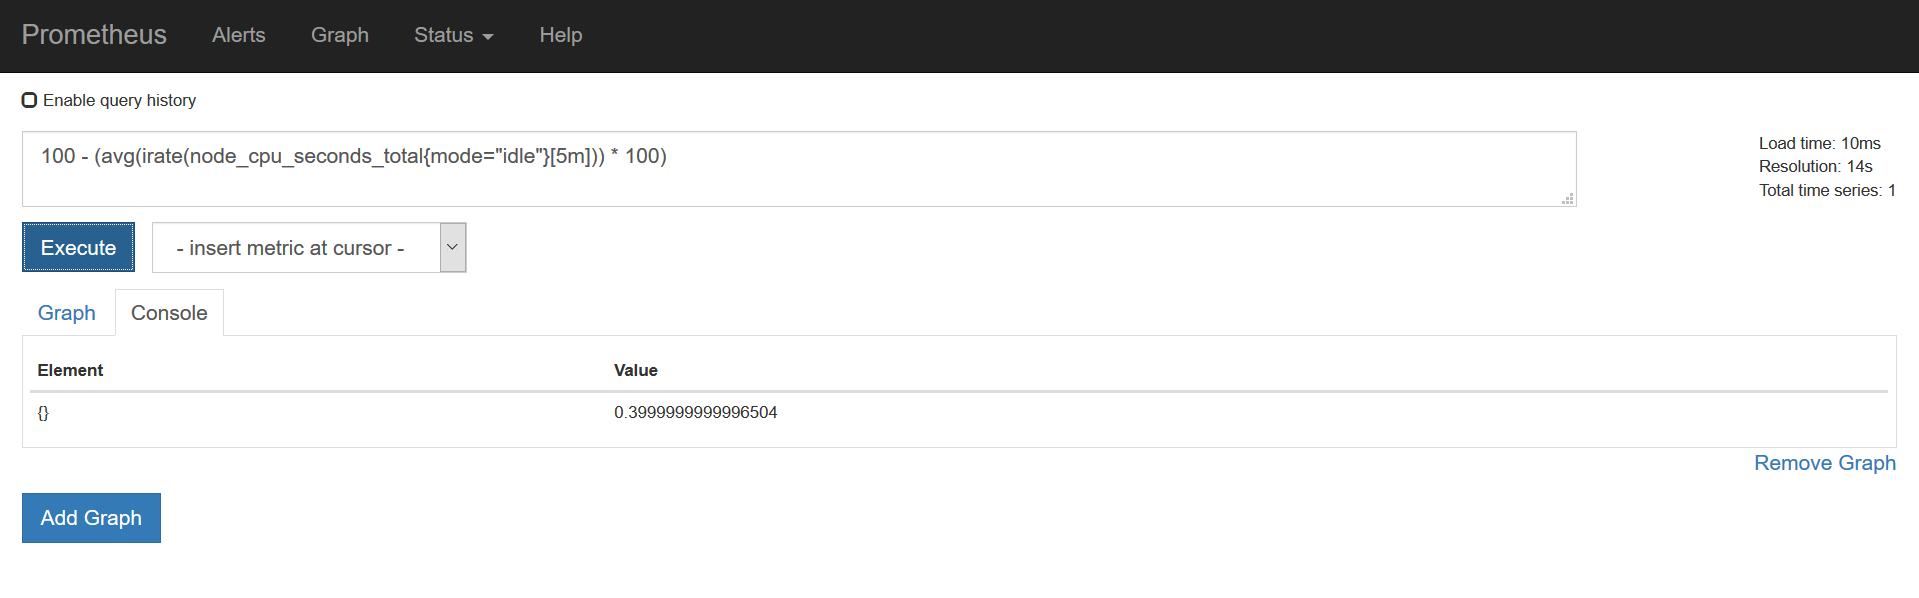
5.排错思路:在这里获取到prom sql,去Prometheus的graph查询
对于已经存储的历史数据,Prometheus提供了PromQL语言进行查询,并自带了一个简易的UI界面,可以在界面上进行查询、绘图、查看配置、告警等等。
需要学习简单的PromQL语言,在grafana里面根据业务自定义dashboard