Well, once again this is a pretty basic post of information readily available on the Internet. It took me seemingly forever to piece it all together, so I am blogging it to cement it in my mind and hopefully help someone else down the road. This week I have conquered the formatting of my X and Y axis labels for my charts. As usual, the hoops are a little bulky to jump through when you just want to add a very simple bit of formatting, but the flexibility is awesome.
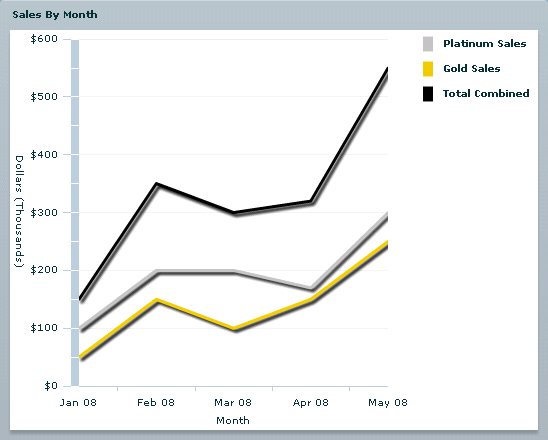
My Example chart is a simple line chart showing the trending of monthly sales. The Y axis shows money so it needs to formatted as dollars. Also it is in the thousands of dollars, so to save screen real estate I want to show $600,000 and $600 and then label the axis "Dollars (Thousands)". I plan on showing up to 12 months of data at a time, so I want the X axis ti show an abbreviated form of the month and year: "Jan 2008", "Feb 2008", etc.
Now first of all, it was very tempting to apply some of this formatting in SQL server or ColdFusion where I was more familiar with formatting (The actual implementation of this chart uses a CF webservice for data). I don't think that is the correct approach though. It is the display layer's job to format data, the data and business layer should just serve up the unadulterated goods. Furthermore, formatting tends to lose data (such as in a date) or change the data type (such as adding $ or % to a number).
So to dig in, We'll start with the X-axis. The LineChart will automatically choose defaults for most everything, but we have to at least specify a CategoryAxis with a categoryField. I am using this CategoryAxis as my horizontalAxis. The title attribute of my CategoryAxis is what is displayed under the dates. To control how the dates are output, I want so specify a labelFunction.
2 <mx:CategoryAxis tegoryField="month" title="Month" labelFunction="axisDateLabel" />
3 </mx:horizontalAxis>
If we browse over to the LiveDocs page for CategoryAxis we will see that the labelFunction needs to have the following signature:
2 { ... }
The previousCategoryValue object is interesting. I'm guessing one could use it to output the incremental change between that category and the previous.
So, to format my dates for output I want an instance of the DateFormatter class. For you ColdFusion people, think dateformat() function but reusable and a bit more OO.
The formatString is basically a mask that controls how the date is output. MMM gives me the three letter month abbr and YY gives me the two digit year. Now that I have created a custom version of the DateFormatter class, I can reference it by id and call its format() method like so in my label function:
2 {
3 return dateFormatterAbbr.format(categoryValue);
4 }
Well, with that out of the day, let's move on to the vertical axis. This attribute of my LineChart will be handed a LinearAxis object which also contains a title attribute as well as a labelFunction:
2 <mx:LinearAxis tle="Dollars (Thousands)" labelFunction="vAxisCurrencyLabelNoCentsThousands" />
3 </mx:verticalAxis>
If we browse over to the LiveDocs page for NumericAxis we will see that the labelFunction needs to have the following signature (LinearAxis inherits the labelFunction property from NumericAxis which it extends):
2 { ... }
Much like my post on formatting a DataGrid for currency we want an instance of the CurrencyFormatter class to help us out.
Our label function calls the format() method of our CurrencyFormatter class, but not before dividing the value by 1000 since we want our Y axis to show thousands of dollars.
2 {
3 return currencyFormatterNoCents.format(labelValue/1000);
4 }
My function names may seem kind of long, but I was trying to keep them reusable for other graphs in my app, so I named them generically and descriptively.
Here is the finished product:
2 <mx:Application mlns:mx="http://www.adobe.com/2006/mxml" layout="absolute" xmlns:local="*">
3
4 <mx:Script>
5 <![CDATA[
6
7 import mx.collections.ArrayList;
8 import mx.charts.chartClasses.IAxis;
9
10 private var monthly_sales_data:ArrayList = new ArrayList([
11 {month: "1/1/2008", platinum_sales: 100000, gold_sales: 50000, total_sales: 150000},
12 {month: "2/1/2008", platinum_sales: 200000, gold_sales: 150000, total_sales: 350000},
13 {month: "3/1/2008", platinum_sales: 200000, gold_sales: 100000, total_sales: 300000},
14 {month: "4/1/2008", platinum_sales: 170000, gold_sales: 150000, total_sales: 320000},
15 {month: "5/1/2008", platinum_sales: 300000, gold_sales: 250000, total_sales: 550000}]);
16
17 private function axisDateLabel(categoryValue:Object, previousCategoryValue:Object, axis:CategoryAxis, categoryItem:Object):String
18 {
19 return dateFormatterAbbr.format(categoryValue);
20 }
21
22 private function vAxisCurrencyLabelNoCentsThousands(labelValue:Number, previousValue:Object, axis:IAxis):String
23 {
24 return currencyFormatterNoCents.format(labelValue/1000);
25 }
26
27 ]]>
28 </mx:Script>
29
30 <mx:Stroke ="platinum_stroke" color="#C0C0C0" weight="3"/>
31 <mx:Stroke ="total_stroke" color="#000000" weight="3"/>
32 <mx:Stroke ="gold_stroke" color="#EEC900" weight="3"/>
33
34 <mx:CurrencyFormatter ="currencyFormatterWithCents" precision="2" rounding="nearest" />
35 <mx:CurrencyFormatter ="currencyFormatterNoCents" precision="0" rounding="nearest" />
36 <mx:DateFormatter ="dateFormatterAbbr" formatString="MMM YY" />
37
38 <mx:Panel itle="Sales By Month">
39 <mx:HBox
40 <mx:LineChart "sales_by_month" dataProvider="{monthly_sales_data}">
41 <mx:horizontaAxis>
42 <mx:CategoryAxis categoryField="month" title="Month" labelFunction="axisDatLabel" />
43 </mx:horizontaAxis>
44 <mx:verticaAxis>
45 <mx:LinearAxis title="Dollars (Thousands)" labelFunction="vAxisCurrencyLabelNoCentsThousads" />
46 </mx:vertcalAxis>
47 <mx:sries>
48 <mx:LineSeries xField="month" yField="platinum_sales" displayName="Platinum Sales" lineStroke="{platinum_sroke}" />
49 <mx:LineSeries xField="month" yField="gold_sales" displayName="Gold Sales" lineStroke="{gold_sroke}" />
50 <mx:LineSeries d="month" yField="total_sales" displayName="Total Combined"lineStroke="{total_stroke}" />
51 </mx:sries>
52 </mx:LineChar>
53 <mx:Legend dataProvider="{sales_by_mont}"/>
54 </mx:HBox
55 </mx:Panel>
56 </mx:Application>