• vue引入echarts


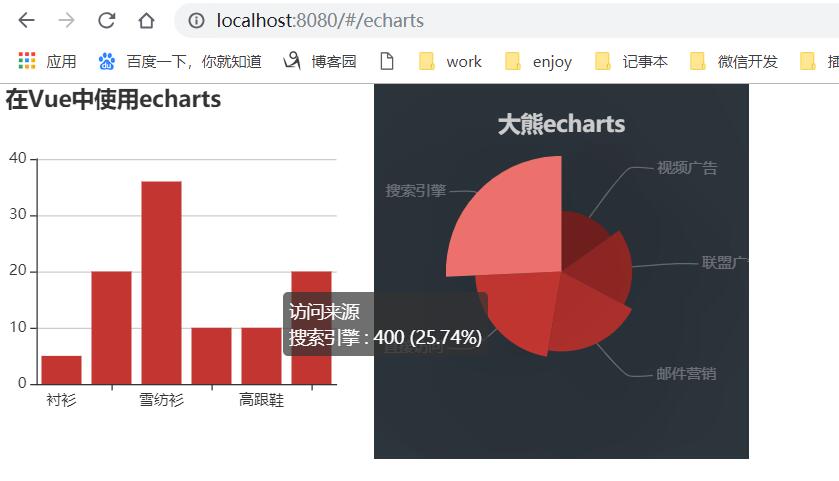
    效果图:


    1.安装Echarts :    

    npm install echarts -S

    或者使用国内的淘宝镜像:

    安装:

    npm install -g cnpm --registry=https://registry.npm.taobao.org

    使用:

    cnpm install echarts -S

    2. 在main.js中引入Echarts:

    // 引入echarts
    import echarts from 'echarts'
    Vue.prototype.$echarts = echarts 

    3.创建容器和js部分

    //我这边做了两个列子
    <
    template> <div id="echarts" style="display:flex"> <div id="myChart" :style="{ '300px', height: '300px'}"></div> <div id="myChart1" :style="{ '300px', height: '300px'}"></div> </div> </template>
    <script>
    export default {
        name: 'Echarts',
        data () {},
        mounted(){
            this.drawLine()
            this.drawLine1()
        },
        methods: {
            drawLine(){
                // 基于准备好的dom,初始化echarts实例
                let myChart = this.$echarts.init(document.getElementById('myChart'))
                // 绘制图表
                myChart.setOption({
                    title: { text: '在Vue中使用echarts' },
                    tooltip: {},
                    xAxis: {
                        data: ["衬衫","羊毛衫","雪纺衫","裤子","高跟鞋","袜子"]
                    },
                    yAxis: {},
                    series: [{
                        name: '销量',
                        type: 'bar',
                        data: [5, 20, 36, 10, 10, 20]
                    }]
                });
            },
            drawLine1(){
                // 基于准备好的dom,初始化echarts实例
                let myChart = this.$echarts.init(document.getElementById('myChart1'))
                // 绘制图表
                myChart.setOption({
                    backgroundColor: '#2c343c',
                    title: {
                        text: '大熊echarts',
                        left: 'center',
                        top: 20,
                        textStyle: {
                            color: '#ccc'
                        }
                    },
    
                    tooltip : {
                        trigger: 'item',
                        formatter: "{a} <br/>{b} : {c} ({d}%)"
                    },
    
                    visualMap: {
                        show: false,
                        min: 80,
                        max: 600,
                        inRange: {
                            colorLightness: [0, 1]
                        }
                    },
                    series : [
                        {
                            name:'访问来源',
                            type:'pie',
                            radius : '55%',
                            center: ['50%', '50%'],
                            data:[
                                {value:335, name:'直接访问'},
                                {value:310, name:'邮件营销'},
                                {value:274, name:'联盟广告'},
                                {value:235, name:'视频广告'},
                                {value:400, name:'搜索引擎'}
                            ].sort(function (a, b) { return a.value - b.value; }),
                            roseType: 'radius',
                            label: {
                                normal: {
                                    textStyle: {
                                        color: 'rgba(255, 255, 255, 0.3)'
                                    }
                                }
                            },
                            labelLine: {
                                normal: {
                                    lineStyle: {
                                        color: 'rgba(255, 255, 255, 0.3)'
                                    },
                                    smooth: 0.2,
                                    length: 10,
                                    length2: 20
                                }
                            },
                            itemStyle: {
                                normal: {
                                    color: '#c23531',
                                    shadowBlur: 200,
                                    shadowColor: 'rgba(0, 0, 0, 0.5)'
                                }
                            },
    
                            animationType: 'scale',
                            animationEasing: 'elasticOut',
                            animationDelay: function (idx) {
                                return Math.random() * 200;
                            }
                        }
                    ]
                });
            }
        }
        }
    </script>

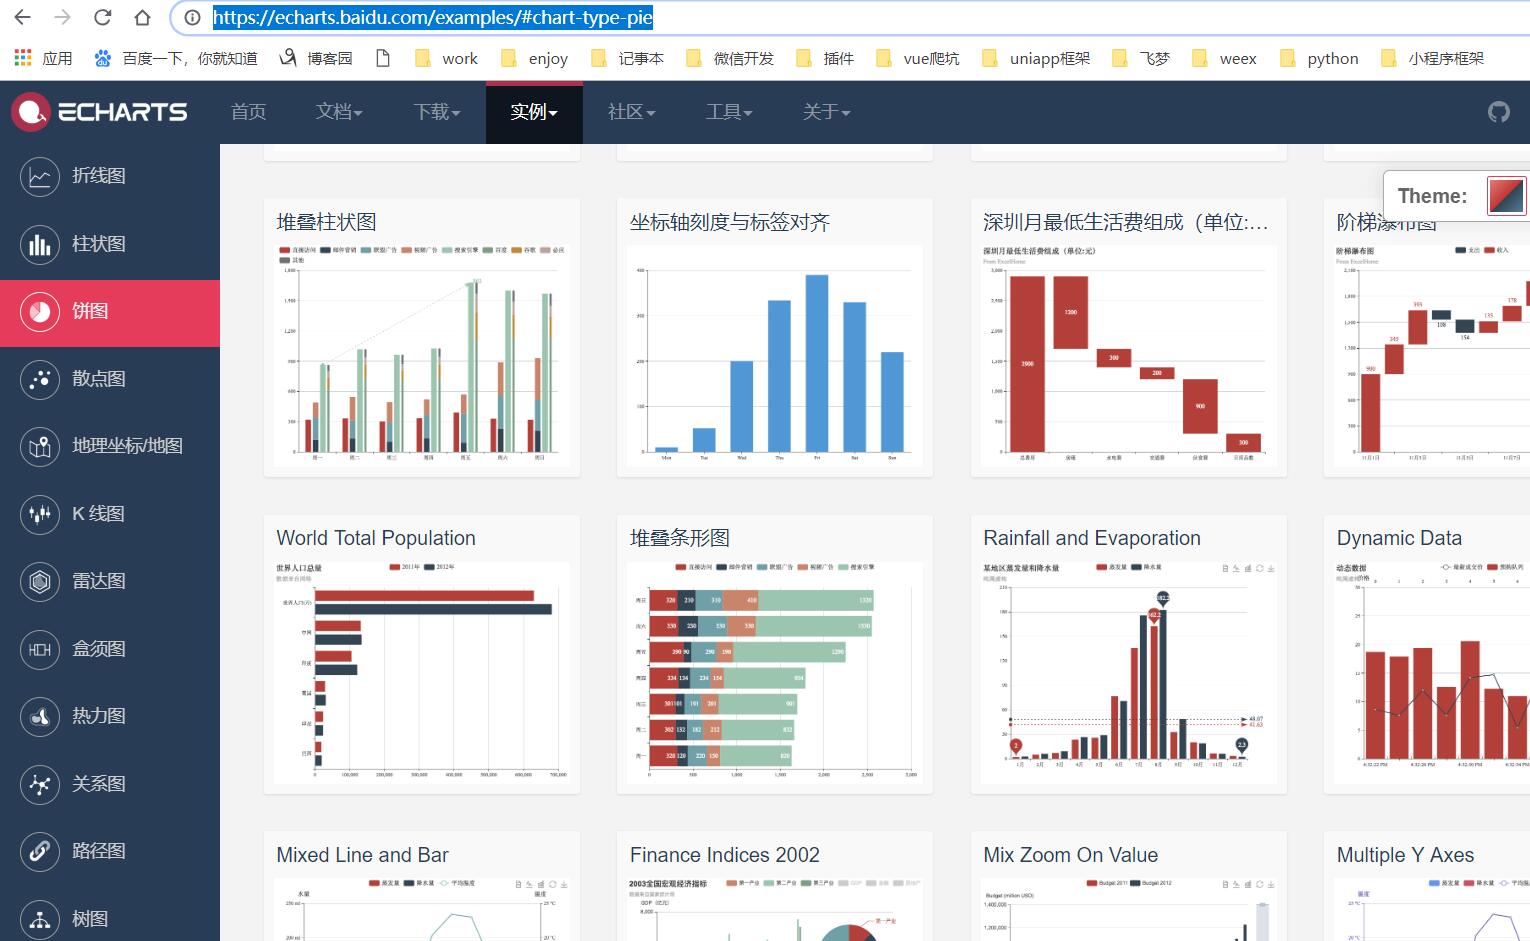
    echarts 网站链接:https://echarts.baidu.com/examples/#chart-type-line

    更具自己需要,copy就行:
     更多参考链接:https://www.jianshu.com/p/fa42e697665d


    peace & love
  • 相关阅读:
    00. 以太坊私有链创世区块
    01. 以太坊部署智能合约
    IDEA 调试技巧
    CI/CD 容器服务准备
    Redis 存储机制及淘汰策略
    02. 最佳实践
    Spring 事务
    百度图片式的瀑布流
    线程
    Vue3+TS如何判断对象类型数组中包含某一个值
  • 原文地址:https://www.cnblogs.com/520BigBear/p/11124539.html
Copyright © 2020-2023  润新知