一、http_load
程序非常小,解压后也不到100K
http_load以并行复用的方式运行,用以测试web服务器的吞吐量与负载。
但是它不同于大多数压力测试工具,它可以以一个单一的进程运行,一般不会把客户机搞死。
还可以测试HTTPS类的网站请求。
下载地址:http_load-12mar2006.tar.gz
安装很简单
#tar zxvf http_load-12mar2006.tar.gz
#cd http_load-12mar2006
#make && make install
基本用法:
http_load -p 并发访问进程数 -s 访问时间 需要访问的URL文件参数其实可以自由组合,参数之间的选择并没有什么限制。
比如你写成http_load -parallel 5 -seconds 300 urllist.txt也是可以的。
我们把参数给大家简单说明一下。
-parallel 简写-p :含义是并发的用户进程数。
-fetches 简写-f :含义是总计的访问次数
-rate 简写-p :含义是每秒的访问频率
-seconds 简写-s :含义是总计的访问时间
准备URL文件:urllist.txt,文件格式是每行一个URL,URL最好超过50-100个测试效果比较好。
文件格式如下:
http://www.qixing318.com/
http://www.qixing318.com/blog/
http://www.qixing318.com/signin/
http://www.qixing318.com/signup/
http://www.qixing318.com/article/a-quick-look-at-the-redis-source-code.html
http://www.qixing318.com/article/how-the-browser-end-encryption.html
http://www.qixing318.com/article/jquery-form-validation-plug-in-validate.js-the-basic-usage.html
http://www.qixing318.com/article/use-flash-plugin-swfupload-head-is-upload-the-screenshot-in-two-ways.html
http://www.qixing318.com/article/should-make-your-site-using-html5.html
http://www.qixing318.com/article/simple-to-understand-linux-memory-allocation-mechanism.html
http://www.qixing318.com/article/organize-the-sphinx-api-based-on-php.html
http://www.qixing318.com/article/jquery-1-9-removed-browser-method-alternatives.html
http://www.qixing318.com/article/the-installation-of-fedora-under-chinese-search-sphinx-configuration.html
http://www.qixing318.com/article/schema-org-tag-was-used-to-optimize-web-pages.html
http://www.qixing318.com/article/jquery-reference-manual-tutorials-and-tools.html
http://www.qixing318.com/article/falling-in-love-with-bike-30-reasons.html
http://www.qixing318.com/article/online-test-tools-browserstack-cross-browser-compatibility.html
http://www.qixing318.com/article/talk-about-javascript-image-preloading-technology.html
http://www.qixing318.com/article/brokeback-mountain.html
http://www.qixing318.com/article/sql-index-caused-performance-issues.html
http://www.qixing318.com/article/use-python-scapy-reporter.html
http://www.qixing318.com/article/a-python-web-attack-script.html
例如:
http_load -p 30 -s 60 urllist.txt参数了解了,我们来看运行一条命令来看看它的返回结果如下: 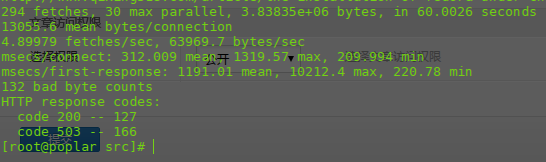
结果分析:
1、294 fetches, 30 max parallel, 3.83835e+06 bytes, in 60.0026 seconds
说明在上面的测试中运行了294个请求,最大的并发进程数是30,总计传输的数据是3.83835e+06bytes,运行的时间是60.0026秒
2、13055.6 mean bytes/connection
说明每一连接平均传输的数据量3.83835e+06/294=13055.6
3、4.89979 fetches/sec, 63969.7 bytes/sec
说明每秒的响应请求为4.89979,每秒传递的数据为63969.7 bytes/sec
4、msecs/connect: 312.009 mean, 1319.57 max, 209.994 min
说明每连接的平均响应时间是312.009 msecs,最大的响应时间1319.57 msecs,最小的响应时间209.994 msecs
5、msecs/first-response: 1191.01 mean, 10212.4 max, 220.78 min
6、HTTP response codes:
code 200 – 127
code 502 – 166
说明打开响应页面的类型
如果403的类型过多,那可能要注意是否系统遇到了瓶颈。
特殊说明:
测试结果中主要的指标是 fetches/sec、msecs/connect 这个选项,即服务器每秒能够响应的查询次数。
用这个指标来衡量性能。似乎比 apache的ab准确率要高一些,也更有说服力一些。
Qpt-每秒响应用户数和response time,每连接响应用户时间。
测试的结果主要也是看这两个值。
当然仅有这两个指标并不能完成对性能的分析,我们还需要对服务器的cpu、men进行分析,才能得出结论。
二、webbench
webbench是Linux下的一个网站压力测试工具,最多可以模拟3万个并发连接去测试网站的负载能力。
下载地址可以到google搜,我这里给出一个
下载地址:http://soft.vpser.net/test/webbench/webbench-1.5.tar.gz
这个程序更小,解压后不到50K,呵呵
安装非常简单
#tar zxvf webbench-1.5.tar.gz
#cd webbench-1.5
#make && make install
会在当前目录生成webbench可执行文件,直接可以使用了
用法:webbench -c 并发数 -t 运行测试时间 URL
例如:
#webbench -c 1000 -t 130 http://www.qixing318.com三、ab
ab是apache自带的一款功能强大的测试工具。
安装了apache一般就自带了。
用法可以查看它的说明
#./ab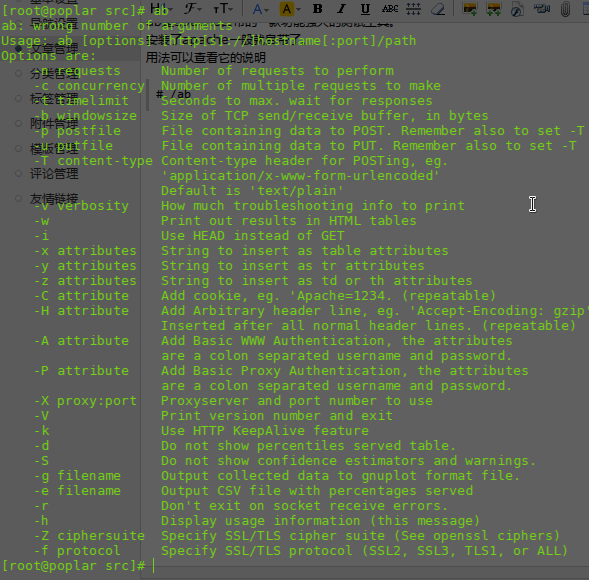
参数众多,一般我们用到的是-n 和-c
例如:
#webbench -c 1000 -t 130 http://www.qixing318.com/index.php这个表示同时处理1000个请求并运行130次index.php文件。
四、Siege
一款开源的压力测试工具,可以根据配置对一个WEB站点进行多用户的并发访问,记录每个用户所有请求过程的相应时间,并在一定数量的并发访问下重复进行。
Siege官方:http://www.joedog.org/
Siege下载:http://www.joedog.org/pub/siege/siege-latest.tar.gz
Siege解压并安装:
# tar -zxvf siege-latest.tar.gz
# cd siege-latest/
#./configure
#make
#make install
Siege使用:
#siege -c 100 -r 10 -f site.url-c是并发量,-r是重复次数。
url文件就是一个文本,每行都是一个url,它会从里面随机访问的。
site.url内容:
http://www.qixing318.com/
http://www.zendsns.com/
http://www.qixing.info/
测试结果: 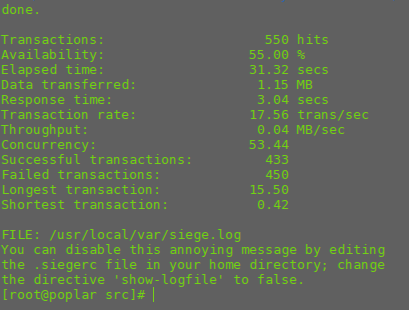
结果说明:
Transactions: 550 hits //完成550次处理
Availability: 55.00 % //55.00 % 成功率
Elapsed time: 31.32 secs //总共用时
Data transferred: 1.15 MB //共数据传输1.15 MB
Response time: 3.04 secs //显示网络连接的速度
Transaction rate: 17.56 trans/sec //均每秒完成 17.56 次处理:表示服务器后
Throughput: 0.04 MB/sec //平均每秒传送数据
Concurrency: 53.44 //实际最高并发数
Successful transactions: 433 //成功处理次数
Failed transactions: 450 //失败处理次数
Longest transaction: 15.50 //每次传输所花最长时间
Shortest transaction: 0.42 //每次传输所花最短时间