一、Bar----pyecharts
这种用pyecharts库带的方法导出来是html,我感觉不是很精简
from pyecharts import Line, Bar
# pip install pyecharts==0.1.9.4
def barDemo():
    list1 = [0.1563,0.1524,0.1519, 0.1524] #KS
    list2 = [0.3139,0.3116,0.3138,0.3111] #KSM
    labes1 = ["PCA","FA","GRP","SRP"]
    line = Line()
    line.add("KS",labes1,list1,is_label_show=True)
    line.add("KSM",labes1,list2,is_label_show=True)
    line.render()

    bar = Bar()
    bar.add("KS",labes1,list1)
    bar.add("KSM",labes1,list2)
    bar.render("res/1.html")
    # overlap.add(bar)
    # overlap.add(line)
    # overlap.render()
    # list1 = np.array(Flist)
    # a_lengend=""
    # labels = np.array(labes1)
    # bar_figure(list1,a_lengend,labels)

if __name__ == "__main__":
    # drawLineStyle()
    barDemo()
效果如下所示:

二、Bar----matplotlib
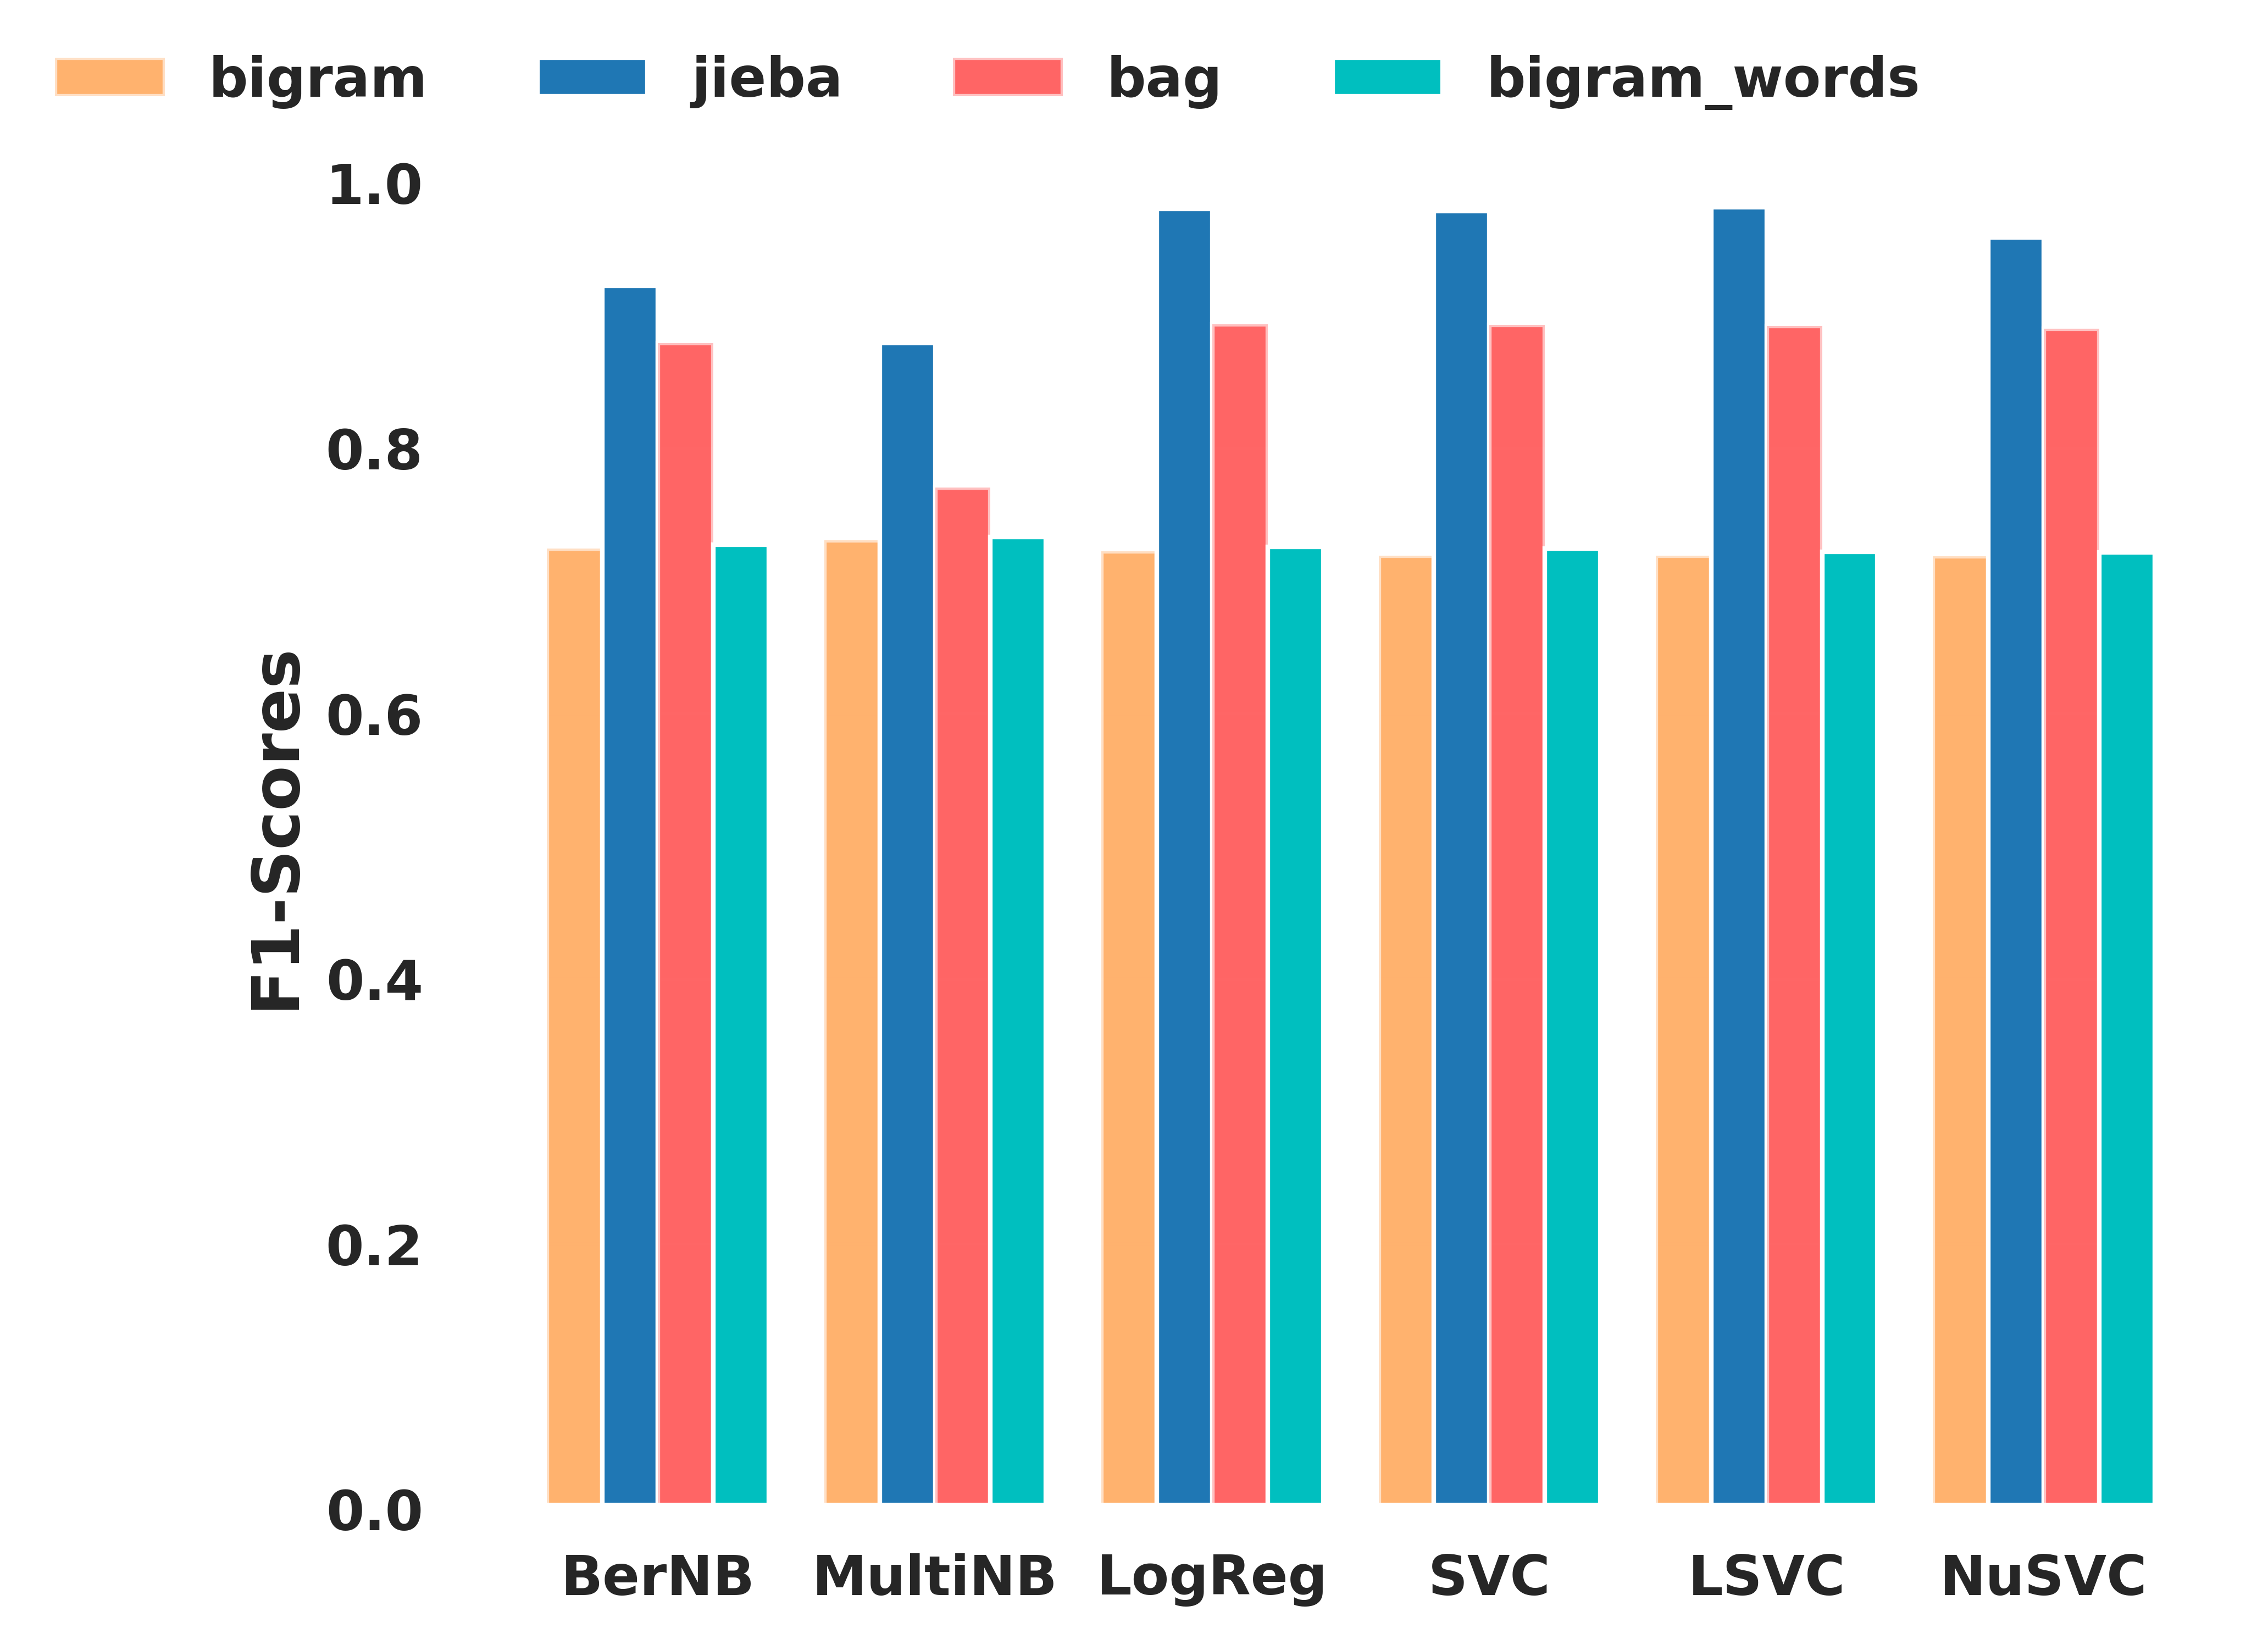
运用第二种是因为第一种改变字体大小和格式(想着日后论文中使用,也要画图,上图那种满足不了的,不好看),搜了博客也一知半解,试图直接在HTML上改变,也有点效果,可以还是觉得麻烦,我不能每画一张,就改一遍吧,尝试用matplotlib来解决
data.py
### data.py

bigram_F1Score_list=[0.724266, 0.730357, 0.722058, 0.718748, 0.718975, 0.718422]
jieba_feature_F1Score_list=[0.922546, 0.87944, 0.980582, 0.978843, 0.981803, 0.959068]
bag_of_words_F1Score_list=[0.879261, 0.770276, 0.893485, 0.892955, 0.892227, 0.890149]
bigram_words_F1Score_list=[0.727329, 0.732884, 0.725446, 0.724224, 0.72183, 0.721357]
def autolabel(rects):
    """Attach a text label above each bar in *rects*, displaying its height."""
    for rect in rects:
        height = rect.get_height()
        ax.annotate('{:.2f}'.format(height),
                    xy=(rect.get_x() + rect.get_width() / 2, height),
                    xytext=(0, -7),  # 3 points vertical offset
                    textcoords="offset points",
                    ha='center', va='bottom',rotation=45)    # 'vertical'
def barDemo_notHtml():
    x = np.arange(3,21,3)
    width = 0.6
    axes_width = 3  # 刻度线宽度
    axes_length = 6  # 刻度线长度
    spines_width = 3  # 坐标轴的宽度
    fig, ax = plt.subplots(figsize=(6.4,4.8), dpi=500)
    labels = ["BerNB", "MultiNB", "LogReg", "SVC" ,"LSVC", "NuSVC"]
    rects1 = ax.bar(x - width*1.5, data.bigram_F1Score_list, width, color='#FF7F0E', alpha=0.6,label='bigram')  # 画第一批数据
    rects2 = ax.bar(x - width/2, data.jieba_feature_F1Score_list, width, color='#1F77B4', alpha=1,label='jieba')  # 画第二批数据
    rects3 = ax.bar(x + width/2, data.bag_of_words_F1Score_list, width, color='r', alpha=0.6,label='bag')  # 画第一批数据
    rects4 = ax.bar(x + width *1.5 , data.bigram_words_F1Score_list, width, color='c', alpha=1,label='bigram_words')  # 画第二批数据

    # Add some text for labels, title and custom x-axis tick labels, etc.
    ax.set_ylabel('F1-Scores', fontsize="large", weight=font_weight, family = "Arial")
    # ax.set_title('Scores by group and gender', fontsize="large", weight=font_weight, family="Arial")
    ax.set_xticks(x)
    ax.set_xticklabels(labels)
    # Left border is always shown
    # ax.spines["left"].set_linewidth(spines_width)
    for key in ("top", "bottom", "right","left"):
    # axes.spines[key].set_visible(False)
        ax.spines[key].set_linewidth(spines_width)

    ax.tick_params(axis="y", width=axes_width, length = axes_length)  # 刻度线
    ax.tick_params(axis="x", width=axes_width, length = axes_length)
    # plt.grid(axis='y') # 网格线 x,y,both  ,有点问题
    autolabel(rects1)   # 添加 标注
    autolabel(rects2)
    autolabel(rects3)   # 添加 标注
    autolabel(rects4)
    fig.tight_layout()

    # patches = [ mpatches.Patch(color=color[i], label="{:s}".format(labels[i]) ) for i in range(len(color)) ]
    ax=plt.gca()
    box = ax.get_position()
    ax.set_position([box.x0, box.y0, box.width , box.height])
    #下面一行中bbox_to_anchor指定了legend的位置
    # ax.legend(handles=patches, bbox_to_anchor=(0.95,1.12), ncol=4) #生成legend

    legend = ax.legend(edgecolor="w",bbox_to_anchor=(0.85,1.1), ncol=4)
    frame = legend.get_frame()
    frame.set_alpha(1)
    frame.set_facecolor('none') # 设置图例legend背景透明
    plt.show()
    # 保存为透明背景的图片
    fig.savefig('res/pic/4.png', format='png', bbox_inches='tight', transparent=True, dpi=600)
效果如下图所示:

三、参考
https://blog.csdn.net/hfut_jf/article/details/52648033