撰写日期:2017-03-12
多元真实情况未必是线性的,有时需要增加指数项,也就是多项式回归,现实世界的曲线关系都是通过增加多项式实现的,本节介绍用scikit-learn解决多项式回归问题。
1、住房价格成本
样本 面积(平方米) 价格(万元)
| 样本 | 面积(平方米) | 价格(万元) |
| 1 | 50 | 150 |
| 2 | 100 | 200 |
| 3 | 150 | 250 |
| 4 | 200 | 280 |
| 5 | 250 | 310 |
| 6 | 300 | 330 |
2、绘图

 1 import sys
 2 reload(sys)
 3 sys.setdefaultencoding("utf-8")
 4 import matplotlib.pyplot as plt
 5 import numpy as np
 6
 7 plt.figure()## 实例化作图变量
 8 plt.title("single variable")#图像标题
 9 plt.xlabel("x")
10 plt.ylabel("y")
11 plt.axis([30, 400, 100, 400])
12 plt.grid(True) # 是否绘制网格线
13
14 xx = [[50],[100], [150], [200], [250], [300]]
15 yy = [[150], [200], [250], [280], [310], [330]]
16 plt.plot(xx, yy, 'k.')
17 plt.show()

2.1 使用线性回归

1 from sklearn.linear_model import LinearRegression
2 model = LinearRegression()
3 model.fit(xx, yy)
4 x2 = [[30], [400]]
5 y2 = model.predict(x2)
6 print(type(y2))
7 print(y2)
8 plt.plot(x2, y2, 'g-')
9 plt.show()

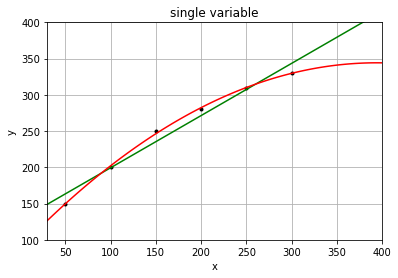
但是实际情况是,如果房屋面积一味的增加,房价并不会线性增长,因此线性关系已经无法描述真实的房价问题。
2.1 使用多项式回归

 1 import matplotlib.pyplot as plt
 2 import numpy as np
 3 from sklearn.linear_model import LinearRegression
 4 from sklearn.preprocessing import PolynomialFeatures
 5 plt.figure()# 实例化作图变量
 6 plt.title("single variable")
 7 plt.xlabel("x")
 8 plt.ylabel("y")
 9 plt.axis([30, 400, 100, 400])
10 plt.grid(True)
11 X = [[50],[100],[150],[200],[250],[300]]
12 y = [[150],[200],[250],[280],[310],[330]]
13 X_test = [[250],[300]] # 用来做最终效果测试
14 y_test = [[310],[330]] # 用来做最终效果测试
15 plt.plot(X, y, 'k.')
16 model = LinearRegression()
17 model.fit(X, y)
18 X2 = [[30], [400]]
19 y2 = model.predict(X2)
20 plt.plot(X2, y2, 'g-')
21 plt.show()
22 print(X2)
23 print(y2)
结果:

1 [[30], [400]]
2 [[ 148.93333333]
3  [ 415.33333333]]
多项式映射

 1 xx = np.linspace(30, 400, 100)#设计x轴一系列点作为画图的x点集
 2 quadratic_featurizer = PolynomialFeatures(degree=2)# 实例化一个二次多项式特征实例
 3 X_train_quadratic = quadratic_featurizer.fit_transform(X) # 用二次多项式对样本X值做变换
 4 xx_quadratic = quadratic_featurizer.transform(xx.reshape(xx.shape[0], 1)) # 把训练好X值的多项式特征实例应用到一系列点上,形成矩阵
 5 regressor_quadratic = LinearRegression() # 创建一个线性回归实例
 6 regressor_quadratic.fit(X_train_quadratic, y) # 以多项式变换后的x值为输入,代入线性回归模型做训练
 7 plt.plot(xx, regressor_quadratic.predict(xx_quadratic), 'r-') # 用训练好的模型作图
 8
 9 print '一元线性回归 r-squared', model.score(X_test, y_test)
10 X_test_quadratic = quadratic_featurizer.transform(X_test)
11 print '二次回归     r-squared', regressor_quadratic.score(X_test_quadratic, y_test)
12
13 plt.show() # 展示图像
14 #print(X)
15 #print(X_train_quadratic)
16 #print(xx_quadratic)
结果:
1 一元线性回归 r-squared 0.0755555555556
2 二次回归     r-squared 0.999336734694

红色为二次多项式回归图像,可以看到比线性模型吻合度高,输出的R方结果为:
1 一元线性回归 r-squared 0.0755555555556
2 二次回归     r-squared 0.999336734694
可以看到二次回归效果更好。
我们继续尝试一下三次回归:

 1 cubic_featurizer = PolynomialFeatures(degree=3)
 2 X_train_cubic = cubic_featurizer.fit_transform(X)
 3 regressor_cubic = LinearRegression()
 4 regressor_cubic.fit(X_train_cubic, y)
 5 xx_cubic = cubic_featurizer.transform(xx.reshape(xx.shape[0], 1))
 6 plt.plot(xx, regressor_cubic.predict(xx_cubic))
 7
 8 X_test_cubic = cubic_featurizer.transform(X_test)
 9 print '三次回归     r-squared', regressor_cubic.score(X_test_cubic, y_test)
10 plt.show() # 展示图像
结果:
1 一元线性回归 r-squared 0.0755555555556
2 二次回归     r-squared 0.999336734694
3 三次回归     r-squared 0.999464600659

可以看到三次回归比二次回归效果又好了一些,但是不是很明显。所以二次回归更可能是最适合的回归模型,三次回归可能有过拟合现象。
xx是用于预测输出的样本数据集。
