1、使用 TensorFlow 的建议
Which API(s) should you use? You should use the highest level of abstraction that solves the problem. The higher levels of abstraction are easier to use, but are also (by design) less flexible. We recommend you start with the highest-level API first and get everything working. If you need additional flexibility for some special modeling concerns, move one level lower. Note that each level is built using the APIs in lower levels, so dropping down the hierarchy should be reasonably straightforward.
2、pandas 快速入门
比官方文档更简明、易懂、实用!
首先介绍基本概念,由 csv 文件导入数据,用 dataFrame 装载、抽象数据(dataFrame 可以理解为一个二维表)。接着讲述如何访问数据,Python 中访问 dict/list 的方式普遍适用于 dataFrame 。再之后讲解如何操作数据,除了直接使用 NumPy 函数外,还有个特别有用的 Series.apply 。最后是若干个练习。 。 第一题,插入列、对列的整体运算;第二题,关于 reindex ,可以通过对索引排序来改变整个数据的排序。
3、First Steps with TensorFlow
通过一个很简单的实例(根据一个输入特征:城市街区的粒度,使用 TensorFlow 中的 LinearRegressor 类预测中位数房价)介绍如何使用 TensorFlow ,包括从导入数据到训练模型、调整参数的整个流程。首先需要搭建机器学习环境
导入 & 检查数据
在运行代码前,先将 csv 文件下载到本地并放到 .py 文件的同一目录下。
# In this first cell, we'll load the necessary libraries.

import math

from IPython import display
from matplotlib import cm
from matplotlib import gridspec
from matplotlib import pyplot as plt
import numpy as np
import pandas as pd
from sklearn import metrics
import tensorflow as tf
from tensorflow.python.data import Dataset

tf.logging.set_verbosity(tf.logging.ERROR)
pd.options.display.max_rows = 10
pd.options.display.float_format = '{:.1f}'.format

# Next, we'll load our data set.

california_housing_dataframe = pd.read_csv("california_housing_train.csv", sep=",")

california_housing_dataframe = california_housing_dataframe.reindex(
    np.random.permutation(california_housing_dataframe.index))
california_housing_dataframe["median_house_value"] /= 1000.0
california_housing_dataframe

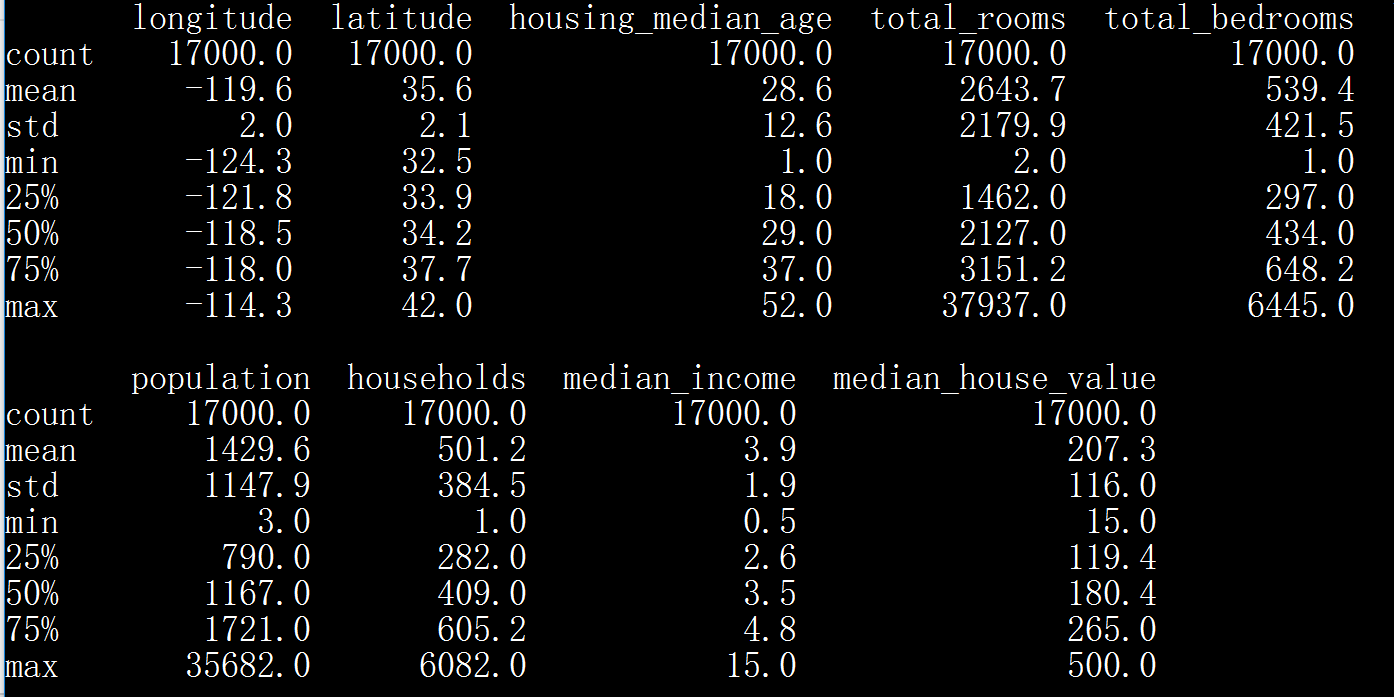
print(california_housing_dataframe.describe())

longitude 经度
latitude 纬度
housing median age 住房中位数年龄
total rooms 房子总数
total bedrooms 卧室总数
population 人口
households 户数
median income 收入
median house value 房价中位数
构建第一个模型
我们的目标是预测 median house value (某个街区的房价中位数),输入是 total rooms (某个街区的房子总数)。
为了训练我们的模型,将用到 TensorFlow Estimator 提供的 LinearRegressor 接口。 这个 API 负责处理大量低级模型管道,并提供便捷的方法来执行模型训练,评估和推理(也就是预测)。
第 1 步:定义特征 & 配置特征列
为了将训练数据导入到 tensorflow 中,我们需要指明每个特征所包含的数据类型。有两种主要的数据类型将在本次或者未来的练习中用到:
- 分类数据:文本数据。在这个练习中,数据集并没有包含任何分类数据。例如家庭风格,房地产广告中的字词。
- 数值数据:数字,或者你想把它作为数字处理的数据。有时候你会想将某些数值数据(例如邮政编码)视为一种分类。
在 tensorflow 中,我们用一种称为“特征列”的构造指明一个特征的数据类型。特征列仅存储对于特征数据的描述,它们本身并不包含特征数据。
首先,我们将仅仅使用一个数值特征作为输入,房子总数 total_rooms。以下代码从 dataframe 中提取 total_rooms 数据,并用 numeric_column 定义“特征列”,指明该列数据是数值类型:
# Define the input feature: total_rooms.
my_feature = california_housing_dataframe[["total_rooms"]]

# Configure a numeric feature column for total_rooms.
feature_columns = [tf.feature_column.numeric_column("total_rooms")]
PS. 注意分辨 特征 my_feature 与 特征列 featute_columns
第 2 步:定义目标
接下来,我们将定义我们的目标,也就是 房价中位数 median_house_value 。 同样,我们可以把它从 dataframe 中提取出来:
# Define the label.
targets = california_housing_dataframe["median_house_value"]
第 3 步:配置线性回归器
我们将用 LinearRegressor 配置一个线性回归模型。我们用 GradientDescentOptimizer(梯度下降优化器)来训练此模型,它实现了Mini-Batch SGD(小批量随机梯度下降,每次迭代随机选择 10 ~ 1000 个 example)。学习速率 learning_rate 控制了梯度步长的大小(梯度 * 学习速率 = 下一点点距离上一点的距离)。
注意:为了安全起见,我们还用到了梯度裁剪 clip_gradients_by_norm,它确保了训练期间梯度不会变得太过大,从而导致梯度下降失败。
# Use gradient descent as the optimizer for training the model.
my_optimizer=tf.train.GradientDescentOptimizer(learning_rate=0.0000001)
my_optimizer = tf.contrib.estimator.clip_gradients_by_norm(my_optimizer, 5.0)

# Configure the linear regression model with our feature columns and optimizer.
# Set a learning rate of 0.0000001 for Gradient Descent.
linear_regressor = tf.estimator.LinearRegressor(
    feature_columns=feature_columns,
    optimizer=my_optimizer
)
第 4 步:定义输入函数
为了将加州住房数据导入到我们的 LinearRegressor 中,我们需要定义一个输入函数(input function),它指明了 TensorFlow 应当如何预处理数据,以及如何在模型训练期间进行批处理,洗牌(打乱数据)和重复。
首先,我们将 Pandas 特征数据转化成 Numpy 数组的字典。之后我们可以通过 TensorFlow 的 Dataset API 用这些数据构造一个 dataset 对象,然后把我们的数据拆分成每批次大小为 batch_size 的小批次,以针对指定的 num_epochs 进行重复。
注意:当 num_epochs 为默认值时,输入的数据将被重复无限次。
接下来,如果 shuffle 被设置为 True , 我们将对数据进行“混洗”以便它在训练期间被随机地传递给模型,buffer_size 参数指定了 shuffle 将随机采样的数据集大小。
最后,我们的输入函数为 dataset 构造了一个迭代器,并将下一批次的数据返回给 LinearRegressor。
def my_input_fn(features, targets, batch_size=1, shuffle=True, num_epochs=None):
    """Trains a linear regression model of one feature.

    Args:
      features: pandas DataFrame of features
      targets: pandas DataFrame of targets
      batch_size: Size of batches to be passed to the model
      shuffle: True or False. Whether to shuffle the data.
      num_epochs: Number of epochs for which data should be repeated. None = repeat indefinitely
    Returns:
      Tuple of (features, labels) for next data batch
    """

    # Convert pandas data into a dict of np arrays.
    features = {key:np.array(value) for key,value in dict(features).items()}

    # Construct a dataset, and configure batching/repeating.
    ds = Dataset.from_tensor_slices((features,targets)) # warning: 2GB limit
    ds = ds.batch(batch_size).repeat(num_epochs)

    # Shuffle the data, if specified.
    if shuffle:
      ds = ds.shuffle(buffer_size=10000)

    # Return the next batch of data.
    features, labels = ds.make_one_shot_iterator().get_next()
    return features, labels
第 5 步:训练模型
_ = linear_regressor.train(
    input_fn = lambda:my_input_fn(my_feature, targets),
    steps=100
)
第 6 步:评估模型
# Create an input function for predictions.
# Note: Since we're making just one prediction for each example, we don't
# need to repeat or shuffle the data here.
prediction_input_fn =lambda: my_input_fn(my_feature, targets, num_epochs=1, shuffle=False)

# Call predict() on the linear_regressor to make predictions.
predictions = linear_regressor.predict(input_fn=prediction_input_fn)

# Format predictions as a NumPy array, so we can calculate error metrics.
predictions = np.array([item['predictions'][0] for item in predictions])

# Print Mean Squared Error and Root Mean Squared Error.
mean_squared_error = metrics.mean_squared_error(predictions, targets)
root_mean_squared_error = math.sqrt(mean_squared_error)
print ("Mean Squared Error (on training data): %0.3f" % mean_squared_error)
print ("Root Mean Squared Error (on training data): %0.3f" % root_mean_squared_error)

平局方差错误 MSE 很难解释,我们通常看 根号 MSE 也就是 RMSE ,RMSE 有个非常棒的属性就是可以直接和原始数据进行比对。
min_house_value = california_housing_dataframe["median_house_value"].min()
max_house_value = california_housing_dataframe["median_house_value"].max()
min_max_difference = max_house_value - min_house_value

print ("Min. Median House Value: %0.3f" % min_house_value)
print ("Max. Median House Value: %0.3f" % max_house_value)
print ("Difference between Min. and Max.: %0.3f" % min_max_difference)
print ("Root Mean Squared Error: %0.3f" % root_mean_squared_error)
