• 【转载】AntvX6 流程图 demo 基于原生 js 支持导入与导出数据


    转载

    描述

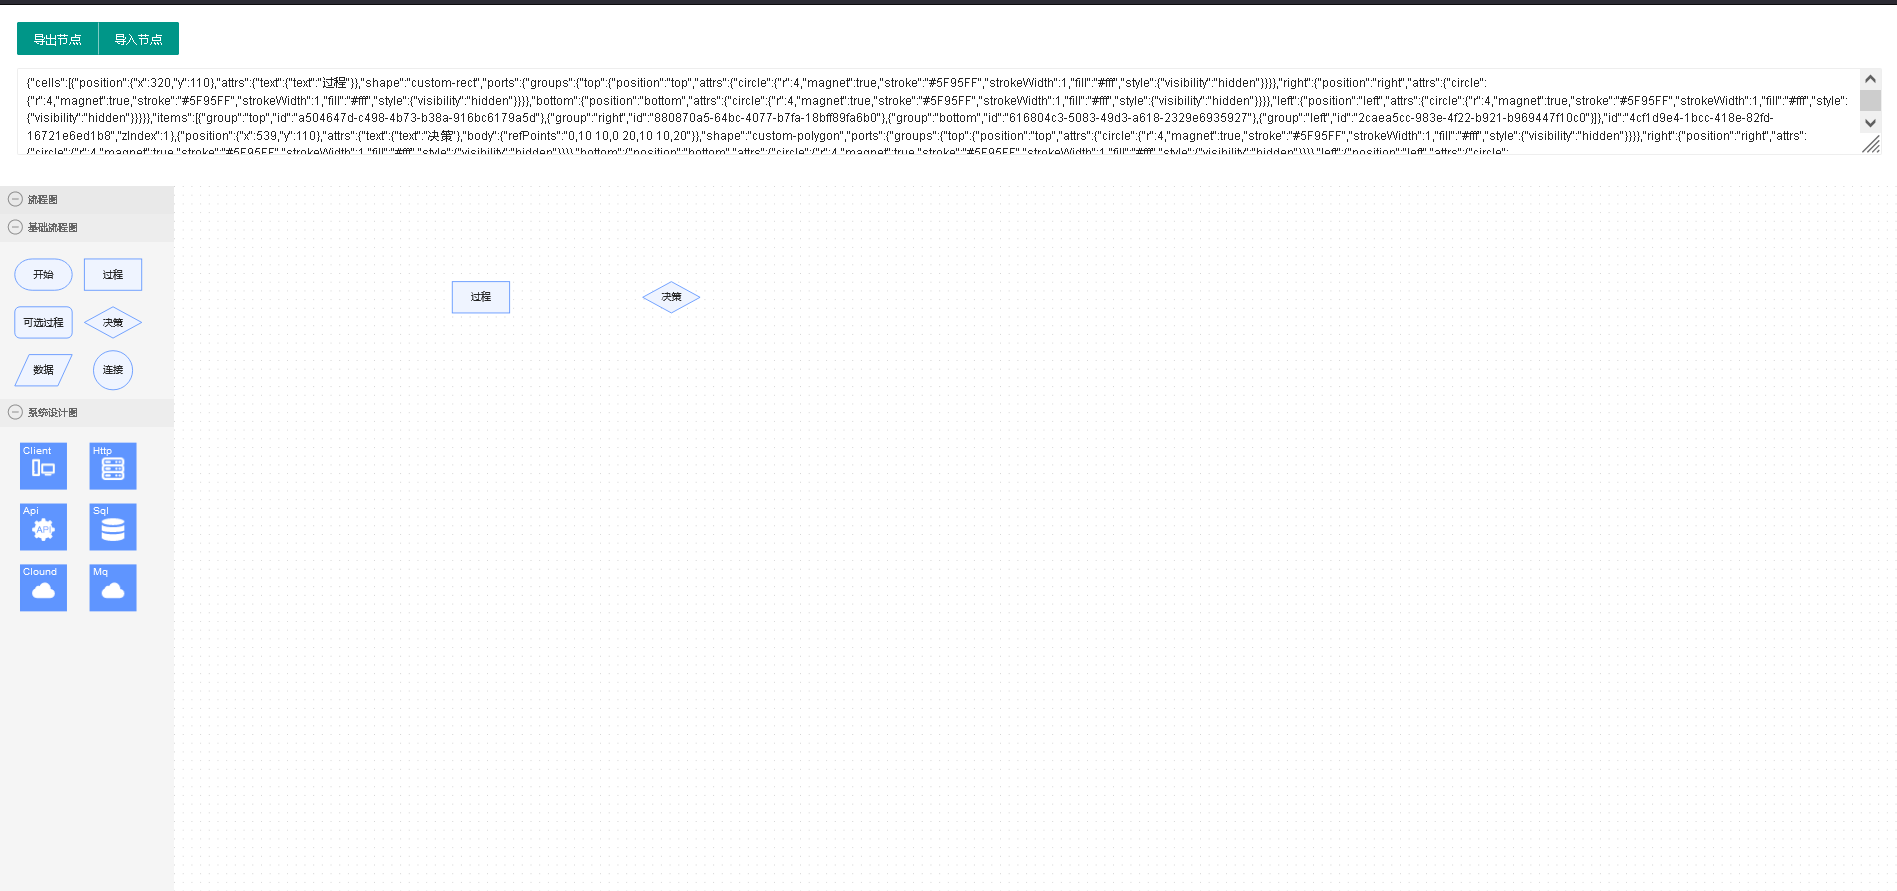
    1. 通过导出功能将界面数据导出到 textarea 中
    2. 通过导入功能将输入导入到界面中

    预览

    image

    源码

    <!DOCTYPE html>
    <html lang="en">
    
    <head>
        <meta charset="UTF-8">
        <meta http-equiv="X-UA-Compatible" content="IE=edge">
        <meta name="viewport" content="width=device-width, initial-scale=1.0">
        <title>Document</title>
        <style>
            * {
                padding: 0;
                margin: 0;
            }
    
            #stencil {
                 200px;
                height: 100vh;
                position: relative;
                float: left;
            }
    
            #graph-container {
                margin-left: 200px;
                height: 100vh;
                position: relative;
            }
        </style>
        <!-- 引入 layui.css -->
        <link href="//unpkg.com/layui@2.7.6/dist/css/layui.css" rel="stylesheet">
    
    </head>
    
    <body>
        <form class="layui-form" action="" style="padding: 20px">
            <div class="layui-form-item">
    
                <div class="layui-btn-group">
                    <button type="button" class="layui-btn" onclick="printNodeList()">导出节点</button>
                    <button type="button" class="layui-btn" onclick="importNodeList()">导入节点</button>
                </div>
            </div>
            <div class="layui-form-item">
                <textarea name="desc" placeholder="请输入内容" class="layui-textarea" id="json-data"></textarea>
            </div>
        </form>
        <div id="stencil"></div>
        <div id="graph-container"></div>
        <script src="//unpkg.com/layui@2.7.6/dist/layui.js"></script>
        <script src="https://unpkg.com/@antv/x6@1.1.1/dist/x6.js"></script>
        <script>
    
            // #region 初始化画布
            const graph = new X6.Graph({
                container: document.getElementById('graph-container'),
                grid: true,
                mousewheel: {
                    enabled: true,
                    zoomAtMousePosition: true,
                    modifiers: 'ctrl',
                    minScale: 0.5,
                    maxScale: 3,
                },
                connecting: {
                    router: {
                        name: 'manhattan',
                        args: {
                            padding: 1,
                        },
                    },
                    connector: {
                        name: 'rounded',
                        args: {
                            radius: 8,
                        },
                    },
                    anchor: 'center',
                    connectionPoint: 'anchor',
                    allowBlank: false,
                    snap: {
                        radius: 20,
                    },
                    createEdge() {
                        return new X6.Shape.Edge({
                            attrs: {
                                line: {
                                    stroke: '#A2B1C3',
                                    strokeWidth: 2,
                                    targetMarker: {
                                        name: 'block',
                                         12,
                                        height: 8,
                                    },
                                },
                            },
                            zIndex: 0,
                        })
                    },
                    validateConnection({ targetMagnet }) {
                        return !!targetMagnet
                    },
                },
                highlighting: {
                    magnetAdsorbed: {
                        name: 'stroke',
                        args: {
                            attrs: {
                                fill: '#5F95FF',
                                stroke: '#5F95FF',
                            },
                        },
                    },
                },
                resizing: true,
                rotating: true,
                selecting: {
                    enabled: true,
                    rubberband: true,
                    showNodeSelectionBox: true,
                },
                snapline: true,
                keyboard: true,
                clipboard: true,
            })
            // #endregion
    
            // #region 初始化 stencil
            const stencil = new X6.Addon.Stencil({
                title: '流程图',
                target: graph,
                stencilGraphWidth: 200,
                stencilGraphHeight: 180,
                collapsable: true,
                groups: [
                    {
                        title: '基础流程图',
                        name: 'group1',
                    },
                    {
                        title: '系统设计图',
                        name: 'group2',
                        graphHeight: 250,
                        layoutOptions: {
                            rowHeight: 70,
                        },
                    },
                ],
                layoutOptions: {
                    columns: 2,
                    columnWidth: 80,
                    rowHeight: 55,
                },
            })
            document.getElementById('stencil').appendChild(stencil.container)
            // #endregion
    
            // #region 快捷键与事件
            // copy cut paste
            graph.bindKey(['meta+c', 'ctrl+c'], () => {
                const cells = graph.getSelectedCells()
                if (cells.length) {
                    graph.copy(cells)
                }
                return false
            })
            graph.bindKey(['meta+x', 'ctrl+x'], () => {
                const cells = graph.getSelectedCells()
                if (cells.length) {
                    graph.cut(cells)
                }
                return false
            })
            graph.bindKey(['meta+v', 'ctrl+v'], () => {
                if (!graph.isClipboardEmpty()) {
                    const cells = graph.paste({ offset: 32 })
                    graph.cleanSelection()
                    graph.select(cells)
                }
                return false
            })
    
            //undo redo
            graph.bindKey(['meta+z', 'ctrl+z'], () => {
                if (graph.history.canUndo()) {
                    graph.history.undo()
                }
                return false
            })
            graph.bindKey(['meta+shift+z', 'ctrl+shift+z'], () => {
                if (graph.history.canRedo()) {
                    graph.history.redo()
                }
                return false
            })
    
            // select all
            graph.bindKey(['meta+a', 'ctrl+a'], () => {
                const nodes = graph.getNodes()
                if (nodes) {
                    graph.select(nodes)
                }
            })
    
            //delete
            graph.bindKey('backspace', () => {
                const cells = graph.getSelectedCells()
                if (cells.length) {
                    graph.removeCells(cells)
                }
            })
    
            // zoom
            graph.bindKey(['ctrl+1', 'meta+1'], () => {
                const zoom = graph.zoom()
                if (zoom < 1.5) {
                    graph.zoom(0.1)
                }
            })
            graph.bindKey(['ctrl+2', 'meta+2'], () => {
                const zoom = graph.zoom()
                if (zoom > 0.5) {
                    graph.zoom(-0.1)
                }
            })
    
            // 控制连接桩显示/隐藏
            const showPorts = (ports, show) => {
                for (let i = 0, len = ports.length; i < len; i = i + 1) {
                    ports[i].style.visibility = show ? 'visible' : 'hidden'
                }
            }
            graph.on('node:mouseenter', () => {
                const container = document.getElementById('graph-container')
                const ports = container.querySelectorAll(
                    '.x6-port-body',
                )
                showPorts(ports, true)
            })
            graph.on('node:mouseleave', () => {
                const container = document.getElementById('graph-container')
                const ports = container.querySelectorAll(
                    '.x6-port-body',
                )
                showPorts(ports, false)
            })
            // #endregion
    
            // #region 初始化图形
            const ports = {
                groups: {
                    top: {
                        position: 'top',
                        attrs: {
                            circle: {
                                r: 4,
                                magnet: true,
                                stroke: '#5F95FF',
                                strokeWidth: 1,
                                fill: '#fff',
                                style: {
                                    visibility: 'hidden',
                                },
                            },
                        },
                    },
                    right: {
                        position: 'right',
                        attrs: {
                            circle: {
                                r: 4,
                                magnet: true,
                                stroke: '#5F95FF',
                                strokeWidth: 1,
                                fill: '#fff',
                                style: {
                                    visibility: 'hidden',
                                },
                            },
                        },
                    },
                    bottom: {
                        position: 'bottom',
                        attrs: {
                            circle: {
                                r: 4,
                                magnet: true,
                                stroke: '#5F95FF',
                                strokeWidth: 1,
                                fill: '#fff',
                                style: {
                                    visibility: 'hidden',
                                },
                            },
                        },
                    },
                    left: {
                        position: 'left',
                        attrs: {
                            circle: {
                                r: 4,
                                magnet: true,
                                stroke: '#5F95FF',
                                strokeWidth: 1,
                                fill: '#fff',
                                style: {
                                    visibility: 'hidden',
                                },
                            },
                        },
                    },
                },
                items: [
                    {
                        group: 'top',
                    },
                    {
                        group: 'right',
                    },
                    {
                        group: 'bottom',
                    },
                    {
                        group: 'left',
                    },
                ],
            }
    
            X6.Graph.registerNode(
                'custom-rect',
                {
                    inherit: 'rect',
                     66,
                    height: 36,
                    attrs: {
                        body: {
                            strokeWidth: 1,
                            stroke: '#5F95FF',
                            fill: '#EFF4FF',
                        },
                        text: {
                            fontSize: 12,
                            fill: '#262626',
                        },
                    },
                    ports: { ...ports },
                },
                true,
            )
    
            X6.Graph.registerNode(
                'custom-polygon',
                {
                    inherit: 'polygon',
                     66,
                    height: 36,
                    attrs: {
                        body: {
                            strokeWidth: 1,
                            stroke: '#5F95FF',
                            fill: '#EFF4FF',
                        },
                        text: {
                            fontSize: 12,
                            fill: '#262626',
                        },
                    },
                    ports: {
                        ...ports,
                        items: [
                            {
                                group: 'top',
                            },
                            {
                                group: 'bottom',
                            },
                        ],
                    },
                },
                true,
            )
    
            X6.Graph.registerNode(
                'custom-circle',
                {
                    inherit: 'circle',
                     45,
                    height: 45,
                    attrs: {
                        body: {
                            strokeWidth: 1,
                            stroke: '#5F95FF',
                            fill: '#EFF4FF',
                        },
                        text: {
                            fontSize: 12,
                            fill: '#262626',
                        },
                    },
                    ports: { ...ports },
                },
                true,
            )
    
            X6.Graph.registerNode(
                'custom-image',
                {
                    inherit: 'rect',
                     52,
                    height: 52,
                    markup: [
                        {
                            tagName: 'rect',
                            selector: 'body',
                        },
                        {
                            tagName: 'image',
                        },
                        {
                            tagName: 'text',
                            selector: 'label',
                        },
                    ],
                    attrs: {
                        body: {
                            stroke: '#5F95FF',
                            fill: '#5F95FF',
                        },
                        image: {
                             26,
                            height: 26,
                            refX: 13,
                            refY: 16,
                        },
                        label: {
                            refX: 3,
                            refY: 2,
                            textAnchor: 'left',
                            textVerticalAnchor: 'top',
                            fontSize: 12,
                            fill: '#fff',
                        },
                    },
                    ports: { ...ports },
                },
                true,
            )
    
            const r1 = graph.createNode({
                shape: 'custom-rect',
                label: '开始',
                attrs: {
                    body: {
                        rx: 20,
                        ry: 26,
                    },
                },
            })
            const r2 = graph.createNode({
                shape: 'custom-rect',
                label: '过程',
            })
            const r3 = graph.createNode({
                shape: 'custom-rect',
                attrs: {
                    body: {
                        rx: 6,
                        ry: 6,
                    },
                },
                label: '可选过程',
            })
            const r4 = graph.createNode({
                shape: 'custom-polygon',
                attrs: {
                    body: {
                        refPoints: '0,10 10,0 20,10 10,20',
                    },
                },
                label: '决策',
            })
            const r5 = graph.createNode({
                shape: 'custom-polygon',
                attrs: {
                    body: {
                        refPoints: '10,0 40,0 30,20 0,20',
                    },
                },
                label: '数据',
            })
            const r6 = graph.createNode({
                shape: 'custom-circle',
                label: '连接',
            })
            stencil.load([r1, r2, r3, r4, r5, r6], 'group1')
    
            const imageShapes = [
                {
                    label: 'Client',
                    image:
                        'https://gw.alipayobjects.com/zos/bmw-prod/687b6cb9-4b97-42a6-96d0-34b3099133ac.svg',
                },
                {
                    label: 'Http',
                    image:
                        'https://gw.alipayobjects.com/zos/bmw-prod/dc1ced06-417d-466f-927b-b4a4d3265791.svg',
                },
                {
                    label: 'Api',
                    image:
                        'https://gw.alipayobjects.com/zos/bmw-prod/c55d7ae1-8d20-4585-bd8f-ca23653a4489.svg',
                },
                {
                    label: 'Sql',
                    image:
                        'https://gw.alipayobjects.com/zos/bmw-prod/6eb71764-18ed-4149-b868-53ad1542c405.svg',
                },
                {
                    label: 'Clound',
                    image:
                        'https://gw.alipayobjects.com/zos/bmw-prod/c36fe7cb-dc24-4854-aeb5-88d8dc36d52e.svg',
                },
                {
                    label: 'Mq',
                    image:
                        'https://gw.alipayobjects.com/zos/bmw-prod/2010ac9f-40e7-49d4-8c4a-4fcf2f83033b.svg',
                },
            ]
            const imageNodes = imageShapes.map((item) =>
                graph.createNode({
                    shape: 'custom-image',
                    label: item.label,
                    attrs: {
                        image: {
                            'xlink:href': item.image,
                        },
                    },
                }),
            )
            stencil.load(imageNodes, 'group2')
            // #endregion
    
            function preWork() {
                // 这里协助演示的代码,在实际项目中根据实际情况进行调整
                const container = document.getElementById('container')
                const stencilContainer = document.createElement('div')
                stencilContainer.id = 'stencil'
                const graphContainer = document.createElement('div')
                graphContainer.id = 'graph-container'
                container.appendChild(stencilContainer)
                container.appendChild(graphContainer)
    
                insertCss(`
                    #container {
                    display: flex;
                    border: 1px solid #dfe3e8;
                    }
                    #stencil {
                     180px;
                    height: 100%;
                    position: relative;
                    border-right: 1px solid #dfe3e8;
                    }
                    #graph-container {
                     calc(100% - 180px);
                    height: 100%;
                    }
                    .x6-widget-stencil  {
                    background-color: #fff;
                    }
                    .x6-widget-stencil-title {
                    background-color: #fff;
                    }
                    .x6-widget-stencil-group-title {
                    background-color: #fff !important;
                    }
                    .x6-widget-transform {
                    margin: -1px 0 0 -1px;
                    padding: 0px;
                    border: 1px solid #239edd;
                    }
                    .x6-widget-transform > div {
                    border: 1px solid #239edd;
                    }
                    .x6-widget-transform > div:hover {
                    background-color: #3dafe4;
                    }
                    .x6-widget-transform-active-handle {
                    background-color: #3dafe4;
                    }
                    .x6-widget-transform-resize {
                    border-radius: 0;
                    }
                    .x6-widget-selection-inner {
                    border: 1px solid #239edd;
                    }
                    .x6-widget-selection-box {
                    opacity: 0;
                    }
                `)
            }
    
            /**
             * 
             * 
             * */
            function printNodeList() {
                // graph.toJSON({ diff: true }) 导出差异数据
                // graph.toJSON() 节点与线在同列表
                console.log(graph.toJSON());
                document.querySelector("#json-data").value = JSON.stringify(graph.toJSON({ diff: true }))
            }
            /**
             * 
             * 
             * */
            function importNodeList() {
                graph.fromJSON(JSON.parse(document.querySelector("#json-data").value));
            }
        </script>
    </body>
    
    </html>
    
  • 相关阅读:
    从零到有模拟实现一个Set类
    node+express+mysql 实现登陆注册
    从路由原理出发,深入阅读理解react-router 4.0的源码
    linux rsyncserver文件同步
    为什么说Python是一门动态语言--Python的魅力
    python基础教程_学习笔记11:魔法方法、属性和迭代器
    list,set,map,数组间的相互转换
    TCP/IP协议族
    宿舍更换的新淋浴喷头"水温vs旋钮角度"关系的研究(曲线)
    单元測试中 Right-BICEP 和 CORRECT
  • 原文地址:https://www.cnblogs.com/xiaqiuchu/p/16659646.html
Copyright © 2020-2023  润新知