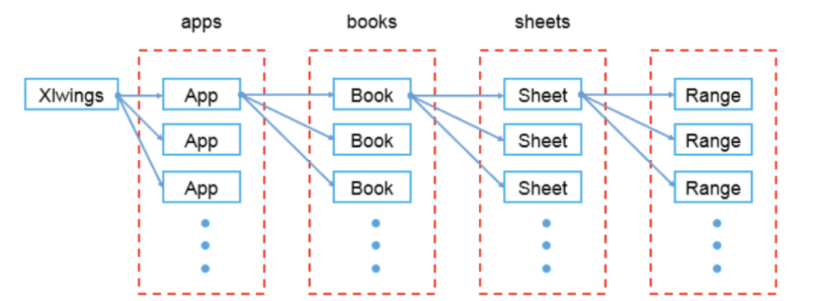
模块基本介绍与使用
基本介绍:用于Python与Excel之间的交互,可以轻松地从 Excel 调用 Python,也可以利用Python自动化操作Excel,调用VBA,非常方便。

基本使用方法:新建一个excel文件,取名为xlwings_wb.xlsx,并新建一个sheet,取名为first_sht,在其A1单元格内插入字符串Python。
# 导入xlwings,并起一个别名 xw,方便操作
import xlwings as xw

# 1、创建一个app应用,打开Excel程序
# visible=True 表示打开操作Excel过程可见 初次接触可以设置为True,了解其过程
# add_book=False 表示启动app后不用新建个工作簿
app = xw.App(visible=True, add_book=False)

# 2、新建一个工作簿
wb = app.books.add()

# 3、新建一个sheet,并操作
# 3.1 新建sheet 起名为first_sht
sht = wb.sheets.add('first_sht')
# 3.2 在新建的sheet表中A1位置插入一个值:Python
sht.range('A1').value = 'Python'
# 3.3 保存新建的工作簿,并起一个名字
wb.save('xlwings_wb.xlsx')

# 4、关闭工作簿
wb.close()

# 5、程序运行结束,退出Excel程序
app.quit()
基础语法一览
# 基础导入包
import xlwings as xw  # 程序第一步

# 打开关闭Excel程序(理解成excel软件打开、关闭)
# visible=True 表示打开操作Excel过程可见 初次接触可以设置为True,了解其过程
# add_book=False 表示启动app后不用新建个工作簿
app = xw.App(visible=True, add_book=False)  # 程序第二步

# 关闭excel程序
app.close()  # 程序最后一步
工作簿相关操作(理解成excel文件)
# 1、新建一个工作簿
wb = app.books.add()  # 程序第三步

# 2、保存新建的工作簿,并起一个名字
# 程序倒数第三步,非常关键,保存操作数据结果
wb.save('xlwings_wb.xlsx')

# 3、打开一个已经存在的工作簿
wb = app.books.open('xlwings_wb.xlsx')  # 程序第三步

# 4、关闭工作簿
wb.close()  # 程序倒数第二步
sheet相关操作(理解成工作表)
# 在工作簿中新建一个sheet,起名为 second_sht
sht1 = wb.sheets.add('second_sht')

# 选中已经存在的sheet
sht2 = wb.sheets('first_sht')

# 也可以通过索引选择已存在的sheet
sht3 = wb.sheets[0]  # 选中工作簿中的第一个sheet

# 获取工作簿中工作表的个数
sht_nums = wb.sheets.count
print('工作簿中的sheet个数为:%d'% sht_nums)

# 当前工作表名字
sht1.name

# 获取指定sheet中数据的行数
sht1.used_range.last_cell.row

# 获取指定sheet中数据的列数
sht1.used_range.last_cell.column

# 删除指定的sheet 比如删除:first_sht
wb.sheets('first_sht').delete()
单元格相关操作(就是excel单元格子)
写入
'''
写入
'''
# 在工作表中指定位置插入数据
sht1.range('B1').value = '简说Python'

# 在工作表指定位置插入多个数据 默认是横向插入
sht1.range('B2').value = [1, 2, 3, 4]

# 在工作表指定位置竖向插入多个数据
# 设置options(transpose=True),transpose=True表示转置的意思
sht1.range('B3').options(transpose=True).value = ['老表', '老表Pro', '老表Max', '老表Mini']

# 在工作表指定位置开始插入多行数据
sht1.range('B7').value = [['a', 'b'], ['c', 'd']]

# 在工作表指定位置开始插入多列数据
sht1.range('B9').options(transpose=True).value = [['a', 'b'], ['c', 'd']]

# 向单元格写入公式
sht1.range('F2').formula = '=sum(B2:E2)'
读出
'''
读取
'''
# 在工作表中读取指定位置数据
print('单元格B1=', sht1.range('B1').value)

# 在工作表中读取指定区域数据 一行
print('单元格B2:F2=', sht1.range('B2:F2').value)

# 在工作表中读取指定区域数据 一列
print('单元格B3:B6=', sht1.range('B3:B6').value)

# 在工作表中读取指定区域数据 一个区域
# 设置options(transpose=True)就可以按列读 不设置就是按行读
print('单元格B7:C10=', sht1.range('B7:C10').options(transpose=True).value)
删除
'''
删除
'''
# 删除指定单元格中的数据
sht1.range('B10').clear()

# 删除指定范围内单元格数据
sht1.range('B7:B9').clear()
格式修改
'''
格式修改
'''
# 选中已经存在的sheet
sht1 = wb.sheets('second_sht')
# 返回单元格绝对路径
sht1.range('B3').get_address()
# sht1.range('B3').address

# 合并单元格B3 C3
sht1.range('B3:C3').api.merge()

# 解除合并单元格B3 C3
sht1.range('B3:C3').api.unmerge()

# 向指定单元格添加带超链接文本
# address- 超连接地址
# text_to_display- 超链接文本内容
# screen_tip- 鼠标放到超链接上后显示提示内容
sht1.range('C2').add_hyperlink(address='https://pythonbrief.blog.csdn.net/',
                   text_to_display='简说Python CSDN博客',
                   screen_tip='点击查看简说Python CSDN博客')

# 获取指定单元格的超链接地址
sht1.range('C2').hyperlink

# 自动调试指定单元格高度和宽度
sht1.range('B1').autofit()

# 设置指定单元格背景颜色
sht1.range('B1').color = (93,199,221)

# 返回指定范围内的中第一列的编号 数字,如:A-1 B-2
sht1.range('A2:B2').column

# 获取或者设置行高/列宽
# row_height/column_width会返回行高/列宽 ,范围内行高/列宽不一致会返回None
# 也可以设置一个新的行高/列宽
sht1.range('A2').row_height = 25
sht1.range('B2').column_width = 20
在windows上可以使用以下方法设置单元格文字颜色等格式,如下:
# windows系统下字体设置在 sheet.range().api.Font下
# 颜色
sht1.range('A1').api.Font.Color = (255,0,124)
# 字体名字
sht1.range('A1').api.Font.Name = '宋体'
# 字体大小
sht1.range('A1').api.Font.Size = 28
# 是否加粗
sht1.range('A1').api.Font.Bold = True
# 数字格式
sht1.range('A1').api.NumberFormat = '0.0'
# -4108 水平居中
# -4131 靠左
# -4152 靠右
sht1.range('A1').api.HorizontalAlignment = -4108
# -4108 垂直居中(默认)
# -4160 靠上
# -4107 靠下
# -4130 自动换行对齐。
sht1.range('A1').api.VerticalAlignment = -4130

# 设置边框线风格和粗细
# Borders(9) 底部边框,LineStyle = 1 直线。
sht.range(1,1).api.Borders(9).LineStyle = 1
sht.range(1,1).api.Borders(9).Weight = 3  # 设置边框粗细。

# Borders(7) 左边框,LineStyle = 2 虚线。
sht.range(1,1).api.Borders(7).LineStyle = 1
sht.range(1,1).api.Borders(7).Weight = 3

# Borders(8) 顶部框,LineStyle = 5 双点划线。
sht.range(1,1).api.Borders(8).LineStyle = 1
sht.range(1,1).api.Borders(8).Weight = 3

# Borders(10) 右边框,LineStyle = 4 点划线。
sht.range(1,1).api.Borders(10).LineStyle = 1
sht.range(1,1).api.Borders(10).Weight = 3

...
在mac下可以通过以下方法设置字体格式:
# 设置单元格的字体颜色
rgb_tuple = (0, 10, 200)
sht1.range('B1').api.font_object.color.set(rgb_tuple)

# 获取指定单元格字体颜色
sht1.range('B1').api.font_object.color.get()

# 获取指定单元格字体名字 可以使用set方法修改字体 set('宋体')
sht1.range('B1').api.font_object.name.get()

# 设置指定单元格字体格式 可以用get方法查看单元格字体格式
sht1.range('B3').api.font_object.font_style.set('加粗')

# 设置指定单元格字体大小
sht1.range('B3').api.font_object.font_size.set(20)

# 设置边框线粗细
sht1.range('B2').api.get_border(which_border=9).weight.set(4)

# 设置边框线风格
sht1.range('B2').api.get_border(which_border=9).line_style.set(8)
...
进行完所有操作后一定要记得执行以下三句:
# 保存新建的工作簿,并起一个名字(如果已存在有名字的excel文件,就直接save即可)
wb.save()
# 关闭工作簿(关闭Excel文件)
wb.close()
# 程序运行结束,退出Excel程序
app.quit()
自动生成统计图
import xlwings as xw

# 新建一个sheet
app = xw.App(visible=True, add_book=False)
wb = app.books.open('xlwings_wb.xlsx')
sht3 = wb.sheets.add('third_sht')

import pandas as pd
import numpy as np

# 生成模拟数据
df = pd.DataFrame({
    'money':np.random.randint(45, 50, size = [1, 20])[0],
},
    index=pd.date_range('2021-02-01', '2021-02-20'),  # 行索引和时间相关
)
df.index.name = '消费日期'  # 设置索引名字

sht3.range('A1').value = df

# 生成图表
chart1 = sht3.charts.add()  # 创建一个图表对象
chart1.set_source_data(sht3.range('A1').expand())  # 加载数据
chart1.chart_type = 'line'  # 设置图标类型
chart1.top = sht3.range('D2').top
chart1.left = sht3.range('D2').left  # 设置图标开始位置
除了绘制折线图,我们还可以绘制其他类型的图,修改chart_type值即可。
# 查看其他chart_types值
xw.constants.chart_types
返回结果
('3d_area',
 '3d_area_stacked',
 '3d_area_stacked_100',
 '3d_bar_clustered',
 '3d_bar_stacked',
 '3d_bar_stacked_100',
 '3d_column',
 '3d_column_clustered',
 '3d_column_stacked',
 '3d_column_stacked_100',
 '3d_line',  # 3D折线图
 '3d_pie', # 3D饼图
 '3d_pie_exploded',
 'area',  # 面积图
 'area_stacked',
 'area_stacked_100',
 'bar_clustered',  # 柱状图相关
 'bar_of_pie',
 'bar_stacked',
 'bar_stacked_100',
 'bubble',  # 气泡图
 'bubble_3d_effect',
 'column_clustered',  # 条形图相关
 'column_stacked',
 'column_stacked_100',
 'combination',
 'cone_bar_clustered',
 'cone_bar_stacked',
 'cone_bar_stacked_100',
 'cone_col',
 'cone_col_clustered',
 'cone_col_stacked',
 'cone_col_stacked_100',
 'cylinder_bar_clustered',
 'cylinder_bar_stacked',
 'cylinder_bar_stacked_100',
 'cylinder_col',
 'cylinder_col_clustered',
 'cylinder_col_stacked',
 'cylinder_col_stacked_100',
 'doughnut',
 'doughnut_exploded',
 'line',  # 折线图
 'line_markers',
 'line_markers_stacked',
 'line_markers_stacked_100',
 'line_stacked',
 'line_stacked_100',
 'pie',
 'pie_exploded',
 'pie_of_pie',
 'pyramid_bar_clustered',
 'pyramid_bar_stacked',
 'pyramid_bar_stacked_100',
 'pyramid_col',
 'pyramid_col_clustered',
 'pyramid_col_stacked',
 'pyramid_col_stacked_100',
 'radar',
 'radar_filled',
 'radar_markers',
 'stock_hlc',  # 有意思 股票K线图
 'stock_ohlc',
 'stock_vhlc',
 'stock_vohlc',
 'surface',
 'surface_top_view',
 'surface_top_view_wireframe',
 'surface_wireframe',
 'xy_scatter',
 'xy_scatter_lines',
 'xy_scatter_lines_no_markers',
 'xy_scatter_smooth',
 'xy_scatter_smooth_no_markers')
将本地图片或者matplotlib图片保存到excel
'''
matplotlib 生成的图片存入excel
'''
import matplotlib.pyplot as plt
# 随便绘制一个饼图
fig1 = plt.figure()  # 先创建一个图像对象
plt.pie([0.5, 0.3, 0.2],  # 值
        labels=['a', 'b', 'c'],  # 标签
        explode=(0, 0.2, 0),  # (爆裂)距离
        autopct='%1.1f%%',   # 显示百分数格式
        shadow=True)  # 是否显示阴影
plt.show()

# 将饼图添加到excel指定位置 J17为图片开始位置
sht3.pictures.add(fig1, name='matplotlib',
                  left=sht3.range('J17').left,
                  top=sht3.range('J17').top, update=True)
'''
本地图片存入excel
'''
# 将本地图片添加到excel指定位置 J1为图片开始位置
pic_path = './0923.jpeg'
sht3.pictures.add(pic_path, name='local',
                  left=sht3.range('J1').left,
                  top=sht3.range('J1').top, update=True)