
为啥Logo是条鱼, Jamie Guinan说:
对于一条鱼来说,众所周知,弓鱼(fish)会通过向它们吐水来击落植物上的虫子(bug)。
Gdb 快速指南
动态调试器实用程序gdb具有大量功能。本快速指南列出了一小部分有用的gdb命令。
准备
- 使用 -g 选项编译。
例子。编译程序 printch.cpp:
hawk% g++ -g printch.cpp -o printch - 启动 gdb 并设置要列出的源代码行数。
例子。在 bin 程序上运行 gdb 并将一次要列出的源代码行数设置为 28。
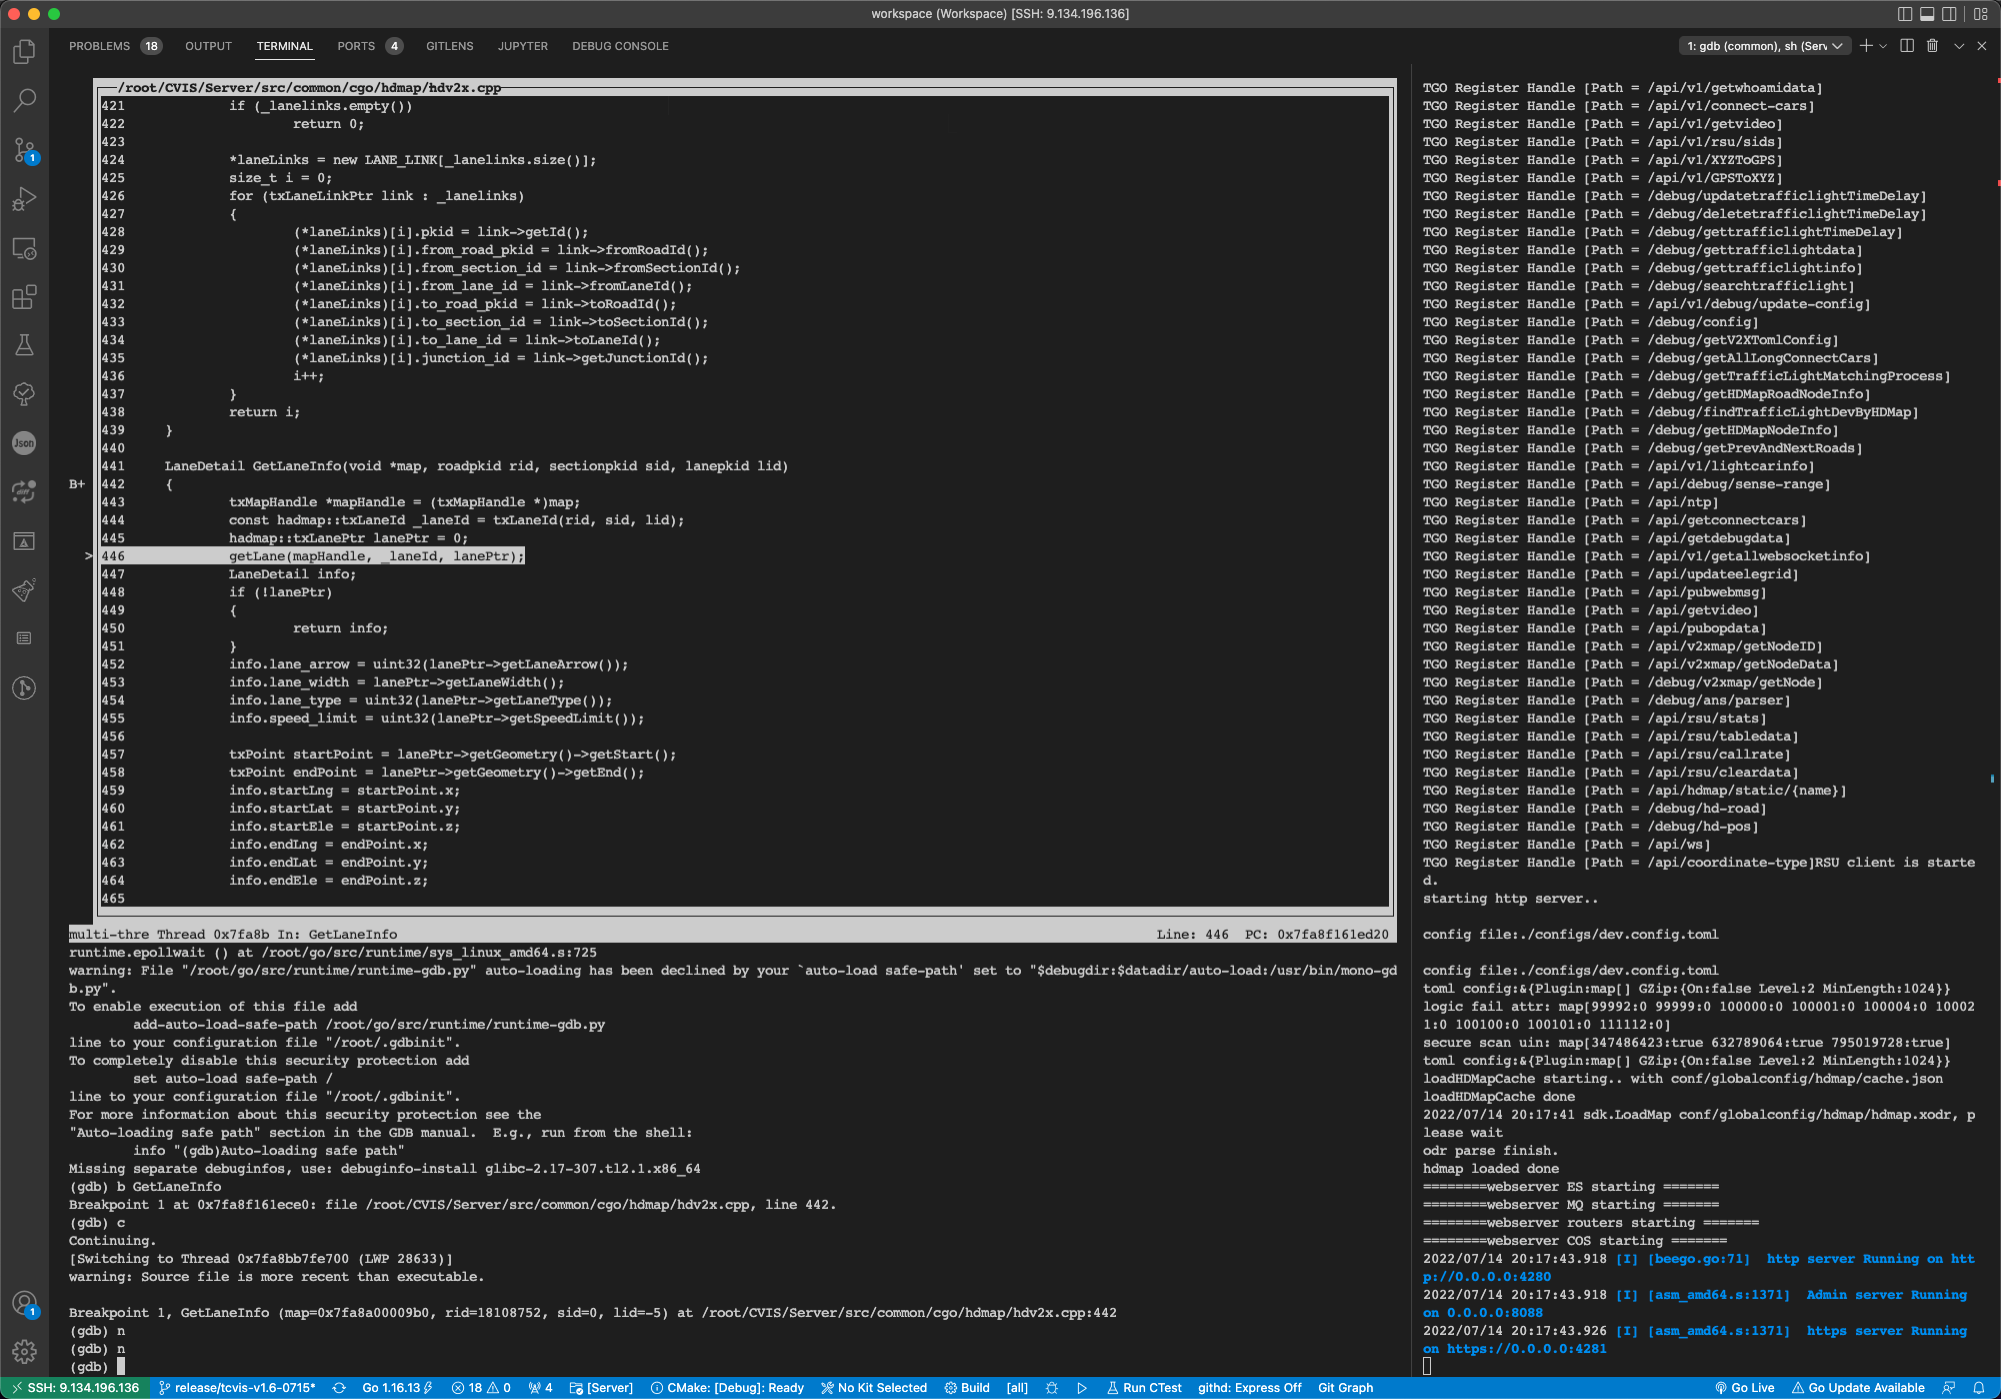
% gdb -xdb -tui ./bin GNU gdb 4.17.1 # 如果要调试进程换成 # gdb -xdb -tui -p $(pgrep bin) (gdb)set listsize 28 - 如图
设置断点
断点是代码中gdb将停止并允许执行其他gdb命令的点。
- 在函数的开头设置断点。
例子。在开头设置断点
main。(gdb)b main - 调试时在当前文件的某行设置断点。
例子。在文件 printch.cpp 中的第 35 行设置断点。
(gdb)b 35 - 在类成员函数的开头设置断点。
例子。在类列表的成员函数 擦除开始处设置断点。
(gdb) b list::erase - 列出断点。
例子。列出迄今为止在调试会话中设置的所有断点。
(gdb) info b Num Type Disp Enb Address What 1 breakpoint keep y 0x0040104f in main at printch.cpp:27 2 breakpoint keep y 0x004010a7 in main at printch.cpp:35 - 删除断点。
例子。删除第 35 行的断点。
(gdb)delete 2
运行被调试的程序
- 启动正在调试的程序。
示例 1. 程序是 printch,它可以采用可选的命令行参数。在没有命令行参数的情况下启动它。
(gdb)r示例 2. 使用命令行参数A启动 printch 运行 。
(gdb)r A - 执行单个语句。如果语句是函数调用,只需单步进入函数。
(gdb)s - 执行单个语句。如果语句是函数调用,则执行整个函数并返回调用后的语句;即跨过函数。
(gdb)n - 如果有断点,则从当前点执行到下一个断点,否则执行直到程序终止。
(gdb)c - 执行当前函数的其余部分;也就是跳出函数。
(gdb)finish
检查变量
- 打印变量或表达式的值。
示例 1. 打印变量的值
count(gdb)p count示例 2. 打印表达式 fname[i+1] 的值
(gdb) p fname[i+1]
列出源代码和下一条语句
- 列出源代码行。
例子。列出下一个listsize代码行数。请注意,listsize的值可以通过 set命令更改。
(gdb)l - 列出以特定行为中心的源代码行。
例子。列出以第 41 行为中心的行。
(gdb)l 41 - 显示将要执行的下一条语句。
(gdb) where
#0  mystrcpy (copyto=0x259fc6c "*", copyfrom=0x259fddc "ABC") at printch.cpp:27
#1  0x4010c8 in main (argc=3, argv=0x25b0cb8) at printch.cpp:40
函数第 27 行的语句
mystrcpy是 下一条语句,函数 mystrcpy 被调用main。
帮助和退出 Gdb
有一个帮助命令,h退出gdb的命令是q.
最常用的命令
| Gdb 命令 | 描述 |
|---|---|
| set listsize n | 将 list 命令列出的行数设置为n [set listsize] |
| b function | 在函数 开头设置断点[break] |
| b line number | 在当前文件的行号处设置断点。[休息] |
| info b | 列出所有断点[信息] |
| delete n | 删除断点编号n [delete] |
| r args | 启动正在调试的程序,可能使用命令行参数args。[跑] |
| s count | 单步下一个计数语句(默认为 1)。步入 函数。[步] |
| n count | 单步下一个计数语句(默认为 1)。跳过 功能。[下一个] |
| finish | 执行当前函数的其余部分。跳出当前功能。[结束] |
| c | 如果没有遇到断点,则继续执行到下一个断点或直到终止。[继续] |
| p expression | 打印表达式的值 [打印] |
| l optional_line | 列出下一个listsize行。如果给出optional_line,列出以optional_line为中心的行。[列表] |
| where | 显示当前行和函数以及使您到达那里的调用堆栈。[在哪里] |
| h optional_topic | 关于optional_topic 的帮助或帮助[帮助] |
| q | 退出 gdb [退出] |
命令参数表
Command class: aliases

ni -- Step one instruction
rc -- Continue program being debugged but run it in reverse
rni -- Step backward one instruction
rsi -- Step backward exactly one instruction
si -- Step one instruction exactly
stepping -- Specify single-stepping behavior at a tracepoint
tp -- Set a tracepoint at specified line or function
tty -- Set terminal for future runs of program being debugged
where -- Print backtrace of all stack frames
ws -- Specify single-stepping behavior at a tracepoint

Command class: breakpoints

awatch -- Set a watchpoint for an expression
break -- Set breakpoint at specified line or function
break-range -- Set a breakpoint for an address range
catch -- Set catchpoints to catch events
catch assert -- Catch failed Ada assertions
catch catch -- Catch an exception
catch exception -- Catch Ada exceptions
catch exec -- Catch calls to exec
catch fork -- Catch calls to fork
catch load -- Catch loads of shared libraries
catch signal -- Catch signals by their names and/or numbers
catch syscall -- Catch system calls by their names and/or numbers
catch throw -- Catch an exception
catch unload -- Catch unloads of shared libraries
catch vfork -- Catch calls to vfork

clear -- Clear breakpoint at specified line or function
commands -- Set commands to be executed when a breakpoint is hit
condition -- Specify breakpoint number N to break only if COND is true
delete -- Delete some breakpoints or auto-display expressions
delete bookmark -- Delete a bookmark from the bookmark list
delete breakpoints -- Delete some breakpoints or auto-display expressions
delete checkpoint -- Delete a checkpoint (experimental)
delete display -- Cancel some expressions to be displayed when program stops
delete mem -- Delete memory region
delete tracepoints -- Delete specified tracepoints
delete tvariable -- Delete one or more trace state variables
disable -- Disable some breakpoints
disable breakpoints -- Disable some breakpoints
disable display -- Disable some expressions to be displayed when program stops
disable frame-filter -- GDB command to disable the specified frame-filter
disable mem -- Disable memory region
disable pretty-printer -- GDB command to disable the specified pretty-printer
disable tracepoints -- Disable specified tracepoints
disable type-printer -- GDB command to disable the specified type-printer
dprintf -- Set a dynamic printf at specified line or function
enable -- Enable some breakpoints
enable breakpoints -- Enable some breakpoints
enable breakpoints count -- Enable breakpoints for COUNT hits
enable breakpoints delete -- Enable breakpoints and delete when hit
enable breakpoints once -- Enable breakpoints for one hit
enable count -- Enable breakpoints for COUNT hits
enable delete -- Enable breakpoints and delete when hit
enable display -- Enable some expressions to be displayed when program stops
enable frame-filter -- GDB command to disable the specified frame-filter
enable mem -- Enable memory region
enable once -- Enable breakpoints for one hit

enable pretty-printer -- GDB command to enable the specified pretty-printer
enable tracepoints -- Enable specified tracepoints
enable type-printer -- GDB command to enable the specified type printer
ftrace -- Set a fast tracepoint at specified line or function
hbreak -- Set a hardware assisted breakpoint
ignore -- Set ignore-count of breakpoint number N to COUNT
rbreak -- Set a breakpoint for all functions matching REGEXP
rwatch -- Set a read watchpoint for an expression
save -- Save breakpoint definitions as a script
save breakpoints -- Save current breakpoint definitions as a script
save gdb-index -- Save a gdb-index file
save tracepoints -- Save current tracepoint definitions as a script
skip -- Ignore a function while stepping
skip delete -- Delete skip entries
skip disable -- Disable skip entries
skip enable -- Enable skip entries
skip file -- Ignore a file while stepping
skip function -- Ignore a function while stepping
strace -- Set a static tracepoint at specified line
tbreak -- Set a temporary breakpoint
tcatch -- Set temporary catchpoints to catch events
tcatch assert -- Catch failed Ada assertions
tcatch catch -- Catch an exception
tcatch exception -- Catch Ada exceptions
tcatch exec -- Catch calls to exec
tcatch fork -- Catch calls to fork
tcatch load -- Catch loads of shared libraries
tcatch signal -- Catch signals by their names and/or numbers
tcatch syscall -- Catch system calls by their names and/or numbers
tcatch throw -- Catch an exception
tcatch unload -- Catch unloads of shared libraries

tcatch vfork -- Catch calls to vfork
thbreak -- Set a temporary hardware assisted breakpoint
trace -- Set a tracepoint at specified line or function
watch -- Set a watchpoint for an expression

Command class: data

agent-printf -- Agent-printf "printf format string"
append -- Append target code/data to a local file
append binary -- Append target code/data to a raw binary file
append binary memory -- Append contents of memory to a raw binary file
append binary value -- Append the value of an expression to a raw binary file
append memory -- Append contents of memory to a raw binary file
append value -- Append the value of an expression to a raw binary file
call -- Call a function in the program
disassemble -- Disassemble a specified section of memory
display -- Print value of expression EXP each time the program stops
dump -- Dump target code/data to a local file
dump binary -- Write target code/data to a raw binary file
dump binary memory -- Write contents of memory to a raw binary file
dump binary value -- Write the value of an expression to a raw binary file
dump ihex -- Write target code/data to an intel hex file
dump ihex memory -- Write contents of memory to an ihex file
dump ihex value -- Write the value of an expression to an ihex file
dump memory -- Write contents of memory to a raw binary file
dump srec -- Write target code/data to an srec file
dump srec memory -- Write contents of memory to an srec file
dump srec value -- Write the value of an expression to an srec file
dump tekhex -- Write target code/data to a tekhex file
dump tekhex memory -- Write contents of memory to a tekhex file
dump tekhex value -- Write the value of an expression to a tekhex file

dump value -- Write the value of an expression to a raw binary file
explore -- Explore a value or a type valid in the current context
explore type -- Explore a type or the type of an expression valid in the current
explore value -- Explore value of an expression valid in the current context
find -- Search memory for a sequence of bytes
init-if-undefined -- Initialize a convenience variable if necessary
mem -- Define attributes for memory region or reset memory region handling to
output -- Like "print" but don't put in value history and don't print newline
print -- Print value of expression EXP
print-object -- Ask an Objective-C object to print itself
printf -- Printf "printf format string"
ptype -- Print definition of type TYPE
restore -- Restore the contents of FILE to target memory
set -- Evaluate expression EXP and assign result to variable VAR
set ada -- Prefix command for changing Ada-specfic settings
set ada trust-PAD-over-XVS -- Enable or disable an optimization trusting PAD types over XVS types
set agent -- Set debugger's willingness to use agent as a helper
set annotate -- Set annotation_level
set architecture -- Set architecture of target
set args -- Set argument list to give program being debugged when it is started
set auto-load -- Auto-loading specific settings
set auto-load gdb-scripts -- Enable or disable auto-loading of canned sequences of commands scripts
set auto-load libthread-db -- Enable or disable auto-loading of inferior specific libthread_db
set auto-load local-gdbinit -- Enable or disable auto-loading of .gdbinit script in current directory
set auto-load python-scripts -- Set the debugger's behaviour regarding auto-loaded Python scripts
set auto-load safe-path -- Set the list of files and directories that are safe for auto-loading
set auto-load scripts-directory -- Set the list of directories from which to load auto-loaded scripts
set auto-load-scripts -- Set the debugger's behaviour regarding auto-loaded Python scripts
set auto-solib-add -- Set autoloading of shared library symbols
set backtrace -- Set backtrace specific variables
set backtrace limit -- Set an upper bound on the number of backtrace levels

set backtrace past-entry -- Set whether backtraces should continue past the entry point of a program
set backtrace past-main -- Set whether backtraces should continue past "main"
set basenames-may-differ -- Set whether a source file may have multiple base names
set breakpoint -- Breakpoint specific settings
set breakpoint always-inserted -- Set mode for inserting breakpoints
set breakpoint auto-hw -- Set automatic usage of hardware breakpoints
set breakpoint condition-evaluation -- Set mode of breakpoint condition evaluation
set breakpoint pending -- Set debugger's behavior regarding pending breakpoints
set build-id-core-loads -- Set whether CORE-FILE loads the build-id associated files automatically
set build-id-verbose -- Set debugging level of the build-id locator
set can-use-hw-watchpoints -- Set debugger's willingness to use watchpoint hardware
set case-sensitive -- Set case sensitivity in name search
set charset -- Set the host and target character sets
set check -- Set the status of the type/range checker
set check range -- Set range checking
set check type -- Set strict type checking
set circular-trace-buffer -- Set target's use of circular trace buffer
set coerce-float-to-double -- Set coercion of floats to doubles when calling functions
set complaints -- Set max number of complaints about incorrect symbols
set confirm -- Set whether to confirm potentially dangerous operations
set cp-abi -- Set the ABI used for inspecting C++ objects
set data-directory -- Set GDB's data directory
set dcache -- Use this command to set number of lines in dcache and line-size
set dcache line-size -- Set dcache line size in bytes (must be power of 2)
set dcache size -- Set number of dcache lines
set debug -- Generic command for setting gdb debugging flags
set debug arch -- Set architecture debugging
set debug auto-load -- Set auto-load verifications debugging
set debug check-physname -- Set cross-checking of "physname" code against demangler
set debug coff-pe-read -- Set coff PE read debugging
set debug displaced -- Set displaced stepping debugging

set debug dwarf2-die -- Set debugging of the dwarf2 DIE reader
set debug dwarf2-read -- Set debugging of the dwarf2 reader
set debug entry-values -- Set entry values and tail call frames debugging
set debug expression -- Set expression debugging
set debug frame -- Set frame debugging
set debug infrun -- Set inferior debugging
set debug jit -- Set JIT debugging
set debug libthread-db -- Set libthread-db debugging
set debug lin-lwp -- Set debugging of GNU/Linux lwp module
set debug notification -- Set debugging of async remote notification
set debug observer -- Set observer debugging
set debug overload -- Set debugging of C++ overloading
set debug parser -- Set parser debugging
set debug record -- Set debugging of record/replay feature
set debug remote -- Set debugging of remote protocol
set debug serial -- Set serial debugging
set debug stap-expression -- Set SystemTap expression debugging
set debug symtab-create -- Set debugging of symbol table creation
set debug target -- Set target debugging
set debug timestamp -- Set timestamping of debugging messages
set debug xml -- Set XML parser debugging
set debug-file-directory -- Set the directories where separate debug symbols are searched for
set debugvarobj -- Set varobj debugging
set default-collect -- Set the list of expressions to collect by default
set demangle-style -- Set the current C++ demangling style
set detach-on-fork -- Set whether gdb will detach the child of a fork
set directories -- Set the search path for finding source files
set disable-randomization -- Set disabling of debuggee's virtual address space randomization
set disassemble-next-line -- Set whether to disassemble next source line or insn when execution stops
set disassembly-flavor -- Set the disassembly flavor
set disconnected-dprintf -- Set whether dprintf continues after GDB disconnects

set disconnected-tracing -- Set whether tracing continues after GDB disconnects
set displaced-stepping -- Set debugger's willingness to use displaced stepping
set dprintf-channel -- Set the channel to use for dynamic printf
set dprintf-function -- Set the function to use for dynamic printf
set dprintf-style -- Set the style of usage for dynamic printf
set dump-excluded-mappings -- Set whether gcore should dump mappings marked with the VM_DONTDUMP flag
set editing -- Set editing of command lines as they are typed
set endian -- Set endianness of target
set environment -- Set environment variable value to give the program
set exec-direction -- Set direction of execution
set exec-done-display -- Set notification of completion for asynchronous execution commands
set exec-wrapper -- Set a wrapper for running programs
set extended-prompt -- Set the extended prompt
set extension-language -- Set mapping between filename extension and source language
set filename-display -- Set how to display filenames
set follow-exec-mode -- Set debugger response to a program call of exec
set follow-fork-mode -- Set debugger response to a program call of fork or vfork
set frame-filter -- Prefix command for 'set' frame-filter related operations
set frame-filter priority -- GDB command to set the priority of the specified frame-filter
set gnutarget -- Set the current BFD target
set height -- Set number of lines in a page for GDB output pagination
set history -- Generic command for setting command history parameters
set history expansion -- Set history expansion on command input
set history filename -- Set the filename in which to record the command history
set history save -- Set saving of the history record on exit
set history size -- Set the size of the command history
set host-charset -- Set the host character set
set inferior-tty -- Set terminal for future runs of program being debugged
set input-radix -- Set default input radix for entering numbers
set interactive-mode -- Set whether GDB's standard input is a terminal
set language -- Set the current source language

set libthread-db-search-path -- Set search path for libthread_db
set listsize -- Set number of source lines gdb will list by default
set logging -- Set logging options
set logging file -- Set the current logfile
set logging off -- Disable logging
set logging on -- Enable logging
set logging overwrite -- Set whether logging overwrites or appends to the log file
set logging redirect -- Set the logging output mode
set max-user-call-depth -- Set the max call depth for non-python user-defined commands
set may-insert-breakpoints -- Set permission to insert breakpoints in the target
set may-insert-fast-tracepoints -- Set permission to insert fast tracepoints in the target
set may-insert-tracepoints -- Set permission to insert tracepoints in the target
set may-interrupt -- Set permission to interrupt or signal the target
set may-write-memory -- Set permission to write into target memory
set may-write-registers -- Set permission to write into registers
set mem -- Memory regions settings
set mem inaccessible-by-default -- Set handling of unknown memory regions
set multiple-symbols -- Set the debugger behavior when more than one symbol are possible matches
set non-stop -- Set whether gdb controls the inferior in non-stop mode
set observer -- Set whether gdb controls the inferior in observer mode
set opaque-type-resolution -- Set resolution of opaque struct/class/union types (if set before loading symbols)
set osabi -- Set OS ABI of target
set output-radix -- Set default output radix for printing of values
set overload-resolution -- Set overload resolution in evaluating C++ functions
set pagination -- Set state of GDB output pagination
set powerpc -- Various PowerPC-specific commands
set powerpc exact-watchpoints -- Set whether to use just one debug register for watchpoints on scalars
set powerpc soft-float -- Set whether to use a soft-float ABI
set powerpc vector-abi -- Set the vector ABI
set print -- Generic command for setting how things print
set print address -- Set printing of addresses

set print array -- Set prettyprinting of arrays
set print array-indexes -- Set printing of array indexes
set print asm-demangle -- Set demangling of C++/ObjC names in disassembly listings
set print demangle -- Set demangling of encoded C++/ObjC names when displaying symbols
set print elements -- Set limit on string chars or array elements to print
set print entry-values -- Set printing of function arguments at function entry
set print frame-arguments -- Set printing of non-scalar frame arguments
set print inferior-events -- Set printing of inferior events (e.g.
set print max-symbolic-offset -- Set the largest offset that will be printed in <symbol+1234> form
set print null-stop -- Set printing of char arrays to stop at first null char
set print object -- Set printing of object's derived type based on vtable info
set print pascal_static-members -- Set printing of pascal static members
set print pretty -- Set prettyprinting of structures
set print repeats -- Set threshold for repeated print elements
set print sevenbit-strings -- Set printing of 8-bit characters in strings as \nnn
set print static-members -- Set printing of C++ static members
set print symbol -- Set printing of symbol names when printing pointers
set print symbol-filename -- Set printing of source filename and line number with <symbol>
set print thread-events -- Set printing of thread events (such as thread start and exit)
set print type -- Generic command for setting how types print
show print type methods -- Set printing of methods defined in classes
show print type typedefs -- Set printing of typedefs defined in classes
set print union -- Set printing of unions interior to structures
set print vtbl -- Set printing of C++ virtual function tables
set prompt -- Set gdb's prompt
set python -- Prefix command for python preference settings
set python print-stack -- Set mode for Python stack dump on error
set radix -- Set default input and output number radices
set ravenscar -- Prefix command for changing Ravenscar-specific settings
set ravenscar task-switching -- Enable or disable support for GNAT Ravenscar tasks
set record -- Set record options

set record full -- Set record options
set record full insn-number-max -- Set record/replay buffer limit
set record full memory-query -- Set whether query if PREC cannot record memory change of next instruction
set record full stop-at-limit -- Set whether record/replay stops when record/replay buffer becomes full
set record function-call-history-size -- Set number of function to print in "record function-call-history"
set record instruction-history-size -- Set number of instructions to print in "record instruction-history"
set remote -- Remote protocol specific variables
set remote P-packet -- Set use of remote protocol `P' (set-register) packet
set remote TracepointSource-packet -- Set use of remote protocol `TracepointSource' (TracepointSource) packet
set remote X-packet -- Set use of remote protocol `X' (binary-download) packet
set remote Z-packet -- Set use of remote protocol `Z' packets
set remote access-watchpoint-packet -- Set use of remote protocol `Z4' (access-watchpoint) packet
set remote agent-packet -- Set use of remote protocol `QAgent' (agent) packet
set remote allow-packet -- Set use of remote protocol `QAllow' (allow) packet
set remote attach-packet -- Set use of remote protocol `vAttach' (attach) packet
set remote binary-download-packet -- Set use of remote protocol `X' (binary-download) packet
set remote breakpoint-commands-packet -- Set use of remote protocol `BreakpointCommands' (breakpoint-commands) packet
set remote conditional-breakpoints-packet -- Set use of remote protocol `ConditionalBreakpoints' (conditional-breakpoints) packet
set remote conditional-tracepoints-packet -- Set use of remote protocol `ConditionalTracepoints' (conditional-tracepoints) packet
set remote disable-btrace-packet -- Set use of remote protocol `Qbtrace:off' (disable-btrace) packet
set remote disable-randomization-packet -- Set use of remote protocol `QDisableRandomization' (disable-randomization) packet
set remote enable-btrace-packet -- Set use of remote protocol `Qbtrace:bts' (enable-btrace) packet
set remote exec-file -- Set the remote pathname for "run"
set remote fast-tracepoints-packet -- Set use of remote protocol `FastTracepoints' (fast-tracepoints) packet
set remote fetch-register-packet -- Set use of remote protocol `p' (fetch-register) packet
set remote get-thread-information-block-address-packet -- Set use of remote protocol `qGetTIBAddr' (get-thread-information-block-address) packet
set remote get-thread-local-storage-address-packet -- Set use of remote protocol `qGetTLSAddr' (get-thread-local-storage-address) packet

set remote hardware-breakpoint-limit -- Set the maximum number of target hardware breakpoints
set remote hardware-breakpoint-packet -- Set use of remote protocol `Z1' (hardware-breakpoint) packet
set remote hardware-watchpoint-length-limit -- Set the maximum length (in bytes) of a target hardware watchpoint
set remote hardware-watchpoint-limit -- Set the maximum number of target hardware watchpoints
set remote hostio-close-packet -- Set use of remote protocol `vFile:close' (hostio-close) packet
set remote hostio-open-packet -- Set use of remote protocol `vFile:open' (hostio-open) packet
set remote hostio-pread-packet -- Set use of remote protocol `vFile:pread' (hostio-pread) packet
set remote hostio-pwrite-packet -- Set use of remote protocol `vFile:pwrite' (hostio-pwrite) packet
set remote hostio-readlink-packet -- Set use of remote protocol `vFile:readlink' (hostio-readlink) packet
set remote hostio-unlink-packet -- Set use of remote protocol `vFile:unlink' (hostio-unlink) packet
set remote hwbreak-feature-packet -- Set use of remote protocol `hwbreak-feature' (hwbreak-feature) packet
set remote install-in-trace-packet -- Set use of remote protocol `InstallInTrace' (install-in-trace) packet
set remote interrupt-on-connect -- Set whether interrupt-sequence is sent to remote target when gdb connects to
set remote interrupt-sequence -- Set interrupt sequence to remote target
set remote kill-packet -- Set use of remote protocol `vKill' (kill) packet
set remote library-info-packet -- Set use of remote protocol `qXfer:libraries:read' (library-info) packet
set remote library-info-svr4-packet -- Set use of remote protocol `qXfer:libraries-svr4:read' (library-info-svr4) packet
set remote memory-map-packet -- Set use of remote protocol `qXfer:memory-map:read' (memory-map) packet
set remote memory-read-packet-size -- Set the maximum number of bytes per memory-read packet
set remote memory-write-packet-size -- Set the maximum number of bytes per memory-write packet
set remote noack-packet -- Set use of remote protocol `QStartNoAckMode' (noack) packet
set remote osdata-packet -- Set use of remote protocol `qXfer:osdata:read' (osdata) packet
set remote p-packet -- Set use of remote protocol `p' (fetch-register) packet
set remote pass-signals-packet -- Set use of remote protocol `QPassSignals' (pass-signals) packet
set remote program-signals-packet -- Set use of remote protocol `QProgramSignals' (program-signals) packet
set remote query-attached-packet -- Set use of remote protocol `qAttached' (query-attached) packet
set remote read-aux-vector-packet -- Set use of remote protocol `qXfer:auxv:read' (read-aux-vector) packet
set remote read-btrace-packet -- Set use of remote protocol `qXfer:btrace' (read-btrace) packet
set remote read-fdpic-loadmap-packet -- Set use of remote protocol `qXfer:fdpic:read' (read-fdpic-loadmap) packet
set remote read-sdata-object-packet -- Set use of remote protocol `qXfer:statictrace:read' (read-sdata-object) packet
set remote read-siginfo-object-packet -- Set use of remote protocol `qXfer:siginfo:read' (read-siginfo-object) packet

set remote read-spu-object-packet -- Set use of remote protocol `qXfer:spu:read' (read-spu-object) packet
set remote read-watchpoint-packet -- Set use of remote protocol `Z3' (read-watchpoint) packet
set remote reverse-continue-packet -- Set use of remote protocol `bc' (reverse-continue) packet
set remote reverse-step-packet -- Set use of remote protocol `bs' (reverse-step) packet
set remote run-packet -- Set use of remote protocol `vRun' (run) packet
set remote search-memory-packet -- Set use of remote protocol `qSearch:memory' (search-memory) packet
set remote set-register-packet -- Set use of remote protocol `P' (set-register) packet
set remote software-breakpoint-packet -- Set use of remote protocol `Z0' (software-breakpoint) packet
set remote static-tracepoints-packet -- Set use of remote protocol `StaticTracepoints' (static-tracepoints) packet
set remote supported-packets-packet -- Set use of remote protocol `qSupported' (supported-packets) packet
set remote symbol-lookup-packet -- Set use of remote protocol `qSymbol' (symbol-lookup) packet
set remote system-call-allowed -- Set if the host system(3) call is allowed for the target
set remote target-features-packet -- Set use of remote protocol `qXfer:features:read' (target-features) packet
set remote threads-packet -- Set use of remote protocol `qXfer:threads:read' (threads) packet
set remote trace-buffer-size-packet -- Set use of remote protocol `QTBuffer:size' (trace-buffer-size) packet
set remote traceframe-info-packet -- Set use of remote protocol `qXfer:trace-frame-info:read' (traceframe-info) packet
set remote unwind-info-block-packet -- Set use of remote protocol `qXfer:uib:read' (unwind-info-block) packet
set remote verbose-resume-packet -- Set use of remote protocol `vCont' (verbose-resume) packet
set remote write-siginfo-object-packet -- Set use of remote protocol `qXfer:siginfo:write' (write-siginfo-object) packet
set remote write-spu-object-packet -- Set use of remote protocol `qXfer:spu:write' (write-spu-object) packet
set remote write-watchpoint-packet -- Set use of remote protocol `Z2' (write-watchpoint) packet
set remoteaddresssize -- Set the maximum size of the address (in bits) in a memory packet
set remotebaud -- Set baud rate for remote serial I/O
set remotebreak -- Set whether to send break if interrupted
set remotecache -- Set cache use for remote targets
set remoteflow -- Set use of hardware flow control for remote serial I/O
set remotelogbase -- Set numerical base for remote session logging
set remotelogfile -- Set filename for remote session recording
set remotetimeout -- Set timeout limit to wait for target to respond
set remotewritesize -- Set the maximum number of bytes per memory write packet (deprecated)
set schedule-multiple -- Set mode for resuming threads of all processes

set scheduler-locking -- Set mode for locking scheduler during execution
set script-extension -- Set mode for script filename extension recognition
set serial -- Set default serial/parallel port configuration
set solib-absolute-prefix -- Set an alternate system root
set solib-search-path -- Set the search path for loading non-absolute shared library symbol files
set stack-cache -- Set cache use for stack access
set step-mode -- Set mode of the step operation
set stop-on-solib-events -- Set stopping for shared library events
set struct-convention -- Set the convention for returning small structs
set substitute-path -- Usage: set substitute-path FROM TO
set sysroot -- Set an alternate system root
set target-async -- Set whether gdb controls the inferior in asynchronous mode
set target-charset -- Set the target character set
set target-file-system-kind -- Set assumed file system kind for target reported file names
set target-wide-charset -- Set the target wide character set
set tcp -- TCP protocol specific variables
set tcp auto-retry -- Set auto-retry on socket connect
set tcp connect-timeout -- Set timeout limit for socket connection
set tdesc -- Set target description specific variables
set tdesc filename -- Set the file to read for an XML target description
set trace-buffer-size -- Set requested size of trace buffer
set trace-commands -- Set tracing of GDB CLI commands
set trace-notes -- Set notes string to use for current and future trace runs
set trace-stop-notes -- Set notes string to use for future tstop commands
set trace-user -- Set the user name to use for current and future trace runs
set trust-readonly-sections -- Set mode for reading from readonly sections
set tui -- TUI configuration variables
set tui active-border-mode -- Set the attribute mode to use for the active TUI window border
set tui border-kind -- Set the kind of border for TUI windows
set tui border-mode -- Set the attribute mode to use for the TUI window borders
set unwind-on-terminating-exception -- Set unwinding of stack if std::terminate is called while in call dummy

set unwindonsignal -- Set unwinding of stack if a signal is received while in a call dummy
set use-coredump-filter -- Set whether gcore should consider /proc/PID/coredump_filter
set use-deprecated-index-sections -- Set whether to use deprecated gdb_index sections
set variable -- Evaluate expression EXP and assign result to variable VAR
set verbose -- Set verbosity
set watchdog -- Set watchdog timer
set width -- Set number of characters where GDB should wrap lines of its output
set write -- Set writing into executable and core files
undisplay -- Cancel some expressions to be displayed when program stops
whatis -- Print data type of expression EXP
x -- Examine memory: x/FMT ADDRESS

Command class: files

add-symbol-file -- Load symbols from FILE
add-symbol-file-from-memory -- Load the symbols out of memory from a dynamically loaded object file
cd -- Set working directory to DIR for debugger and program being debugged
core-file -- Use FILE as core dump for examining memory and registers
directory -- Add directory DIR to beginning of search path for source files
edit -- Edit specified file or function
exec-file -- Use FILE as program for getting contents of pure memory
file -- Use FILE as program to be debugged
forward-search -- Search for regular expression (see regex(3)) from last line listed
generate-core-file -- Save a core file with the current state of the debugged process
list -- List specified function or line
load -- Dynamically load FILE into the running program
nosharedlibrary -- Unload all shared object library symbols
path -- Add directory DIR(s) to beginning of search path for object files
pwd -- Print working directory
remote -- Manipulate files on the remote system
remote delete -- Delete a remote file

remote get -- Copy a remote file to the local system
remote put -- Copy a local file to the remote system
reverse-search -- Search backward for regular expression (see regex(3)) from last line listed
search -- Search for regular expression (see regex(3)) from last line listed
section -- Change the base address of section SECTION of the exec file to ADDR
sharedlibrary -- Load shared object library symbols for files matching REGEXP
symbol-file -- Load symbol table from executable file FILE

Command class: internals

flushregs -- Force gdb to flush its register cache (maintainer command)
maintenance -- Commands for use by GDB maintainers
maintenance agent -- Translate an expression into remote agent bytecode for tracing
maintenance agent-eval -- Translate an expression into remote agent bytecode for evaluation
maintenance agent-printf -- Translate an expression into remote agent bytecode for evaluation and display the bytecodes
maintenance check-symtabs -- Check consistency of psymtabs and symtabs
maintenance cplus -- C++ maintenance commands
maintenance cplus first_component -- Print the first class/namespace component of NAME
maintenance cplus namespace -- Deprecated placeholder for removed functionality
maintenance demangle -- Demangle a C++/ObjC mangled name
maintenance deprecate -- Deprecate a command
maintenance dump-me -- Get fatal error; make debugger dump its core
maintenance info -- Commands for showing internal info about the program being debugged
maintenance info bfds -- List the BFDs that are currently open
maintenance info breakpoints -- Status of all breakpoints
maintenance info program-spaces -- Info about currently known program spaces
maintenance info psymtabs -- List the partial symbol tables for all object files
maintenance info sections -- List the BFD sections of the exec and core files
maintenance info symtabs -- List the full symbol tables for all object files
maintenance internal-error -- Give GDB an internal error
maintenance internal-warning -- Give GDB an internal warning

maintenance packet -- Send an arbitrary packet to a remote target
maintenance print -- Maintenance command for printing GDB internal state
maintenance print architecture -- Print the internal architecture configuration
maintenance print c-tdesc -- Print the current target description as a C source file
maintenance print cooked-registers -- Print the internal register configuration including cooked values
maintenance print dummy-frames -- Print the contents of the internal dummy-frame stack
maintenance print msymbols -- Print dump of current minimal symbol definitions
maintenance print objfiles -- Print dump of current object file definitions
maintenance print psymbols -- Print dump of current partial symbol definitions
maintenance print raw-registers -- Print the internal register configuration including raw values
maintenance print reggroups -- Print the internal register group names
maintenance print register-groups -- Print the internal register configuration including each register's group
maintenance print registers -- Print the internal register configuration
maintenance print remote-registers -- Print the internal register configuration including each register's
maintenance print statistics -- Print statistics about internal gdb state
maintenance print symbols -- Print dump of current symbol definitions
maintenance print target-stack -- Print the name of each layer of the internal target stack
maintenance print type -- Print a type chain for a given symbol
maintenance set -- Set GDB internal variables used by the GDB maintainer
maintenance set dwarf2 -- Set DWARF 2 specific variables
maintenance set dwarf2 always-disassemble -- Set whether `info address' always disassembles DWARF expressions
maintenance set dwarf2 max-cache-age -- Set the upper bound on the age of cached dwarf2 compilation units
maintenance set internal-error -- Configure what GDB does when internal-error is detected
maintenance set internal-error corefile -- Set whether GDB should create a core file of GDB when internal-error is detected
maintenance set internal-error quit -- Set whether GDB should quit when an internal-error is detected
maintenance set internal-warning -- Configure what GDB does when internal-warning is detected
maintenance set internal-warning corefile -- Set whether GDB should create a core file of GDB when internal-warning is detected
maintenance set internal-warning quit -- Set whether GDB should quit when an internal-warning is detected
maintenance set profile -- Set internal profiling
maintenance set show-debug-regs -- Set whether to show variables that mirror the x86 debug registers

maintenance show -- Show GDB internal variables used by the GDB maintainer
maintenance show dwarf2 -- Show DWARF 2 specific variables
maintenance show dwarf2 always-disassemble -- Show whether `info address' always disassembles DWARF expressions
maintenance show dwarf2 max-cache-age -- Show the upper bound on the age of cached dwarf2 compilation units
maintenance show internal-error -- Show what GDB does when internal-error is detected
maintenance show internal-error corefile -- Show whether GDB will create a core file of GDB when internal-error is detected
maintenance show internal-error quit -- Show whether GDB will quit when an internal-error is detected
maintenance show internal-warning -- Show what GDB does when internal-warning is detected
maintenance show internal-warning corefile -- Show whether GDB will create a core file of GDB when internal-warning is detected
maintenance show internal-warning quit -- Show whether GDB will quit when an internal-warning is detected
maintenance show profile -- Show internal profiling
maintenance show show-debug-regs -- Show whether to show variables that mirror the x86 debug registers
maintenance space -- Set the display of space usage
maintenance time -- Set the display of time usage
maintenance translate-address -- Translate a section name and address to a symbol
maintenance undeprecate -- Undeprecate a command

Command class: obscure

checkpoint -- Fork a duplicate process (experimental)
compare-sections -- Compare section data on target to the exec file
complete -- List the completions for the rest of the line as a command
ignore-errors -- Execute a single command
monitor -- Send a command to the remote monitor (remote targets only)
python -- Evaluate a Python command
python-interactive -- Start an interactive Python prompt
record -- Start recording
record btrace -- Start branch trace recording
record delete -- Delete the rest of execution log and start recording it anew
record full -- Start full execution recording

record full restore -- Restore the execution log from a file
record function-call-history -- Prints the execution history at function granularity
record goto -- Restore the program to its state at instruction number N
record instruction-history -- Print disassembled instructions stored in the execution log
record save -- Save the execution log to a file
record stop -- Stop the record/replay target
restart -- Restart <n>: restore program context from a checkpoint
stop -- There is no `stop' command

Command class: running

advance -- Continue the program up to the given location (same form as args for break command)
attach -- Attach to a process or file outside of GDB
continue -- Continue program being debugged
detach -- Detach a process or file previously attached
detach checkpoint -- Detach from a checkpoint (experimental)
detach inferiors -- Detach from inferior ID (or list of IDS)
disconnect -- Disconnect from a target
finish -- Execute until selected stack frame returns
handle -- Specify how to handle signals
inferior -- Use this command to switch between inferiors
interrupt -- Interrupt the execution of the debugged program
jump -- Continue program being debugged at specified line or address
kill -- Kill execution of program being debugged
kill inferiors -- Kill inferior ID (or list of IDs)
next -- Step program
nexti -- Step one instruction
reverse-continue -- Continue program being debugged but run it in reverse
reverse-finish -- Execute backward until just before selected stack frame is called
reverse-next -- Step program backward
reverse-nexti -- Step backward one instruction

reverse-step -- Step program backward until it reaches the beginning of another source line
reverse-stepi -- Step backward exactly one instruction
run -- Start debugged program
signal -- Continue program with the specified signal
start -- Run the debugged program until the beginning of the main procedure
step -- Step program until it reaches a different source line
stepi -- Step one instruction exactly
target -- Connect to a target machine or process
target child -- Unix child process (started by the "run" command)
target core -- Use a core file as a target
target exec -- Use an executable file as a target
target extended-remote -- Use a remote computer via a serial line
target multi-thread -- Threads and pthreads support
target ravenscar -- Ravenscar tasks support
target record -- Log program while executing and replay execution from log
target record-btrace -- Collect control-flow trace and provide the execution history
target record-core -- Log program while executing and replay execution from log
target record-full -- Log program while executing and replay execution from log
target remote -- Use a remote computer via a serial line
target spu -- SPU multi-architecture support
target tfile -- Use a trace file as a target
task -- Use this command to switch between Ada tasks
thread -- Use this command to switch between threads
thread apply -- Apply a command to a list of threads
thread apply all -- Apply a command to all threads
thread find -- Find threads that match a regular expression
thread name -- Set the current thread's name
until -- Execute until the program reaches a source line greater than the current

Command class: stack


backtrace -- Print backtrace of all stack frames
bt -- Print backtrace of all stack frames
down -- Select and print stack frame called by this one
frame -- Select and print a stack frame
return -- Make selected stack frame return to its caller
select-frame -- Select a stack frame without printing anything
up -- Select and print stack frame that called this one

Command class: status

info -- Generic command for showing things about the program being debugged
info address -- Describe where symbol SYM is stored
info all-registers -- List of all registers and their contents
info args -- Argument variables of current stack frame
info auto-load -- Print current status of auto-loaded files
info auto-load gdb-scripts -- Print the list of automatically loaded sequences of commands
info auto-load libthread-db -- Print the list of loaded inferior specific libthread_db
info auto-load local-gdbinit -- Print whether current directory .gdbinit file has been loaded
info auto-load python-scripts -- Print the list of automatically loaded Python scripts
info auto-load-scripts -- Print the list of automatically loaded Python scripts
info auxv -- Display the inferior's auxiliary vector
info bookmarks -- Status of user-settable bookmarks
info breakpoints -- Status of specified breakpoints (all user-settable breakpoints if no argument)
info checkpoints -- IDs of currently known checkpoints
info classes -- All Objective-C classes
info common -- Print out the values contained in a Fortran COMMON block
info copying -- Conditions for redistributing copies of GDB
info dcache -- Print information on the dcache performance
info display -- Expressions to display when program stops
info extensions -- All filename extensions associated with a source language
info files -- Names of targets and files being debugged

info float -- Print the status of the floating point unit
info frame -- All about selected stack frame
info frame-filter -- List all registered Python frame-filters
info functions -- All function names
info handle -- What debugger does when program gets various signals
info inferiors -- IDs of specified inferiors (all inferiors if no argument)
info line -- Core addresses of the code for a source line
info locals -- Local variables of current stack frame
info macro -- Show the definition of MACRO
info macros -- Show the definitions of all macros at LINESPEC
info mem -- Memory region attributes
info os -- Show OS data ARG
info pretty-printer -- GDB command to list all registered pretty-printers
info probes -- Show available static probes
info probes all -- Show information about all type of probes
info probes stap -- Show information about SystemTap static probes
info proc -- Show /proc process information about any running process
info proc all -- List all available /proc info
info proc cmdline -- List command line arguments of the process
info proc cwd -- List current working directory of the process
info proc exe -- List absolute filename for executable of the process
info proc mappings -- List of mapped memory regions
info proc stat -- List process info from /proc/PID/stat
info proc status -- List process info from /proc/PID/status
info program -- Execution status of the program
info record -- Info record options
info registers -- List of integer registers and their contents
info scope -- List the variables local to a scope
info selectors -- All Objective-C selectors
info set -- Show all GDB settings
info sharedlibrary -- Status of loaded shared object libraries

info signals -- What debugger does when program gets various signals
info skip -- Display the status of skips
info source -- Information about the current source file
info sources -- Source files in the program
info stack -- Backtrace of the stack
info static-tracepoint-markers -- List target static tracepoints markers
info symbol -- Describe what symbol is at location ADDR
info target -- Names of targets and files being debugged
info tasks -- Provide information about all known Ada tasks
info terminal -- Print inferior's saved terminal status
info threads -- Display currently known threads
info tracepoints -- Status of specified tracepoints (all tracepoints if no argument)
info tvariables -- Status of trace state variables and their values
info type-printers -- GDB command to list all registered type-printers
info types -- All type names
info variables -- All global and static variable names
info vector -- Print the status of the vector unit
info vtbl -- Show the virtual function table for a C++ object
info warranty -- Various kinds of warranty you do not have
info watchpoints -- Status of specified watchpoints (all watchpoints if no argument)
info win -- List of all displayed windows
macro -- Prefix for commands dealing with C preprocessor macros
macro define -- Define a new C/C++ preprocessor macro
macro expand -- Fully expand any C/C++ preprocessor macro invocations in EXPRESSION
macro expand-once -- Expand C/C++ preprocessor macro invocations appearing directly in EXPRESSION
macro list -- List all the macros defined using the `macro define' command
macro undef -- Remove the definition of the C/C++ preprocessor macro with the given name
show -- Generic command for showing things about the debugger
show ada -- Generic command for showing Ada-specific settings
show ada trust-PAD-over-XVS -- Show whether an optimization trusting PAD types over XVS types is activated
show agent -- Show debugger's willingness to use agent as a helper

show annotate -- Show annotation_level
show architecture -- Show architecture of target
show args -- Show argument list to give program being debugged when it is started
show auto-load -- Show auto-loading specific settings
show auto-load gdb-scripts -- Show whether auto-loading of canned sequences of commands scripts is enabled
show auto-load libthread-db -- Show whether auto-loading inferior specific libthread_db is enabled
show auto-load local-gdbinit -- Show whether auto-loading .gdbinit script in current directory is enabled
show auto-load python-scripts -- Show the debugger's behaviour regarding auto-loaded Python scripts
show auto-load safe-path -- Show the list of files and directories that are safe for auto-loading
show auto-load scripts-directory -- Show the list of directories from which to load auto-loaded scripts
show auto-load-scripts -- Show the debugger's behaviour regarding auto-loaded Python scripts
show auto-solib-add -- Show autoloading of shared library symbols
show backtrace -- Show backtrace specific variables
show backtrace limit -- Show the upper bound on the number of backtrace levels
show backtrace past-entry -- Show whether backtraces should continue past the entry point of a program
show backtrace past-main -- Show whether backtraces should continue past "main"
show basenames-may-differ -- Show whether a source file may have multiple base names
show breakpoint -- Breakpoint specific settings
show breakpoint always-inserted -- Show mode for inserting breakpoints
show breakpoint auto-hw -- Show automatic usage of hardware breakpoints
show breakpoint condition-evaluation -- Show mode of breakpoint condition evaluation
show breakpoint pending -- Show debugger's behavior regarding pending breakpoints
show build-id-core-loads -- Show whether CORE-FILE loads the build-id associated files automatically
show build-id-verbose -- Show debugging level of the build-id locator
show can-use-hw-watchpoints -- Show debugger's willingness to use watchpoint hardware
show case-sensitive -- Show case sensitivity in name search
show charset -- Show the host and target character sets
show check -- Show the status of the type/range checker
show check range -- Show range checking
show check type -- Show strict type checking
show circular-trace-buffer -- Show target's use of circular trace buffer

show coerce-float-to-double -- Show coercion of floats to doubles when calling functions
show commands -- Show the history of commands you typed
show complaints -- Show max number of complaints about incorrect symbols
show confirm -- Show whether to confirm potentially dangerous operations
show convenience -- Debugger convenience ("$foo") variables and functions
show copying -- Conditions for redistributing copies of GDB
show cp-abi -- Show the ABI used for inspecting C++ objects
show data-directory -- Show GDB's data directory
show dcache -- Show dcachesettings
show dcache line-size -- Show dcache line size
show dcache size -- Show number of dcache lines
show debug -- Generic command for showing gdb debugging flags
show debug arch -- Show architecture debugging
show debug auto-load -- Show auto-load verifications debugging
show debug check-physname -- Show cross-checking of "physname" code against demangler
show debug coff-pe-read -- Show coff PE read debugging
show debug displaced -- Show displaced stepping debugging
show debug dwarf2-die -- Show debugging of the dwarf2 DIE reader
show debug dwarf2-read -- Show debugging of the dwarf2 reader
show debug entry-values -- Show entry values and tail call frames debugging
show debug expression -- Show expression debugging
show debug frame -- Show frame debugging
show debug infrun -- Show inferior debugging
show debug jit -- Show JIT debugging
show debug libthread-db -- Show libthread-db debugging
show debug lin-lwp -- Show debugging of GNU/Linux lwp module
show debug notification -- Show debugging of async remote notification
show debug observer -- Show observer debugging
show debug overload -- Show debugging of C++ overloading
show debug parser -- Show parser debugging
show debug record -- Show debugging of record/replay feature

show debug remote -- Show debugging of remote protocol
show debug serial -- Show serial debugging
show debug stap-expression -- Show SystemTap expression debugging
show debug symtab-create -- Show debugging of symbol table creation
show debug target -- Show target debugging
show debug timestamp -- Show timestamping of debugging messages
show debug xml -- Show XML parser debugging
show debug-file-directory -- Show the directories where separate debug symbols are searched for
show debugvarobj -- Show varobj debugging
show default-collect -- Show the list of expressions to collect by default
show demangle-style -- Show the current C++ demangling style
show detach-on-fork -- Show whether gdb will detach the child of a fork
show directories -- Show the search path for finding source files
show disable-randomization -- Show disabling of debuggee's virtual address space randomization
show disassemble-next-line -- Show whether to disassemble next source line or insn when execution stops
show disassembly-flavor -- Show the disassembly flavor
show disconnected-dprintf -- Show whether dprintf continues after GDB disconnects
show disconnected-tracing -- Show whether tracing continues after GDB disconnects
show displaced-stepping -- Show debugger's willingness to use displaced stepping
show dprintf-channel -- Show the channel to use for dynamic printf
show dprintf-function -- Show the function to use for dynamic printf
show dprintf-style -- Show the style of usage for dynamic printf
show dump-excluded-mappings -- Show whether gcore should dump mappings marked with the VM_DONTDUMP flag
show editing -- Show editing of command lines as they are typed
show endian -- Show endianness of target
show environment -- The environment to give the program
show exec-direction -- Show direction of execution (forward/reverse)
show exec-done-display -- Show notification of completion for asynchronous execution commands
show exec-wrapper -- Show the wrapper for running programs
show extended-prompt -- Show the extended prompt
show extension-language -- Show mapping between filename extension and source language

show filename-display -- Show how to display filenames
show follow-exec-mode -- Show debugger response to a program call of exec
show follow-fork-mode -- Show debugger response to a program call of fork or vfork
show frame-filter -- Prefix command for 'show' frame-filter related operations
show frame-filter priority -- GDB command to show the priority of the specified frame-filter
show gnutarget -- Show the current BFD target
show height -- Show number of lines in a page for GDB output pagination
show history -- Generic command for showing command history parameters
show history expansion -- Show history expansion on command input
show history filename -- Show the filename in which to record the command history
show history save -- Show saving of the history record on exit
show history size -- Show the size of the command history
show host-charset -- Show the host character set
show inferior-tty -- Show terminal for future runs of program being debugged
show input-radix -- Show default input radix for entering numbers
show interactive-mode -- Show whether GDB's standard input is a terminal
show language -- Show the current source language
show libthread-db-search-path -- Show the current search path or libthread_db
show listsize -- Show number of source lines gdb will list by default
show logging -- Show logging options
show logging file -- Show the current logfile
show logging overwrite -- Show whether logging overwrites or appends to the log file
show logging redirect -- Show the logging output mode
show max-user-call-depth -- Show the max call depth for non-python user-defined commands
show may-insert-breakpoints -- Show permission to insert breakpoints in the target
show may-insert-fast-tracepoints -- Show permission to insert fast tracepoints in the target
show may-insert-tracepoints -- Show permission to insert tracepoints in the target
show may-interrupt -- Show permission to interrupt or signal the target
show may-write-memory -- Show permission to write into target memory
show may-write-registers -- Show permission to write into registers
show mem -- Memory regions settings

show mem  inaccessible-by-default -- Show handling of unknown memory regions
show multiple-symbols -- Show how the debugger handles ambiguities in expressions
show non-stop -- Show whether gdb controls the inferior in non-stop mode
show observer -- Show whether gdb controls the inferior in observer mode
show opaque-type-resolution -- Show resolution of opaque struct/class/union types (if set before loading symbols)
show osabi -- Show OS ABI of target
show output-radix -- Show default output radix for printing of values
show overload-resolution -- Show overload resolution in evaluating C++ functions
show pagination -- Show state of GDB output pagination
show paths -- Current search path for finding object files
show powerpc -- Various PowerPC-specific commands
show powerpc exact-watchpoints -- Show whether to use just one debug register for watchpoints on scalars
show powerpc soft-float -- Show whether to use a soft-float ABI
show powerpc vector-abi -- Show the vector ABI
show print -- Generic command for showing print settings
show print address -- Show printing of addresses
show print array -- Show prettyprinting of arrays
show print array-indexes -- Show printing of array indexes
show print asm-demangle -- Show demangling of C++/ObjC names in disassembly listings
show print demangle -- Show demangling of encoded C++/ObjC names when displaying symbols
show print elements -- Show limit on string chars or array elements to print
show print entry-values -- Show printing of function arguments at function entry
show print frame-arguments -- Show printing of non-scalar frame arguments
show print inferior-events -- Show printing of inferior events (e.g.
show print max-symbolic-offset -- Show the largest offset that will be printed in <symbol+1234> form
show print null-stop -- Show printing of char arrays to stop at first null char
show print object -- Show printing of object's derived type based on vtable info
show print pascal_static-members -- Show printing of pascal static members
show print pretty -- Show prettyprinting of structures
show print repeats -- Show threshold for repeated print elements
show print sevenbit-strings -- Show printing of 8-bit characters in strings as \nnn

show print static-members -- Show printing of C++ static members
show print symbol -- Show printing of symbol names when printing pointers
show print symbol-filename -- Show printing of source filename and line number with <symbol>
show print thread-events -- Show printing of thread events (such as thread start and exit)
show print type -- Generic command for showing type-printing settings
show print type methods -- Show printing of methods defined in classes
show print type typedefs -- Show printing of typedefs defined in classes
show print union -- Show printing of unions interior to structures
show print vtbl -- Show printing of C++ virtual function tables
show prompt -- Show gdb's prompt
show python -- Prefix command for python preference settings
show python print-stack -- Show the mode of Python stack printing on error
show radix -- Show the default input and output number radices
show ravenscar -- Prefix command for showing Ravenscar-specific settings
show ravenscar task-switching -- Show whether support for GNAT Ravenscar tasks is enabled
show record -- Show record options
show record full -- Show record options
show record full insn-number-max -- Show record/replay buffer limit
show record full memory-query -- Show whether query if PREC cannot record memory change of next instruction
show record full stop-at-limit -- Show whether record/replay stops when record/replay buffer becomes full
show record function-call-history-size -- Show number of functions to print in "record function-call-history"
show record instruction-history-size -- Show number of instructions to print in "record instruction-history"
show remote -- Remote protocol specific variables
show remote P-packet -- Show current use of remote protocol `P' (set-register) packet
show remote TracepointSource-packet -- Show current use of remote protocol `TracepointSource' (TracepointSource) packet
show remote X-packet -- Show current use of remote protocol `X' (binary-download) packet
show remote Z-packet -- Show use of remote protocol `Z' packets
show remote access-watchpoint-packet -- Show current use of remote protocol `Z4' (access-watchpoint) packet
show remote agent-packet -- Show current use of remote protocol `QAgent' (agent) packet
show remote allow-packet -- Show current use of remote protocol `QAllow' (allow) packet
show remote attach-packet -- Show current use of remote protocol `vAttach' (attach) packet

show remote binary-download-packet -- Show current use of remote protocol `X' (binary-download) packet
show remote breakpoint-commands-packet -- Show current use of remote protocol `BreakpointCommands' (breakpoint-commands) packet
show remote conditional-breakpoints-packet -- Show current use of remote protocol `ConditionalBreakpoints' (conditional-breakpoints) packet
show remote conditional-tracepoints-packet -- Show current use of remote protocol `ConditionalTracepoints' (conditional-tracepoints) packet
show remote disable-btrace-packet -- Show current use of remote protocol `Qbtrace:off' (disable-btrace) packet
show remote disable-randomization-packet -- Show current use of remote protocol `QDisableRandomization' (disable-randomization) packet
show remote enable-btrace-packet -- Show current use of remote protocol `Qbtrace:bts' (enable-btrace) packet
show remote exec-file -- Show the remote pathname for "run"
show remote fast-tracepoints-packet -- Show current use of remote protocol `FastTracepoints' (fast-tracepoints) packet
show remote fetch-register-packet -- Show current use of remote protocol `p' (fetch-register) packet
show remote get-thread-information-block-address-packet -- Show current use of remote protocol `qGetTIBAddr' (get-thread-information-block-address) packet
show remote get-thread-local-storage-address-packet -- Show current use of remote protocol `qGetTLSAddr' (get-thread-local-storage-address) packet
show remote hardware-breakpoint-limit -- Show the maximum number of target hardware breakpoints
show remote hardware-breakpoint-packet -- Show current use of remote protocol `Z1' (hardware-breakpoint) packet
show remote hardware-watchpoint-length-limit -- Show the maximum length (in bytes) of a target hardware watchpoint
show remote hardware-watchpoint-limit -- Show the maximum number of target hardware watchpoints
show remote hostio-close-packet -- Show current use of remote protocol `vFile:close' (hostio-close) packet
show remote hostio-open-packet -- Show current use of remote protocol `vFile:open' (hostio-open) packet
show remote hostio-pread-packet -- Show current use of remote protocol `vFile:pread' (hostio-pread) packet
show remote hostio-pwrite-packet -- Show current use of remote protocol `vFile:pwrite' (hostio-pwrite) packet
show remote hostio-readlink-packet -- Show current use of remote protocol `vFile:readlink' (hostio-readlink) packet
show remote hostio-unlink-packet -- Show current use of remote protocol `vFile:unlink' (hostio-unlink) packet
show remote hwbreak-feature-packet -- Show current use of remote protocol `hwbreak-feature' (hwbreak-feature) packet
show remote install-in-trace-packet -- Show current use of remote protocol `InstallInTrace' (install-in-trace) packet
show remote interrupt-on-connect --         Show whether interrupt-sequence is sent to remote target when gdb connects to

show remote interrupt-sequence -- Show interrupt sequence to remote target
show remote kill-packet -- Show current use of remote protocol `vKill' (kill) packet
show remote library-info-packet -- Show current use of remote protocol `qXfer:libraries:read' (library-info) packet
show remote library-info-svr4-packet -- Show current use of remote protocol `qXfer:libraries-svr4:read' (library-info-svr4) packet
show remote memory-map-packet -- Show current use of remote protocol `qXfer:memory-map:read' (memory-map) packet
show remote memory-read-packet-size -- Show the maximum number of bytes per memory-read packet
show remote memory-write-packet-size -- Show the maximum number of bytes per memory-write packet
show remote noack-packet -- Show current use of remote protocol `QStartNoAckMode' (noack) packet
show remote osdata-packet -- Show current use of remote protocol `qXfer:osdata:read' (osdata) packet
show remote p-packet -- Show current use of remote protocol `p' (fetch-register) packet
show remote pass-signals-packet -- Show current use of remote protocol `QPassSignals' (pass-signals) packet
show remote program-signals-packet -- Show current use of remote protocol `QProgramSignals' (program-signals) packet
show remote query-attached-packet -- Show current use of remote protocol `qAttached' (query-attached) packet
show remote read-aux-vector-packet -- Show current use of remote protocol `qXfer:auxv:read' (read-aux-vector) packet
show remote read-btrace-packet -- Show current use of remote protocol `qXfer:btrace' (read-btrace) packet
show remote read-fdpic-loadmap-packet -- Show current use of remote protocol `qXfer:fdpic:read' (read-fdpic-loadmap) packet
show remote read-sdata-object-packet -- Show current use of remote protocol `qXfer:statictrace:read' (read-sdata-object) packet
show remote read-siginfo-object-packet -- Show current use of remote protocol `qXfer:siginfo:read' (read-siginfo-object) packet
show remote read-spu-object-packet -- Show current use of remote protocol `qXfer:spu:read' (read-spu-object) packet
show remote read-watchpoint-packet -- Show current use of remote protocol `Z3' (read-watchpoint) packet
show remote reverse-continue-packet -- Show current use of remote protocol `bc' (reverse-continue) packet
show remote reverse-step-packet -- Show current use of remote protocol `bs' (reverse-step) packet
show remote run-packet -- Show current use of remote protocol `vRun' (run) packet
show remote search-memory-packet -- Show current use of remote protocol `qSearch:memory' (search-memory) packet
show remote set-register-packet -- Show current use of remote protocol `P' (set-register) packet
show remote software-breakpoint-packet -- Show current use of remote protocol `Z0' (software-breakpoint) packet
show remote static-tracepoints-packet -- Show current use of remote protocol `StaticTracepoints' (static-tracepoints) packet

show remote supported-packets-packet -- Show current use of remote protocol `qSupported' (supported-packets) packet
show remote symbol-lookup-packet -- Show current use of remote protocol `qSymbol' (symbol-lookup) packet
show remote system-call-allowed -- Show if the host system(3) call is allowed for the target
show remote target-features-packet -- Show current use of remote protocol `qXfer:features:read' (target-features) packet
show remote threads-packet -- Show current use of remote protocol `qXfer:threads:read' (threads) packet
show remote trace-buffer-size-packet -- Show current use of remote protocol `QTBuffer:size' (trace-buffer-size) packet
show remote traceframe-info-packet -- Show current use of remote protocol `qXfer:trace-frame-info:read' (traceframe-info) packet
show remote unwind-info-block-packet -- Show current use of remote protocol `qXfer:uib:read' (unwind-info-block) packet
show remote verbose-resume-packet -- Show current use of remote protocol `vCont' (verbose-resume) packet
show remote write-siginfo-object-packet -- Show current use of remote protocol `qXfer:siginfo:write' (write-siginfo-object) packet
show remote write-spu-object-packet -- Show current use of remote protocol `qXfer:spu:write' (write-spu-object) packet
show remote write-watchpoint-packet -- Show current use of remote protocol `Z2' (write-watchpoint) packet
show remoteaddresssize -- Show the maximum size of the address (in bits) in a memory packet
show remotebaud -- Show baud rate for remote serial I/O
show remotebreak -- Show whether to send break if interrupted
show remotecache -- Show cache use for remote targets
show remoteflow -- Show use of hardware flow control for remote serial I/O
show remotelogbase -- Show numerical base for remote session logging
show remotelogfile -- Show filename for remote session recording
show remotetimeout -- Show timeout limit to wait for target to respond
show remotewritesize -- Show the maximum number of bytes per memory write packet (deprecated)
show schedule-multiple -- Show mode for resuming threads of all processes
show scheduler-locking -- Show mode for locking scheduler during execution
show script-extension -- Show mode for script filename extension recognition
show serial -- Show default serial/parallel port configuration
show solib-absolute-prefix -- Show the current system root
show solib-search-path -- Show the search path for loading non-absolute shared library symbol files
show stack-cache -- Show cache use for stack access
show step-mode -- Show mode of the step operation

show stop-on-solib-events -- Show stopping for shared library events
show struct-convention -- Show the convention for returning small structs
show substitute-path -- Usage: show substitute-path [FROM]
show sysroot -- Show the current system root
show target-async -- Show whether gdb controls the inferior in asynchronous mode
show target-charset -- Show the target character set
show target-file-system-kind -- Show assumed file system kind for target reported file names
show target-wide-charset -- Show the target wide character set
show tcp -- TCP protocol specific variables
show tcp auto-retry -- Show auto-retry on socket connect
show tcp connect-timeout -- Show timeout limit for socket connection
show tdesc -- Show target description specific variables
show tdesc filename -- Show the file to read for an XML target description
show trace-buffer-size -- Show requested size of trace buffer
show trace-commands -- Show state of GDB CLI command tracing
show trace-notes -- Show the notes string to use for current and future trace runs
show trace-stop-notes -- Show the notes string to use for future tstop commands
show trace-user -- Show the user name to use for current and future trace runs
show trust-readonly-sections -- Show mode for reading from readonly sections
show tui -- TUI configuration variables
show tui active-border-mode -- Show the attribute mode to use for the active TUI window border
show tui border-kind -- Show the kind of border for TUI windows
show tui border-mode -- Show the attribute mode to use for the TUI window borders
show unwind-on-terminating-exception -- Show unwinding of stack if std::terminate() is called while in a call dummy
show unwindonsignal -- Show unwinding of stack if a signal is received while in a call dummy
show use-coredump-filter -- Show whether gcore should consider /proc/PID/coredump_filter
show use-deprecated-index-sections -- Show whether to use deprecated gdb_index sections
show user -- Show definitions of non-python user defined commands
show values -- Elements of value history around item number IDX (or last ten)
show verbose -- Show verbosity
show version -- Show what version of GDB this is

show warranty -- Various kinds of warranty you do not have
show watchdog -- Show watchdog timer
show width -- Show number of characters where GDB should wrap lines of its output
show write -- Show writing into executable and core files

Command class: support

! -- Execute the rest of the line as a shell command
add-auto-load-safe-path -- Add entries to the list of directories from which it is safe to auto-load files
add-auto-load-scripts-directory -- Add entries to the list of directories from which to load auto-loaded scripts
alias -- Define a new command that is an alias of an existing command
apropos -- Search for commands matching a REGEXP
define -- Define a new command name
document -- Document a user-defined command
dont-repeat -- Don't repeat this command
down-silently -- Same as the `down' command
echo -- Print a constant string
help -- Print list of commands
if -- Execute nested commands once IF the conditional expression is non zero
interpreter-exec -- Execute a command in an interpreter
make -- Run the ``make'' program using the rest of the line as arguments
overlay -- Commands for debugging overlays
overlay auto -- Enable automatic overlay debugging
overlay list-overlays -- List mappings of overlay sections
overlay load-target -- Read the overlay mapping state from the target
overlay manual -- Enable overlay debugging
overlay map-overlay -- Assert that an overlay section is mapped
overlay off -- Disable overlay debugging
overlay unmap-overlay -- Assert that an overlay section is unmapped
quit -- Exit gdb
shell -- Execute the rest of the line as a shell command

source -- Read commands from a file named FILE
up-silently -- Same as the `up' command
while -- Execute nested commands WHILE the conditional expression is non zero

Command class: tracepoints

actions -- Specify the actions to be taken at a tracepoint
collect -- Specify one or more data items to be collected at a tracepoint
end -- Ends a list of commands or actions
passcount -- Set the passcount for a tracepoint
save-tracepoints -- Save current tracepoint definitions as a script
tdump -- Print everything collected at the current tracepoint
teval -- Specify one or more expressions to be evaluated at a tracepoint
tfind -- Select a trace frame;
tfind end -- De-select any trace frame and resume 'live' debugging
tfind line -- Select a trace frame by source line
tfind none -- De-select any trace frame and resume 'live' debugging
tfind outside -- Select a trace frame whose PC is outside the given range (exclusive)
tfind pc -- Select a trace frame by PC
tfind range -- Select a trace frame whose PC is in the given range (inclusive)
tfind start -- Select the first trace frame in the trace buffer
tfind tracepoint -- Select a trace frame by tracepoint number
tsave -- Save the trace data to a file
tstart -- Start trace data collection
tstatus -- Display the status of the current trace data collection
tstop -- Stop trace data collection
tvariable -- Define a trace state variable
while-stepping -- Specify single-stepping behavior at a tracepoint

Command class: user-defined

Unclassified commands

add-inferior -- Add a new inferior
clone-inferior -- Clone inferior ID
eval -- Convert "printf format string"
function -- Placeholder command for showing help on convenience functions
function _memeq -- $_memeq - compare bytes of memory
function _regex -- $_regex - check if a string matches a regular expression
function _streq -- $_streq - check string equality
function _strlen -- $_strlen - compute string length
function caller_is -- Return True if the calling function's name is equal to a string
function caller_matches -- Return True if the calling function's name matches a string
function in_scope -- Return True if all the given variables or macros are in scope
jit-reader-load -- Load FILE as debug info reader and unwinder for JIT compiled code
jit-reader-unload -- Unload the currently loaded JIT debug info reader
pahole -- Show the holes in a structure
remove-inferiors -- Remove inferior ID (or list of IDs)
unset -- Complement to certain "set" commands
unset environment -- Cancel environment variable VAR for the program
unset exec-wrapper -- Disable use of an execution wrapper
unset substitute-path -- Usage: unset substitute-path [FROM]
unset tdesc -- Unset target description specific variables
unset tdesc filename -- Unset the file to read for an XML target description
参考:
https://sourceware.org/gdb/onlinedocs/gdb/
https://github.com/hellogcc/100-gdb-tips