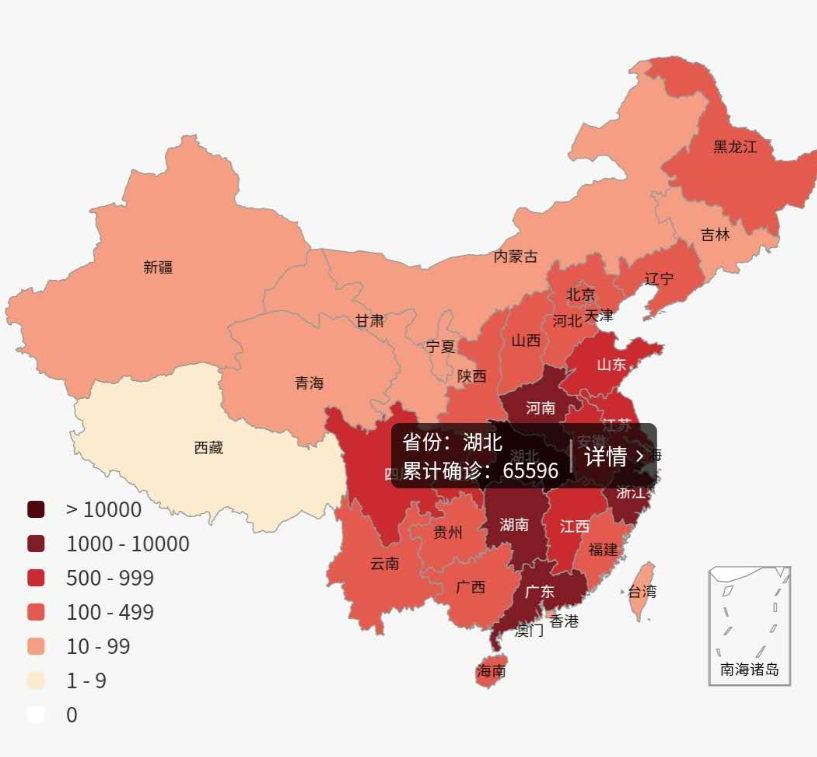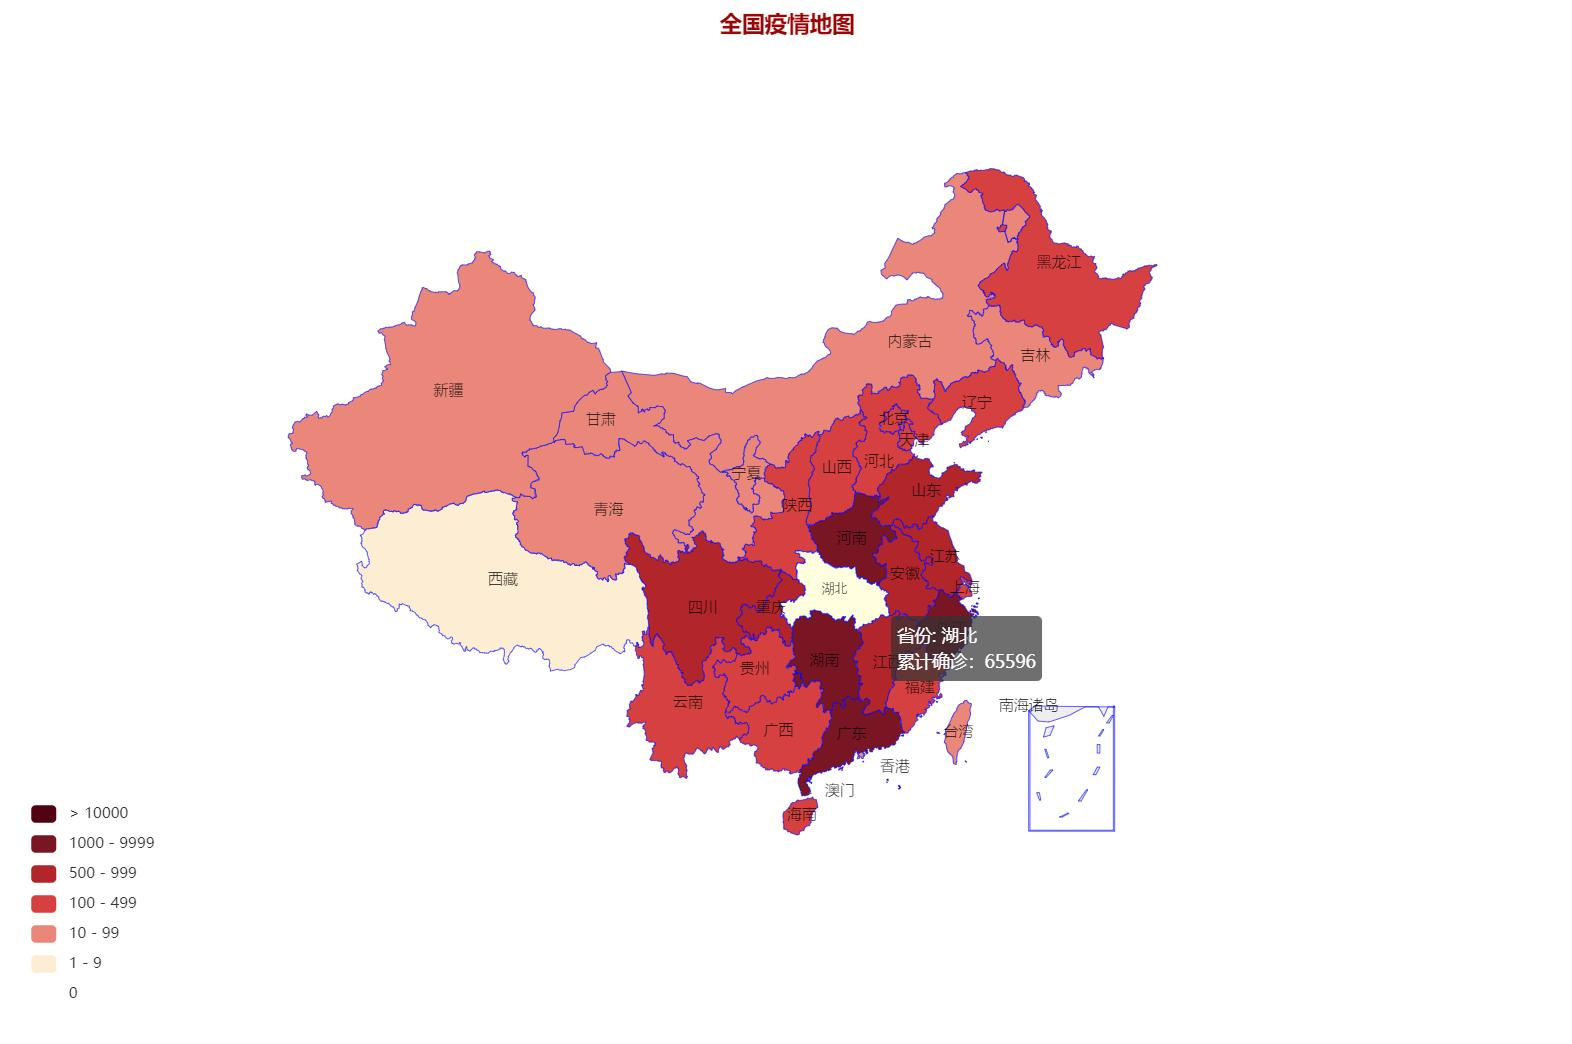
安装echart依赖
npm install echarts-for-react echarts
import React, { Component } from 'react';

import ReactEcharts from 'echarts-for-react';


import jsonp from "jsonp" // 接口jsonp实现跨域
// import 'echarts/map/js/china'; // 本来导出官网的中国地图,是可以实现的,但是地图省份字有点乱,说是按照省份位置。所以在网上找了一份
import "../../utils/china"


export default class Map extends Component {
  state = {
    mapData: []
  }
  getOption = () => {
    return {
      title: {
        text: "全国疫情地图",
        x: "center",
        textStyle: {
          color: "#9c0505"
        }
      },
      tooltip: { // 提示框
        trigger: "item",
        formatter: "省份: {b} <br/> 累计确诊:{c}" // a 系列名称 b 区域名称 c 合并数值
      },
      series: [
        {
          type: 'map',
          map: "china",
          data: this.state.mapData,
          label: {
            show: true,
            color: "black",
            fontStyle: 10,
            align: "center"
          },
          zoom: 1, // 当前缩放比例
          roam: true, // 是否支持拖拽
          itemStyle: {
            borderColor: "blue", // 区域边框线
          },
          emphasis: { // 高亮显示
            label: {
              color: "black",
              fontSize: 10
            },
            itemStyle: {
              areaColor: "lightyellow" // 区域高亮颜色
            }
          }
        },
      ],
      visualMap: {
        type: "piecewise",
        show: true,
        pieces: [
          { min: 10000 },
          { min: 1000, max: 9999 },
          { min: 500, max: 999 },
          { min: 100, max: 499 },
          { min: 10, max: 99 },
          { min: 1, max: 9 },
          { value: 0 }
        ],
        inRange: {
          color: ["#FFFFFF", "#FDEBCA", "#E25552", "#CA2B2D", "#831A26", "#500312"] // 颜色有个梯度变化,我吸取手机上
        }
      }
    }
  }
  getDate = () => {
    let self = this;
    jsonp("https://interface.sina.cn/news/wap/fymap2020_data.d.json?_=1580892522427", (err, data) => {
      var lists = data.data.list.map(item => {
        return {
          name: item.name,
          value: item.value
        }
      })
      self.setState({
        mapData: lists
      })
    })
  }
  componentDidMount() {
    this.getDate()
  }
  render() {
    return (
      <div style={{padding:30}}>
        <ReactEcharts option={this.getOption()} style={{ height: "800px" }}></ReactEcharts>
      </div>
    )
  }
}
