matplotlib篇 plot & scatter
# filename.py 获取当前文件名方法
import sys

# 当前文件名
print(sys.argv[0])

# 去除后缀后的文件名
print(sys.argv[0].split('.')[0])
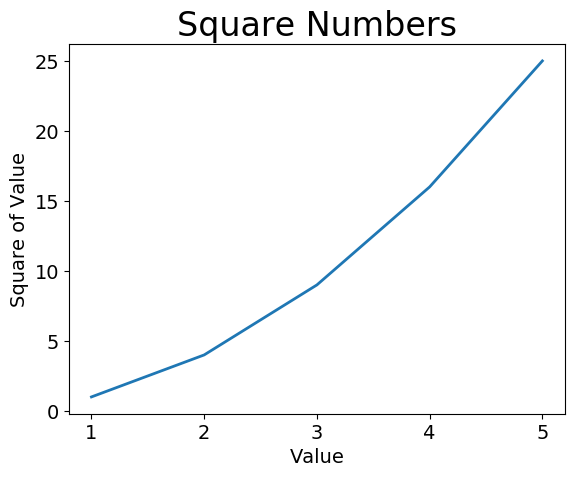
# mpl_squares.py 简单的平方折线图
import matplotlib.pyplot as plt
import sys

input_values = [x for x in range(1, 6)]
squares = [x ** 2 for x in range(1, 6)]

# 函数plot尝试根据数字绘制除有意义的图形
# linewidth参数设置线条宽度
plt.plot(input_values, squares, linewidth=2)

# 设置图标标题,并给坐标轴加上标签
plt.title('Square Numbers', fontsize=24)
plt.xlabel('Value', fontsize=14)
plt.ylabel('Square of Value', fontsize=14)

# 设置刻度标记的大小
plt.tick_params(axis='both', labelsize=14)

# 函数show打开matplotlib查看器,并显示出绘制的图形
# plt.show()

plt.savefig('images/' + sys.argv[0].split('.')[0] + '.png', bbox_inches='tight')

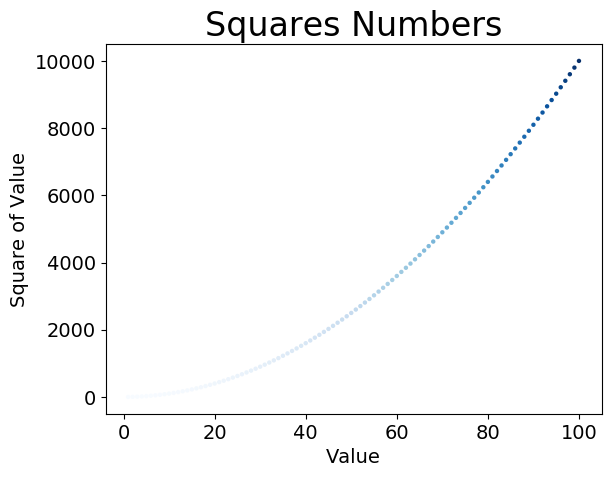
# scatter_squares.py 使用scatter绘制散点图并设置其样式

import matplotlib.pyplot as plt
import sys

x_values = [x for x in range(1, 101)]
y_values = [x ** 2 for x in range(1, 101)]

# edgecolor参数 -- 点轮廓
# c参数 -- 点颜色(接受RGB值(必须是三个0~1之间的小数值组成的元组)或'red'等) 值越接近0,指定的颜色越深,值越接近1,指定的颜色越浅。
# s参数 -- 点大小
#plt.scatter(x_values, y_values, edgecolor='none', s=10, c=(0.4, 0.4, 0))

# 将c参数设置为y列表,并使用参数cmap告诉pyplot使用哪个颜色映射(渐变)
plt.scatter(x_values, y_values, c=y_values, cmap=plt.cm.Blues, edgecolor='none', s=10)

# 设置图标标题并给坐标加上标签
plt.title('Squares Numbers', fontsize=24)
plt.xlabel('Value', fontsize=14)
plt.ylabel('Square of Value', fontsize=14)

# 设置刻度标记的大小
plt.tick_params(axis='both', which='major', labelsize=14)

# 自动保存图表
plt.savefig('images/' + sys.argv[0].split('.')[0] + '.png', bbox_inches='tight')
# 第一个实参指定要以什么样的文件名保存图表
# 第二个实参指定将图表多余的空白区域裁剪掉

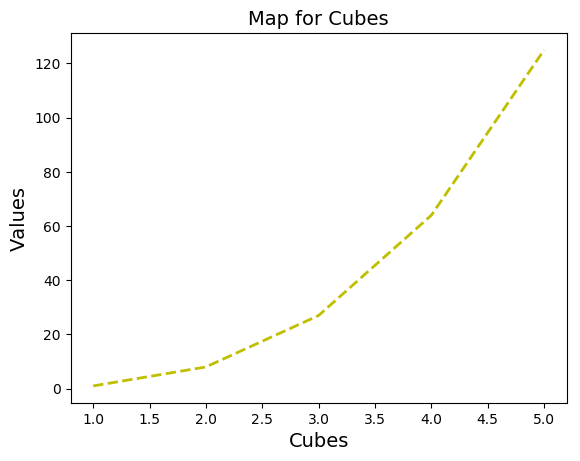
# mpl_cubes 立方折线图

import matplotlib.pyplot as plt
import sys

x_values = [x for x in range(1, 6)]
y_values = [y ** 3 for y in range(1, 6)]

plt.plot(x_values, y_values, color='y', linestyle='--', linewidth=2)

plt.xlabel('Cubes', fontsize=14)
plt.ylabel('Values', fontsize=14)
plt.title('Map for Cubes', fontsize=14)

plt.tick_params(axis='both', labelsize=10)

plt.savefig('images/' + sys.argv[0].split('.')[0] + '.png', bbox_inches='tight')

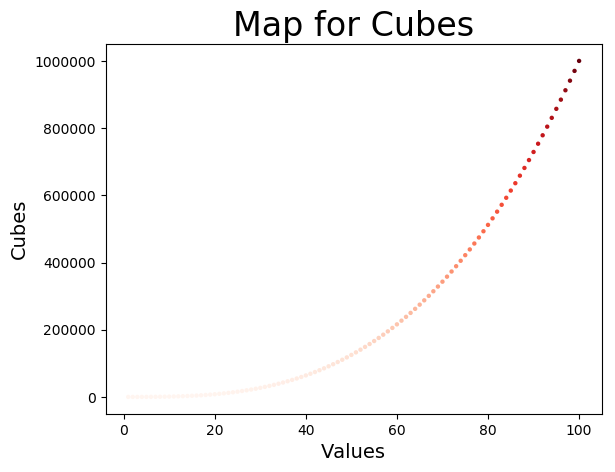
# scatter_cubes.py 立方散点图

import matplotlib.pyplot as plt
import sys

x_values = [x for x in range(1, 101)]
y_values = [y ** 3 for y in range(1, 101)]

plt.scatter(x_values, y_values, c=y_values, cmap=plt.cm.Reds, s=10, edgecolor='none')

plt.xlabel('Values', fontsize=14)
plt.ylabel('Cubes', fontsize=14)
plt.title('Map for Cubes', fontsize=24)

plt.tick_params(axis='both', labelsize=10)

plt.savefig('images/' + sys.argv[0].split('.')[0] + '.png', bbox_inches='tight')
