典型相关分析的基本思想 Canonical Correlation Analysis
(canonical correlation analysis)利用综合变量对之间的相关关系来反映两组指标之间的总体相关性的多元统计分析方法。它的基本原理是:为了从总体上把握两组指标之间的相关关系,分别在两组变量中提取有代表性的两个综合变量U1和V1(分别为两个变量组中各变量的线性组合),利用这两个综合变量之间的相关关系来反映两组指标之间的总体相关性。
Canonical Correlation Analysis典范相关分析/Canonical Correspondence Analysis典范相应分析
1936年,Hotelling提出典型相关分析。考虑两组变量的线性组合, 并研究它们之间的相关系数p(u,v).在全部的线性组合中, 找一对相关系数最大的线性组合, 用这个组合的单相关系数来表示两组变量的相关性, 叫做两组变量的典型相关系数, 而这两个线性组合叫做一对典型变量。在两组多变量的情形下, 须要用若干对典型变量才干全然反映出它们之间的相关性。下一步, 再在两组变量的与u1,v1不相关的线性组合中, 找一对相关系数最大的线性组合, 它就是第二对典型变量, 并且p(u2,v2)就是第二个典型相关系数。这样下去, 能够得到若干对典型变量, 从而提取出两组变量间的所有信息。
典型相关分析的实质就是在两组随机变量中选取若干个有代表性的综合指标(变量的线性组合), 用这些指标的相关关系来表示原来的两组变量的相关关系。这在两组变量的相关性分析中, 能够起到合理的简化变量的作用; 当典型相关系数足够大时, 能够像回归分析那样, 由- 组变量的数值预測还有一组变量的线性组合的数值。
典型关联分析(Canonical Correlation Analysis)
[pdf版本号] 典型相关分析.pdf
1. 问题
在线性回归中,我们使用直线来拟合样本点,寻找n维特征向量X和输出结果(或者叫做label)Y之间的线性关系。当中![]() ,
,![]() 。然而当Y也是多维时,或者说Y也有多个特征时,我们希望分析出X和Y的关系。
。然而当Y也是多维时,或者说Y也有多个特征时,我们希望分析出X和Y的关系。
当然我们仍然能够使用回归的方法来分析,做法例如以下:
这样做的一个缺点是,Y中的每一个特征都与X的全部特征关联,Y中的特征之间没有什么联系。
我们想换一种思路来看这个问题,假设将X和Y都看成总体,考察这两个总体之间的关系。我们将总体表示成X和Y各自特征间的线性组合,也就是考察![]() 和
和![]() 之间的关系。
之间的关系。
这种应用事实上非常多,举个简单的样例。我们想考察一个人解题能力X(解题速度![]() ,解题正确率
,解题正确率![]() )与他/她的阅读能力Y(阅读速度
)与他/她的阅读能力Y(阅读速度![]() ,理解程度
,理解程度![]() )之间的关系,那么形式化为:
)之间的关系,那么形式化为:
然后使用Pearson相关系数
来度量u和v的关系,我们期望寻求一组最优的解a和b,使得Corr(u, v)最大,这样得到的a和b就是使得u和v就有最大关联的权重。
到这里,基本上介绍了典型相关分析的目的。
2. CCA表示与求解
给定两组向量![]() 和
和![]() (替换之前的x为
(替换之前的x为![]() ,y为
,y为![]() ),
),![]() 维度为
维度为![]() ,
,![]() 维度为
维度为![]() ,默认
,默认![]() 。形式化表演示样例如以下:
。形式化表演示样例如以下:
![]() 是x的协方差矩阵;左上角是
是x的协方差矩阵;左上角是![]() 自己的协方差矩阵;右上角是
自己的协方差矩阵;右上角是![]() ;左下角是
;左下角是![]() ,也是
,也是![]() 的转置;右下角是
的转置;右下角是![]() 的协方差矩阵。
的协方差矩阵。
我们能够算出u和v的方差和协方差:
上面的结果事实上非常好算,推导一下第一个吧:
最后,我们须要算Corr(u,v)了
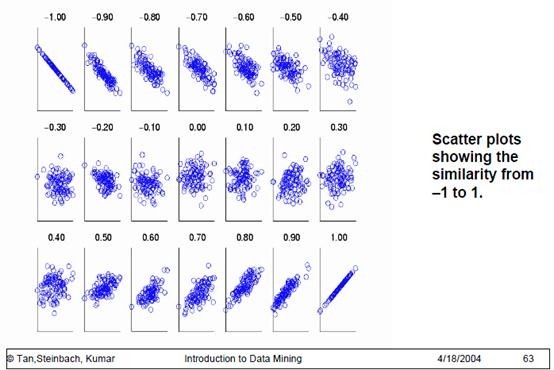
我们期望Corr(u,v)越大越好,关于Pearson相关系数,《数据挖掘导论》给出了一个非常好的图来说明:
横轴是u,纵轴是v,这里我们期望通过调整a和b使得u和v的关系越像最后一个图越好。事实上第一个图和最后一个图有联系的,我们能够调整a和b的符号,使得从第一个图变为最后一个。
接下来我们求解a和b。
回忆在LDA中,也得到了类似Corr(u,v)的公式,我们在求解时固定了分母,来求分子(避免a和b同一时候扩大n倍仍然符号解条件的情况出现)。这里我们相同这么做。
这个优化问题的条件是:
求解方法是构造Lagrangian等式,这里我简单推导例如以下:
求导,得
令导数为0后,得到方程组:
让我们把上面的方程组进一步简化,并写成矩阵形式,得到
写成矩阵形式
令
那么上式能够写作:
显然,又回到了求特征值的老路上了,仅仅要求得![]() 的最大特征值
的最大特征值![]() ,那么Corr(u,v)和a和b都能够求出。
,那么Corr(u,v)和a和b都能够求出。
在上面的推导过程中,我们如果了![]() 和
和![]() 均可逆。普通情况下都是可逆的,仅仅有存在特征间线性相关时会出现不可逆的情况,在本文最后会提到不可逆的处理办法。
均可逆。普通情况下都是可逆的,仅仅有存在特征间线性相关时会出现不可逆的情况,在本文最后会提到不可逆的处理办法。
再次审视一下,假设直接去计算![]() 的特征值,复杂度有点高。我们将第二个式子代入第一个,得
的特征值,复杂度有点高。我们将第二个式子代入第一个,得
待会举个样例说明求解过程。
如果依照上述过程,得到了![]() 最大时的
最大时的![]() 和
和![]() 。那么
。那么![]() 和
和![]() 称为典型变量(canonical
variates),
称为典型变量(canonical
variates),![]() 即是u和v的相关系数。
即是u和v的相关系数。
最后,我们得到u和v的等式为:
我们也能够接着去寻找第二组典型变量对,其最优化条件是
3. CCA计算样例
我们回到之前的评价一个人解题和其阅读能力的关系的样例。如果我们通过对样本计算协方差矩阵得到例如以下结果:
这里的A和前面的![]() 中的A不是一回事(这里符号有点乱,不好意思)。
中的A不是一回事(这里符号有点乱,不好意思)。
然后对A求特征值和特征向量,得到
然后求b,之前我们说的方法是依据![]() 求b,这里,我们也能够採用类似求a的方法来求b。
求b,这里,我们也能够採用类似求a的方法来求b。
回忆之前的等式
我们将上面的式子代入以下的,得
然后直接对![]() 求特征向量就可以,注意
求特征向量就可以,注意![]() 和
和![]() 的特征值同样,这个能够自己证明下。
的特征值同样,这个能够自己证明下。
无论使用哪种方法,
这里我们得到a和b的两组向量,到这还没完,我们须要让它们满足之前的约束条件
这里的![]() 应该是我们之前得到的VecA中的列向量的m倍,我们仅仅须要求得m,然后将VecA中的列向量乘以m就可以。
应该是我们之前得到的VecA中的列向量的m倍,我们仅仅须要求得m,然后将VecA中的列向量乘以m就可以。
因此最后的a和b为:
第一组典型变量为
相关系数
第二组典型变量为
相关系数
这里的![]() (解题速度),
(解题速度),![]() (解题正确率),
(解题正确率),![]() (阅读速度),
(阅读速度),![]() (阅读理解程度)。他们前面的系数意思不是特征对单个u或v的贡献比重,而是从u和v总体关系看,当两者关系最密切时,特征计算时的权重。
(阅读理解程度)。他们前面的系数意思不是特征对单个u或v的贡献比重,而是从u和v总体关系看,当两者关系最密切时,特征计算时的权重。
4. Kernel Canonical Correlation Analysis(KCCA)
通常当我们发现特征的线性组合效果不够好或者两组集合关系是非线性的时候,我们会尝试核函数方法,这里我们继续介绍Kernel CCA。
在《支持向量机-核函数》那一篇中,大致介绍了一下核函数,这里再简单提一下:
当我们对两个向量作内积的时候
我们能够定义
这样,仅通过计算x和y的内积的平方就能够达到在高维空间(这里为![]() )中计算
)中计算![]() 和
和![]() 内积的效果。
内积的效果。
由核函数,我们能够得到核矩阵K,当中
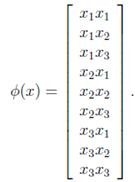
一个非常好的核函数定义:
当中例子x有n个特征,经过![]() 变换后,从n维特征上升到了N维特征,当中每个特征是
变换后,从n维特征上升到了N维特征,当中每个特征是![]() 。
。
回到CCA,我们在使用核函数之前
使用核函数后,u和v的公式为:
这里的c和d都是N维向量。
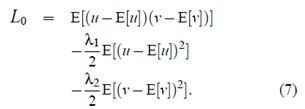
依据前面说过的相关系数,构造拉格朗日公式例如以下:
当中
然后让L对a求导,令导数等于0,得到(这一步我没有验证,待会从宏观上解释一下)
相同对b求导,令导数等于0,得到
求出c和d干嘛呢?c和d仅仅是![]() 的系数而已,依照原始的CCA做法去做即可了呗,为了再引入
的系数而已,依照原始的CCA做法去做即可了呗,为了再引入![]() 和
和![]() ?
?
回答这个问题要从核函数的意义上来说明。核函数初衷是希望在式子中有![]() ,然后用K替换之,根本没有打算去计算出实际的
,然后用K替换之,根本没有打算去计算出实际的![]() 。因此即是依照原始CCA的方式计算出了c和d,也是无用的,由于根本有没有实际的
。因此即是依照原始CCA的方式计算出了c和d,也是无用的,由于根本有没有实际的![]() 让我们去做
让我们去做![]() 。还有一个原因是核函数比方高斯径向基核函数能够上升到无限维,N是无穷的,因此c和d也是无穷维的,根本没办法直接计算出来。我们的思路是在原始的空间中构造出权重
。还有一个原因是核函数比方高斯径向基核函数能够上升到无限维,N是无穷的,因此c和d也是无穷维的,根本没办法直接计算出来。我们的思路是在原始的空间中构造出权重![]() 和
和![]() ,然后利用
,然后利用![]() 将
将![]() 和
和![]() 上升到高维,他们在高维相应的权重就是c和d。
上升到高维,他们在高维相应的权重就是c和d。
尽管![]() 和
和![]() 是在原始空间中(维度为例子个数M),但其作用点不是在原始特征上,而是原始例子上。看上面得出的c和d的公式就知道。
是在原始空间中(维度为例子个数M),但其作用点不是在原始特征上,而是原始例子上。看上面得出的c和d的公式就知道。![]() 通过控制每一个高维例子的权重,来控制c。
通过控制每一个高维例子的权重,来控制c。
![]() 表示能够将第i个例子上升到的N维向量,
表示能够将第i个例子上升到的N维向量,![]() 意义能够类比原始CCA的x。
意义能够类比原始CCA的x。
鉴于这样表示接下来会越来越复杂,改用矩阵形式表示。
简写为
当中X(M×N)为
我们发现
我们能够算出u和v的方差和协方差(这里实际上事先对样本![]() 和
和![]() 做了均值归0处理):
做了均值归0处理):
最后,我们得到Corr(u,v)
能够看到,在将![]() 和
和![]() 处理成
处理成![]() ,
,![]() 后,得到的结果和之前形式基本一样,仅仅是将
后,得到的结果和之前形式基本一样,仅仅是将![]() 替换成了两个K乘积。
替换成了两个K乘积。
因此,得到的结果也是一样的,之前是
当中
引入核函数后,得到
当中
注意这里的两个w有点差别,前面的![]() 维度和x的特征数同样,
维度和x的特征数同样,![]() 维度和y的特征数同样。后面的
维度和y的特征数同样。后面的![]() 维度和x的例子数同样,
维度和x的例子数同样,![]() 维度和y的例子数同样,严格来说“
维度和y的例子数同样,严格来说“![]() 维度=
维度=![]() 维度”。
维度”。
5. 其它话题
1、当协方差矩阵不可逆时,怎么办?
要进行regularization。
一种方法是将前面的KCCA中的拉格朗日等式加上二次正则化项,即:
这样求导后得到的等式中,等式右边的矩阵一定是正定矩阵。
另外一种方法是在Pearson系数的分母上增加正则化项,相同结果也一定可逆。
2、求Kernel矩阵效率不高怎么办?
使用Cholesky decomposition压缩法或者部分Gram-Schmidt正交化法,。
3、怎么使用CCA用来做预測?


4、假设有多个集合怎么办?X、Y、Z…?怎么衡量多个样本集的关系?
这个称为Generalization of the Canonical Correlation。方法是使得两两集合的距离差之和最小。能够參考文献2。
6. 參考文献
1、 http://www.stat.tamu.edu/~rrhocking/stat636/LEC-9.636.pdf
2、 Canonical correlation analysis: An overview with application to learning methods. David R. Hardoon , Sandor Szedmak and John Shawe-Taylor
3、 A kernel method for canonical correlation analysis. Shotaro Akaho
4、 Canonical Correlation a Tutorial. Magnus Borga
5、 Kernel Canonical Correlation Analysis. Max Welling
In
statistics,
canonical correlation analysis, introduced by
Harold Hotelling, is a way of making sense of
cross-covariance matrices. If we have two sets of variables,
 and
and
 , and there are correlations among the variables, then canonical correlation analysis will enable us to find linear
combinations of the
  's and the
 's which have maximum correlation with each other.
Contents[hide] |
[edit] Definition
Given two
column vectors
 and
and
 of
random variables
with
finite
second moments, one may define the
cross-covariance
 to be the
 matrix
whose
  entry is the
covariance
 . In practice, we would estimate the covariance
matrix based on sampled data from
  and
and
 (i.e. from a pair of data matrices).
Canonical correlation analysis seeks vectors
 and
and
 such that the random variables
 and
and
 maximize the
correlation
 . The random variables
 and
and
 are the
first pair of canonical variables. Then one seeks vectors maximizing the same correlation subject to the constraint that they are to be uncorrelated with the first pair of canonical variables; this gives the
second pair of canonical variables. This procedure may be continued up to
 times.
[edit] Computation
[edit] Proof
Let  and
and
 . The parameter to maximize is
The first step is to define a change of basis and define
And thus we have
By the Cauchy-Schwarz inequality, we have
There is equality if the vectors
 and
and
 are collinear. In addition, the maximum of correlation is attained if
 is the
eigenvector
with the maximum eigenvalue for the matrix
 (see
Rayleigh quotient). The subsequent pairs are found by using
eigenvalues
of decreasing magnitudes. Orthogonality is guaranteed by the symmetry of the correlation matrices.
[edit] Solution
The solution is therefore:
 is an eigenvector of

 is proportional to

Reciprocally, there is also:
 is an eigenvector of

 is proportional to

Reversing the change of coordinates, we have that
 is an eigenvector of

 is an eigenvector of

 is proportional to

 is proportional to

The canonical variables are defined by:
[edit] Hypothesis testing
Each row can be tested for significance with the following method. Since the correlations are sorted, saying that row
 is zero implies all further correlations are also zero. If we have
 independent observations in a sample and
 is the estimated correlation for
 . For the
 th row, the test statistic is:
which is asymptotically distributed as a
chi-squared
with  degrees of freedom
for large
  .[1]
Since all the correlations from
  to
to
 are logically zero (and estimated that way also) the product for the terms after this point is irrelevant.
[edit] Practical uses
A typical use for canonical correlation in the experimental context is to take two sets of variables and see what is common amongst the two sets. For example in psychological testing, you could take two well established multidimensional personality tests such as the Minnesota Multiphasic Personality Inventory (MMPI) and the NEO. By seeing how the MMPI factors relate to the NEO factors, you could gain insight into what dimensions were common between the tests and how much variance was shared. For example you might find that an extraversion or neuroticism dimension accounted for a substantial amount of shared variance between the two tests.
One can also use canonical correlation analysis to produce a model equation which relates two sets of variables, for example a set of performance measures and a set of explanatory variables, or a set of outputs and set of inputs. Constraint restrictions can be imposed on such a model to ensure it reflects theoretical requirements or intuitively obvious conditions. This type of model is known as a maximum correlation model.[2]
Visualization of the results of canonical correlation is usually through bar plots of the coefficients of the two sets of variables for the pairs of canonical variates showing significant correlation. Some authors suggest that they are best visualized by plotting them as heliographs, a circular format with ray like bars, with each half representing the two sets of variables.[3]
[edit] Connection to principal angles
Assuming that  and
and
 have zero
expected values, i.e.,
 , their
covariance
matrices
 ![典型相关分析CCA Sigma _{XX} =operatorname{Cov}(X,X) = operatorname{E}[X X']](http://upload.wikimedia.org/wikipedia/en/math/e/e/a/eeaa1bc71e861096ef61c2366b41b4d5.png) and
and
![典型相关分析CCA Sigma _{YY} =operatorname{Cov}(Y,Y) = operatorname{E}[Y Y']](http://upload.wikimedia.org/wikipedia/en/math/8/8/9/8891713be71187c704d1641af5bd5676.png) can be viewed as
Gram matrices
in an
inner product, see
Covariance#Relationship_to_inner_products, for the columns of
can be viewed as
Gram matrices
in an
inner product, see
Covariance#Relationship_to_inner_products, for the columns of
 and
and
 , correspondingly. The definition of the canonical variables
 and
and
 is equivalent to the definition of
principal vectors
for the pair of subspaces spanned by the columns of
 and
and
 with respect to this
inner product. The canonical correlations
 is equal to the
cosine
of
principal angles.
[edit] See also
Canonical Correlation Analysis
Canonical correlation analysis (CCA) is a way of measuring the linear relationship between two multidimensional variables. It finds two bases, one for each variable, that are optimal with respect to correlations
and, at the same time, it finds the corresponding correlations. In other words, it finds the two bases in which the correlation matrix between the variables is diagonal and the correlations on the diagonal are maximized. The dimensionality of these new bases
is equal to or less than the smallest dimensionality of the two variables.
For more information on CCA, please read my on-line tutorial (or the PDF version).
Matlab functions
-
cca.m CCA
-
ccabss.m Blind Source Separation based on CCA. For reference, see A Canonical Correlation Approach to Exploratory Data Analysis in fMRI.
Please email your comments to me.
Canonical Correspondence Analysis
Description
Performs a Canonical Correspondence Analysis.
Usage
cca(sitspe, sitenv, scannf = TRUE, nf = 2)
Arguments
sitspe |
a data frame for correspondence analysis, typically a sites x species table |
sitenv |
a data frame containing variables, typically a sites x environmental variables table |
scannf |
a logical value indicating whether the eigenvalues bar plot should be displayed |
nf |
if scannf FALSE, an integer indicating the number of kept axes |
Value
returns an object of class
pcaiv. See pcaiv
Author(s)
Daniel Chessel
Anne B Dufour dufour@biomserv.univ-lyon1.fr
References
Ter Braak, C. J. F. (1986) Canonical correspondence analysis : a new eigenvector technique for multivariate direct gradient analysis.
Ecology, 67, 1167–1179.
Ter Braak, C. J. F. (1987) The analysis of vegetation-environment relationships by canonical correspondence analysis.
Vegetatio, 69, 69–77.
Chessel, D., Lebreton J. D. and Yoccoz N. (1987) Propriétés de l'analyse canonique des correspondances. Une utilisation en hydrobiologie.
Revue de Statistique Appliquée, 35, 55–72.
See Also
cca
in the package
vegan
Examples
data(rpjdl) millog <- log(rpjdl$mil + 1) iv1 <- cca(rpjdl$fau, millog, scan = FALSE) plot(iv1) # analysis with c1 - as - li -ls # projections of inertia axes on PCAIV axes s.corcircle(iv1$as) # Species positions s.label(iv1$c1, 2, 1, clab = 0.5, xlim = c(-4,4)) # Sites positions at the weighted mean of present species s.label(iv1$ls, 2, 1, clab = 0, cpoi = 1, add.p = TRUE) # Prediction of the positions by regression on environmental variables s.match(iv1$ls, iv1$li, 2, 1, clab = 0.5) # analysis with fa - l1 - co -cor # canonical weights giving unit variance combinations s.arrow(iv1$fa) # sites position by environmental variables combinations # position of species by averaging s.label(iv1$l1, 2, 1, clab = 0, cpoi = 1.5) s.label(iv1$co, 2, 1, add.plot = TRUE) s.distri(iv1$l1, rpjdl$fau, 2, 1, cell = 0, csta = 0.33) s.label(iv1$co, 2, 1, clab = 0.75, add.plot = TRUE) # coherence between weights and correlations par(mfrow = c(1,2)) s.corcircle(iv1$cor, 2, 1) s.arrow(iv1$fa, 2, 1) par(mfrow = c(1,1))
Worked out examples
> library(ade4) > ### Name: cca > ### Title: Canonical Correspondence Analysis > ### Aliases: cca > ### Keywords: multivariate > > ### ** Examples > > data(rpjdl) > millog <- log(rpjdl$mil + 1) > iv1 <- cca(rpjdl$fau, millog, scan = FALSE) > plot(iv1)

> > # analysis with c1 - as - li -ls > # projections of inertia axes on PCAIV axes > s.corcircle(iv1$as)

> > # Species positions > s.label(iv1$c1, 2, 1, clab = 0.5, xlim = c(-4,4)) > # Sites positions at the weighted mean of present species > s.label(iv1$ls, 2, 1, clab = 0, cpoi = 1, add.p = TRUE)

> > # Prediction of the positions by regression on environmental variables > s.match(iv1$ls, iv1$li, 2, 1, clab = 0.5)

> > # analysis with fa - l1 - co -cor > # canonical weights giving unit variance combinations > s.arrow(iv1$fa)

> > # sites position by environmental variables combinations > # position of species by averaging > s.label(iv1$l1, 2, 1, clab = 0, cpoi = 1.5)

> s.label(iv1$co, 2, 1, add.plot = TRUE)

> > s.distri(iv1$l1, rpjdl$fau, 2, 1, cell = 0, csta = 0.33)

> s.label(iv1$co, 2, 1, clab = 0.75, add.plot = TRUE)

> > # coherence between weights and correlations > par(mfrow = c(1,2)) > s.corcircle(iv1$cor, 2, 1)

> s.arrow(iv1$fa, 2, 1)

> par(mfrow = c(1,1))
(一)CCA方法简单介绍:http://www.sciencenet.cn/blog/user_content.aspx?id=27852 典范相应分析(CCA) (一)CCA方法简单介绍: 典范相应分析(canonical correspondence analusis, CCA),是基于相应分析发展而来的一种排序方法,将相应分析与多元回归分析相结合,每一步计算均与环境因子进行回归,又称多元直接梯度分析。其基本思路是在相应分析的迭代过程中,每次得到的样方排序坐标值均与环境因子进行多元线性回归。CCA要求两个数据矩阵,一个是植被数据矩阵,一个是环境数据矩阵。 首先计算出一组样方排序值和种类排序值(同相应分析),然后将样方排序值与环境因子用回归分析方法结合起来,这样得到的样方排序值即反映了样方种类组成及生态重要值对群落的作用,同一时候也反映了环境因子的影响,再用样方排序值加权平均求种类排序值,使种类排序坐标值值也简单介绍地与环境因子相联系。其算法可由Canoco软件高速实现。 最大长处:CCA是一种基于单峰模型的排序方法,样方排序与对象排序相应分析,并且在排序过程中结合多个环境因子,因此能够把样方、对象与环境因子的排序结果表示在同一排序图上。 缺点:存在“弓形效应”。克服弓形效应能够採用除趋势典范相应分析(detrended canonical correspondence, DCCA). 结果可信性:查看累计贡献率及环境与研究对象前两个排序轴之间的相关性。 (二)CCA排序图解释 箭头表示环境因子,箭头所处的象限表示环境因子与排序轴之间的正负相关性,箭头连线的长度代表着某个环境因子与研究对象分布相关程度的大小,连线越长,代表这个环境因子对研究对象的分布影响越大。箭头连线与排序轴的家教代表这某个环境因子与排序轴的相关性大小,夹角越小,相关性越高。 (三)关键问题: (1)RDA或CCA的选择问题:RDA是基于线性模型,CCA是基于单峰模型。一般我们会选择CCA来做直接梯度分析。可是假设CCA排序的效果不太好,就能够考虑是不是用RDA分析。RDA或CCA选择原则:先用species-sample资料做DCA分析,看分析结果中Lengths of gradient 的第一轴的大小,假设大于4.0,就应该选CCA,假设3.0-4.0之间,选RDA和CCA均可,假设小于3.0, RDA的结果要好于CCA。 (2)计算单个环境因子的贡献率:CCA分析里面所得到的累计贡献率是全部环境因子的贡献率,怎么得到每一个环境因子的贡献率:生成三个矩阵,第一个是物种样方矩阵,第二个是目标环境因子矩阵,第三个是剔除目标环境因子矩阵后的环境因子矩阵。分别输入Canoco软件中,这样CCA分析得到的特征根贡献率即是单个目标环境因子的贡献率。 典范相应分析(canonical correspondence analusis, CCA),是基于相应分析发展而来的一种排序方法,将相应分析与多元回归分析相结合,每一步计算均与环境因子进行回归,又称多元直接梯度分析。其基本思路是在相应分析的迭代过程中,每次得到的样方排序坐标值均与环境因子进行多元线性回归。CCA要求两个数据矩阵,一个是植被数据矩阵,一个是环境数据矩阵。首先计算出一组样方排序值和种类排序值(同相应分析),然后将样方排序值与环境因子用回归分析方法结合起来,这样得到的样方排序值即反映了样方种类组成及生态重要值对群落的作用,同一时候也反映了环境因子的影响,再用样方排序值加权平均求种类排序值,使种类排序坐标值值也简单介绍地与环境因子相联系。其算法可由Canoco软件高速实现。 最大长处:CCA是一种基于单峰模型的排序方法,样方排序与对象排序相应分析,并且在排序过程中结合多个环境因子,因此能够把样方、对象与环境因子的排序结果表示在同一排序图上。 缺点:存在“弓形效应”。克服弓形效应能够採用除趋势典范相应分析(detrended canonical correspondence, DCCA). 结果可信性:查看累计贡献率及环境与研究对象前两个排序轴之间的相关性。 (二)CCA排序图解释:箭头表示环境因子,箭头所处的象限表示环境因子与排序轴之间的正负相关性,箭头连线的长度代表着某个环境因子与研究对象分布相关程度的大小,连线越长,代表这个环境因子对研究对象的分布影响越大。箭头连线与排序轴的家教代表这某个环境因子与排序轴的相关性大小,夹角越小,相关性越高。 (三)关键问题: (1)RDA或CCA的选择问题:RDA是基于线性模型,CCA是基于单峰模型。一般我们会选择CCA来做直接梯度分析。可是假设CCA排序的效果不太好,就能够考虑是不是用RDA分析。RDA或CCA选择原则:先用species-sample资料做DCA分析,看分析结果中Lengths of gradient 的第一轴的大小,假设大于4.0,就应该选CCA,假设3.0-4.0之间,选RDA和CCA均可,假设小于3.0, RDA的结果要好于CCA。 (2)计算单个环境因子的贡献率:CCA分析里面所得到的累计贡献率是全部环境因子的贡献率,怎么得到每一个环境因子的贡献率:生成三个矩阵,第一个是物种样方矩阵,第二个是目标环境因子矩阵,第三个是剔除目标环境因子矩阵后的环境因子矩阵。分别输入Canoco软件中,这样CCA分析得到的特征根贡献率即是单个目标环境因子的贡献率。 參考书目: 张金屯 数量生态学 科学出版社 2004 Jan Leps & Peter Smilauer. Multivariate analysis of ecological data using CANOCO. Cambridge University Press. 2003 本文引用地址:
典型相关分析 Canonical Correlation Analysis(CCA)
- 两个随机变量Y与X
简单相关系数 - 一个随机变量Y与一组随机变量X1,X2……,Xp
多重相关(复相关系数) - 一组随机变量Y1,Y2,……,Yq与还有一组随机变量X1,X2,……,Xp
典型相关系数
典型相关是研究两组变量之间相关性的一种统计分析方法。也是一种降维技术。


简单相关系数描写叙述两组变量的相关关系的缺点:
- 仅仅是孤立考虑单个X与单个Y间的相关,没有考虑X,Y变量组内部各变量间的相关。
- 两组间有很多简单相关系数(实例为30个),使问题显得复杂,难以从总体描写叙述。(复相关系数也如此)


