背景:
1)数据可视化
目前还处于python入门阶段,主要想通过numpy、matplotlib进行数据可视化。
安装:
操作系统:windows7
1)python2.7 安装numpy、matplotlib
pip安装numpy没有问题
pip通过tar安装matplotlib不成功,提示缺少freetype、png,反正挺麻烦的。
2)python3.5安装numpy、matplotlib
pip直接搞定,安装matplotlib的时候会安装关联的模块。
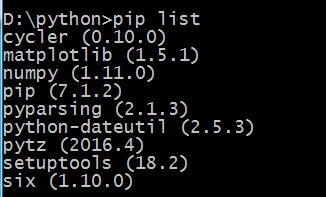
安装numpy和matplotlib后,pip list展示安装了哪些模块。
使用:
网上随便找了个例子,如下:
import numpy as np
import matplotlib.pyplot as plt

N = 5
menMeans = (20, 35, 30, 35, 27)
menStd =   (2, 3, 4, 1, 2)

ind = np.arange(N)  # the x locations for the groups
width = 0.35       # the width of the bars

fig, ax = plt.subplots()
rects1 = ax.bar(ind, menMeans, width, color='r', yerr=menStd)

womenMeans = (25, 32, 34, 20, 25)
womenStd =   (3, 5, 2, 3, 3)
rects2 = ax.bar(ind+width, womenMeans, width, color='y', yerr=womenStd)

# add some
ax.set_ylabel('Scores')
ax.set_title('Scores by group and gender')
ax.set_xticks(ind+width)
ax.set_xticklabels( ('G1', 'G2', 'G3', 'G4', 'G5') )

ax.legend( (rects1[0], rects2[0]), ('Men', 'Women') )

def autolabel(rects):
    # attach some text labels
    for rect in rects:
        height = rect.get_height()
        ax.text(rect.get_x()+rect.get_width()/2., 1.05*height, '%d'%int(height),
                ha='center', va='bottom')

autolabel(rects1)
autolabel(rects2)

plt.show()
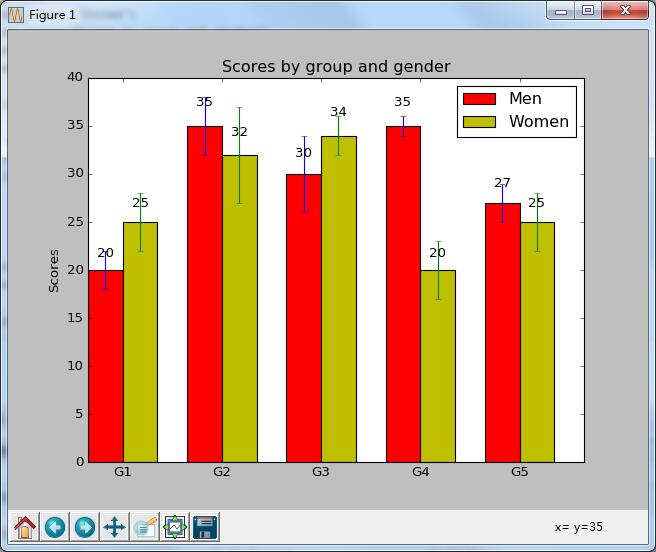
运行图:
----------------------------------------------------