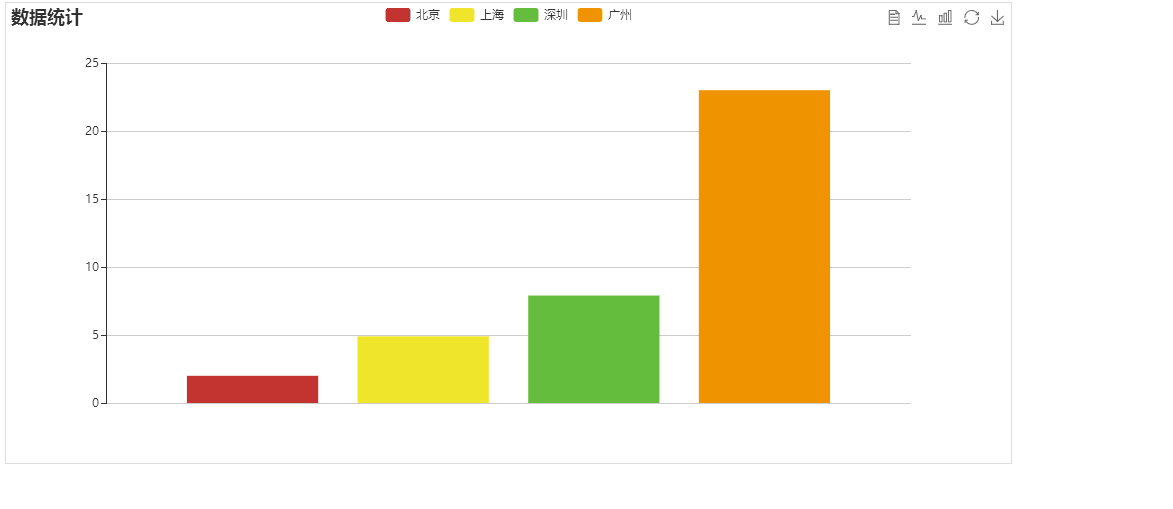
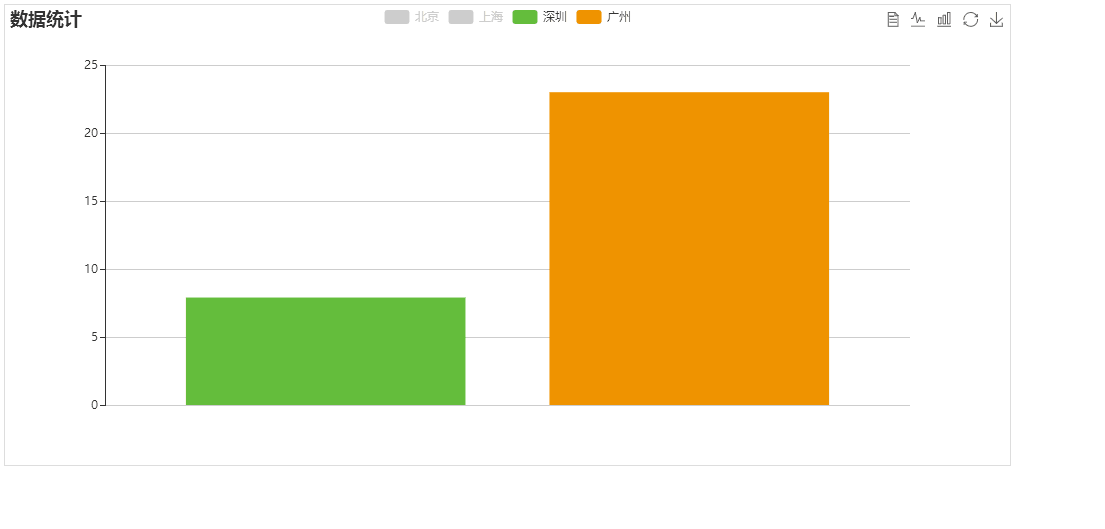
• echarts柱状图每个柱子显示不同颜色,并且能够实现点击每种颜色影藏对应柱子的功能


    ---------------------------------------------------------代码区---------------------------------------------------------------

    <!DOCTYPE html>
    <html>
      <head>
      <base href="<%=basePath%>">
      <title>测试</title>
      
      <meta http-equiv="pragma" content="no-cache">
      <meta http-equiv="cache-control" content="no-cache">
      <meta http-equiv="expires" content="0">  
      <meta http-equiv="keywords" content="keyword1,keyword2,keyword3">
      <meta http-equiv="description" content="This is my page">
      <link rel="stylesheet" href="admin/css/bootstrap.min.css">
      
      
    </head>

    <body>
        <section class="hj-second-page-section">
          <div class="container-fluid">
            <div class="rows">
              <div class="col-xs-12 col-sm-12 col-md-12 col-lg-12">
                <div class="rows">
                  <div class="col-xs-12 col-sm-12 col-md-12 col-lg-12 hj-jumbotron-div">
                    <div class="panel panel-primary ng-scope">
                    
                     <!-- pannel start -->
                     <div class="panel-body vc-pannel-body-toggle">
                         <div class="rows ng-scope">
                           <div class="panel-body vc-msg-panel-body">
                             <div class="row">
                              
                              <div class="col-xs-12 col-sm-12 col-md-6 col-lg-6">
                                 <div id="rt_chart1" style=""></div>
                              </div>
                              
                             </div>
                          </div>
                         </div>
                         
                     </div>
                    
                     <!-- pannel end -->
                    </div>
                  </div>
                </div>
              </div>
            </div>
          </div>
        </section>
          
        
        <script src="echarts.js"></script>
        <script src="jquery-2.2.3.min.js"></script>
        
        <script>
          /**
           * @description 绘制柱状图
           * @author luohan
           * @date 2017-7-28
           * @param
           */
          function initChart1() {
            $("#rt_chart1").height(460);
            $("#rt_chart1").width(1005);
            $("#rt_chart1").css("border","1px solid #ddd");
            var myChart1 = echarts.init(document.getElementById("rt_chart1"));

            var option1 = {
              title : {
                text: '数据统计',
                subtext: ''
              },
              tooltip : {
                trigger: 'axis'
              },
              legend: {
                data:['北京','上海','深圳','广州']
              },
              toolbox: {
                show : true,
                feature : {
                  mark : {show: true},
                  dataView : {show: true, readOnly: false},
                  magicType : {show: true, type: ['line', 'bar']},
                  restore : {show: true},
                  saveAsImage : {show: true}
                }
              },
              calculable : true,
              xAxis : [
                {
                  type : 'category',
                  show:false,
                  data : ['横坐标自定义']
                }
              ],
              yAxis : [
                {
                  type : 'value'
                  
                }
              ],
              series : [
                {
                  name:'北京',
                  type:'bar',
                  itemStyle: {
                    normal: {
                      color: function(params) {
                        //首先定义一个数组
                        var colorList = [
                          '#C33531'
                        ];
                        return colorList[params.dataIndex]
                      },
                      //以下为是否显示
                      label: {
                        show: false
                      }
                    }
                  },
                  data:[2.0],
                },
                {
                  name:'上海',
                  type:'bar',
                  itemStyle: {
                    normal: {
                      color: function(params) {
                        //首先定义一个数组
                        var colorList = [
                          '#EFE42A'
                        ];
                        return colorList[params.dataIndex]
                      },
                      //以下为是否显示
                      label: {
                        show: false
                      }
                    }
                  },
                  data:[4.9],
                },
                {
                  name:'深圳',
                  type:'bar',
                  itemStyle: {
                    normal: {
                      color: function(params) {
                        //首先定义一个数组
                        var colorList = [
                          '#64BD3D'
                        ];
                        return colorList[params.dataIndex]
                      },
                      //以下为是否显示
                      label: {
                        show: false
                      }
                    }
                  },
                  data:[7.9],
                },
                {
                  name:'广州',
                  type:'bar',
                  itemStyle: {
                    normal: {
                      color: function(params) {
                        //首先定义一个数组
                        var colorList = [
                          '#EE9201'
                        ];
                        return colorList[params.dataIndex]
                      },
                      //以下为是否显示
                      label: {
                        show: false
                      }
                    }
                  },
                  data:[23.0],
                }
              ]
            };


            // 为echarts对象加载数据
            myChart1.setOption(option1);
          }

          initChart1();
        </script>
    </body>
    </html>
        

  • 相关阅读:
    HDU 1106 排序
    strtok函数()
    HDU 2187汶川地震
    HDU 1716 排列2
    Rightmost Digit
    Text Reverse
    快速幂
    插入排序的一个应用-调整负数在前,正数在后,原来相对位置不变
    cuda 5.0配置vs2008+Visual Assist X +安装问题解决
    vc 热键、组合键的用法
  • 原文地址:https://www.cnblogs.com/herd/p/7250498.html
Copyright © 2020-2023  润新知