figure的使用
x = np.linspace(-1, 1, 50)
y1 = 2 * x + 1
#figure 1
plt.figure()
plt.plot(x, y1)
# figure 2
y2 = x**2
plt.figure()
plt.plot(x, y2)
# figure 3,指定figure的编号并指定figure的大小, 指定线的颜色, 宽度和类型
y2 = x**2
plt.figure(num = 5, figsize = (4, 4))
plt.plot(x, y1)
plt.plot(x, y2, color = 'red', linewidth = 1.0, linestyle = '--')
plt.show()
设置x/y坐标轴刻度
# 设置x轴的取值范围为:-1到2
plt.xlim(-1, 2)
# 设置y轴的取值范围为:-1到3
plt.ylim(-1, 3)
# 设置y刻度:用文字来显示刻度
plt.yticks([-2, -1.8, -1, 1.22, 3],
  ['really bad', 'bad', 'normal', 'good', 'really good'])
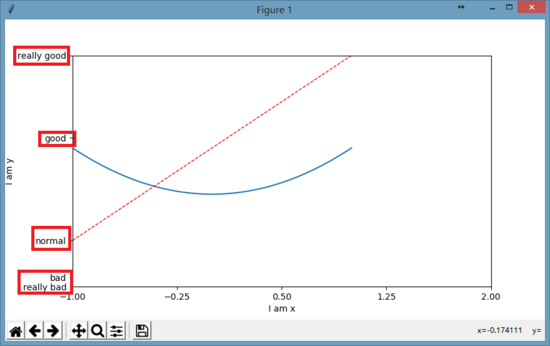
#用正则文本方式来显示字体,同时还用alpha来转义显示数学中的alpha字母
plt.yticks([-2, -1.8, -1, 1.22, 3],
  [r'$really bad$', r'$badalpha$', 'normal', r'$good$', 'really good'])

刻度设置
以xticks为例:
matplotlib.pyplot.xticks(*args, **kwargs)
获取或者设置当前刻度位置和文本的 x-limits:
# return locs, labels where locs is an array of tick locations and
# labels is an array of tick labels.
locs, labels = xticks()

# set the locations of the xticks
xticks( arange(6) )

# set the locations and labels of the xticks
xticks( arange(5), ('Tom', 'Dick', 'Harry', 'Sally', 'Sue') )
关键字 args ,如果有其他的参数则是 Text 属性。例如,旋转长的文本标注。
xticks( arange(12), calendar.month_name[1:13], rotation=17 )
Axis containers
matplotlib.axis.Axis对象负责刻度线、格网线、刻度标注和坐标轴标注的绘制工作。你可以设置y轴的左右刻度或者x轴的上下刻度。 Axis 也存储了用于自动调整,移动和放缩的数据和视觉间隔;同时Locator和Formatter对象控制着刻度的位置以及以怎样的字符串呈现。
每一个 Axis 对象包含一个 label 属性以及主刻度和小刻度的列表。刻度是 XTick和 YTick对象,其包含着实际线和文本元素,分别代表刻度和注释。因为刻度是根据需要动态创建的,你应该通过获取方法get_major_ticks()和 get_minor_ticks()以获取主刻度和小刻度的列表。尽管刻度包含了所有的元素,并且将会在下面代码中涵盖,Axis 方法包含了获取方法以返回刻度线、刻度标注和刻度位置等等:
In [285]: axis = ax.xaxis

In [286]: axis.get_ticklocs()
Out[286]: array([ 0.,  1.,  2.,  3.,  4.,  5.,  6.,  7.,  8.,  9.])

In [287]: axis.get_ticklabels()
Out[287]: 10 Text major ticklabel objects>

# note there are twice as many ticklines as labels because by
#  default there are tick lines at the top and bottom but only tick
#  labels below the xaxis; this can be customized
In [288]: axis.get_ticklines()
Out[288]: 20 Line2D ticklines objects>

# by default you get the major ticks back
In [291]: axis.get_ticklines()
Out[291]: 20 Line2D ticklines objects>

# but you can also ask for the minor ticks
In [292]: axis.get_ticklines(minor=True)
Out[292]: 0 Line2D ticklines objects>
Tick locating and formatting
该模块包括许多类以支持完整的刻度位置和格式的配置。尽管 locators 与主刻度或小刻度没有关系,他们经由 Axis 类使用来支持主刻度和小刻度位置和格式设置。一般情况下,刻度位置和格式均已提供,通常也是最常用的形式。
默认格式
当x轴数据绘制在一个大间隔的一个小的集中区域时,默认的格式将会生效。为了减少刻度标注重叠的可能性,刻度被标注在固定间隔之间的空白区域。比如:
ax.plot(np.arange(2000, 2010), range(10))
表现形式如下:

刻度仅标注了 0-9 以及一个间隔 +2e3 。如果不希望这种形式,可以关闭默认格式设置中的间隔标注的使用。
ax.get_xaxis().get_major_formatter().set_useOffset(False)
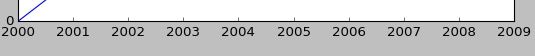
设置 rcParam axes.formatter.useoffset=False 以在全局上关闭,或者设置不同的格式。
刻度位置
Locator 类是所有刻度 Locators 的基类。 locators 负责根据数据的范围自动调整视觉间隔,以及刻度位置的选择。 MultipleLocator 是一种有用的半自动的刻度 Locator。 你可以通过基类进行初始化设置等等。
Locator 子类定义如下:
| NullLocator | No ticks |
|---|---|
| FixedLocator | Tick locations are fixed |
| IndexLocator | locator for index plots (e.g., where x = range(len(y))) |
| LinearLocator | evenly spaced ticks from min to max |
| LogLocator | logarithmically ticks from min to max |
| SymmetricalLogLocator | locator for use with with the symlog norm, works like the LogLocator for the part outside of the threshold and add 0 if inside the limits |
| MultipleLocator | ticks and range are a multiple of base;either integer or float |
| OldAutoLocator | choose a MultipleLocator and dyamically reassign it for intelligent ticking during navigation |
| MaxNLocator | finds up to a max number of ticks at nice locations |
| AutoLocator | MaxNLocator with simple defaults. This is the default tick locator for most plotting. |
| AutoMinorLocator | locator for minor ticks when the axis is linear and the major ticks are uniformly spaced. It subdivides the major tick interval into a specified number of minor intervals, defaulting to 4 or 5 depending on the major interval. |
你可以继承 Locator 定义自己的 locator。 你必须重写 ___call__ 方法,该方法返回位置的序列,你可能也想重写 autoscale 方法以根据数据的范围设置视觉间隔。
如果你想重写默认的locator,使用上面或常用的locator任何一个, 将其传给 x 或 y axis 对象。相关的方法如下:
ax.xaxis.set_major_locator( xmajorLocator )
ax.xaxis.set_minor_locator( xminorLocator )
ax.yaxis.set_major_locator( ymajorLocator )
ax.yaxis.set_minor_locator( yminorLocator )
刻度格式
刻度格式由 Formatter 继承来的类控制。 formatter仅仅作用于单个刻度值并且返回轴的字符串。
相关的子类请参考官方文档。
同样也可以通过重写 __all__ 方法来继承 Formatter 基类以设定自己的 formatter。
为了控制主刻度或小刻度标注的格式,使用下面任一方法:
ax.xaxis.set_major_formatter( xmajorFormatter )
ax.xaxis.set_minor_formatter( xminorFormatter )
ax.yaxis.set_major_formatter( ymajorFormatter )
ax.yaxis.set_minor_formatter( yminorFormatter )
设置刻度标注
原型举例:
set_xticklabels(labels, fontdict=None, minor=False, **kwargs)
综合举例(1)如下:
设置指定位置的标注更改为其他的标注:
plt.xticks([-np.pi, -np.pi/2, 0, np.pi/2, np.pi],
          [r'$-pi$', r'$-pi/2$', r'$0$', r'$+pi/2$', r'$+pi$'])

plt.yticks([-1, 0, +1],
          [r'$-1$', r'$0$', r'$+1$'])
综合举例(2)如下:
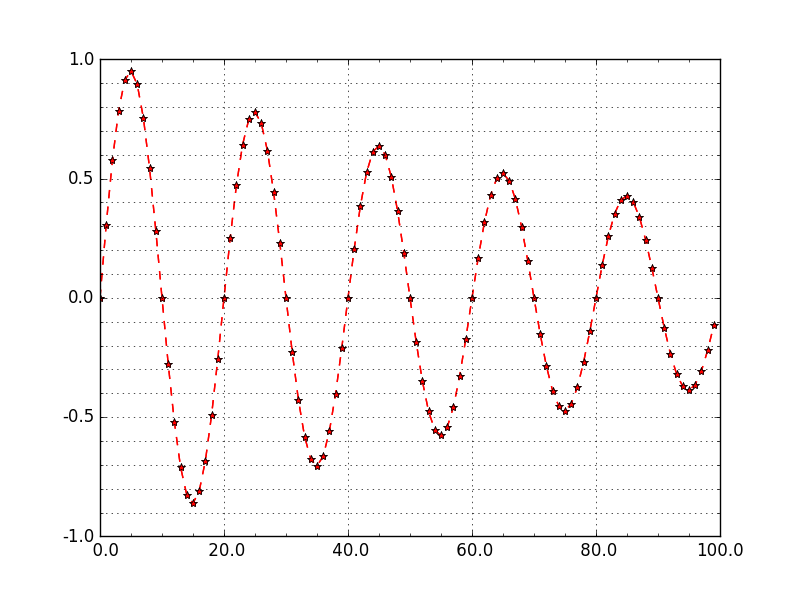
设置坐标轴主刻度和次刻度。
#!/usr/bin/env python
#-*- coding: utf-8 -*-
#---------------------------------------------------
#演示MatPlotLib中设置坐标轴主刻度标签和次刻度标签.

#对于次刻度显示,如果要使用默认设置只要matplotlib.pyplot.minorticks_on()

#---------------------------------------------------

import numpy as np
import matplotlib.pyplot as plt
from matplotlib.ticker import MultipleLocator, FormatStrFormatter

#---------------------------------------------------
xmajorLocator   = MultipleLocator(20) #将x主刻度标签设置为20的倍数
xmajorFormatter = FormatStrFormatter('%5.1f') #设置x轴标签文本的格式
xminorLocator   = MultipleLocator(5) #将x轴次刻度标签设置为5的倍数


ymajorLocator   = MultipleLocator(0.5) #将y轴主刻度标签设置为0.5的倍数
ymajorFormatter = FormatStrFormatter('%1.1f') #设置y轴标签文本的格式
yminorLocator   = MultipleLocator(0.1) #将此y轴次刻度标签设置为0.1的倍数


t = np.arange(0.0, 100.0, 1)
s = np.sin(0.1*np.pi*t)*np.exp(-t*0.01)

ax = plt.subplot(111) #注意:一般都在ax中设置,不再plot中设置
plt.plot(t,s,'--r*')

#设置主刻度标签的位置,标签文本的格式
ax.xaxis.set_major_locator(xmajorLocator)
ax.xaxis.set_major_formatter(xmajorFormatter)

ax.yaxis.set_major_locator(ymajorLocator)
ax.yaxis.set_major_formatter(ymajorFormatter)

#显示次刻度标签的位置,没有标签文本
ax.xaxis.set_minor_locator(xminorLocator)
ax.yaxis.set_minor_locator(yminorLocator)

ax.xaxis.grid(True, which='major') #x坐标轴的网格使用主刻度
ax.yaxis.grid(True, which='minor') #y坐标轴的网格使用次刻度

plt.show()

##########################################################
图像形式如下:
存储图片
matplotlib.use('Agg')  #重要

from matplotlib.pyplot import plot,savefig

x=np.linspace(-4,4,30)
y=np.sin(x);

plot(x,y,'--*b')

savefig('D:/MyFig.jpg')
坐标轴设置
#设置坐标轴名称
plt.xlabel("")
plt.ylabel("")
#设置坐标轴刻度
plt.xticks()
plt.yticks()
#设置坐标轴上下限
plt.xlim(1,2)
plt.ylim(1,2)
#在图中画横竖线
plt.vlines(0,1,2,colors="r")#垂直线,从(0,1)到(0,2)
plt.hlines(4,1,2,colors="r")#水平线,从(1,4)到(2,4)