一、前言
大屏地图模块采用浏览器模块+echart组件,Qt自带了webkit或者webengine模块,其中在win上mingw编译器的Qt5.6以后的版本,没有了浏览器模块,这个就需要用第三方的浏览器模块比如miniblink或者cef等,个人偏好miniblink因为足够简单。为了能够兼容所有的Qt版本和应用场景,特意专门写了通用浏览器控件独立的类webview,只要new即可,会自动判断Qt版本以及存在哪种浏览器模块就用哪种,优先采用Qt自带的浏览器模块,除非手动指定miniblink就用miniblink浏览器模块。
中间大屏地图多种样式:
- 静态图片:存在资源文件中的静态图片文件;
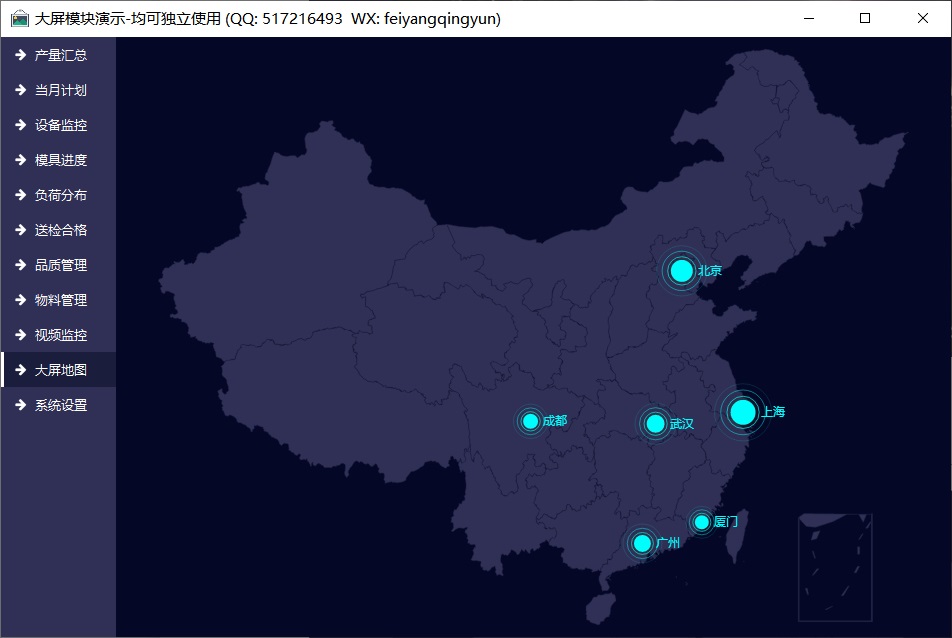
- 闪烁效果:中国地图不同城市闪烁点效果;
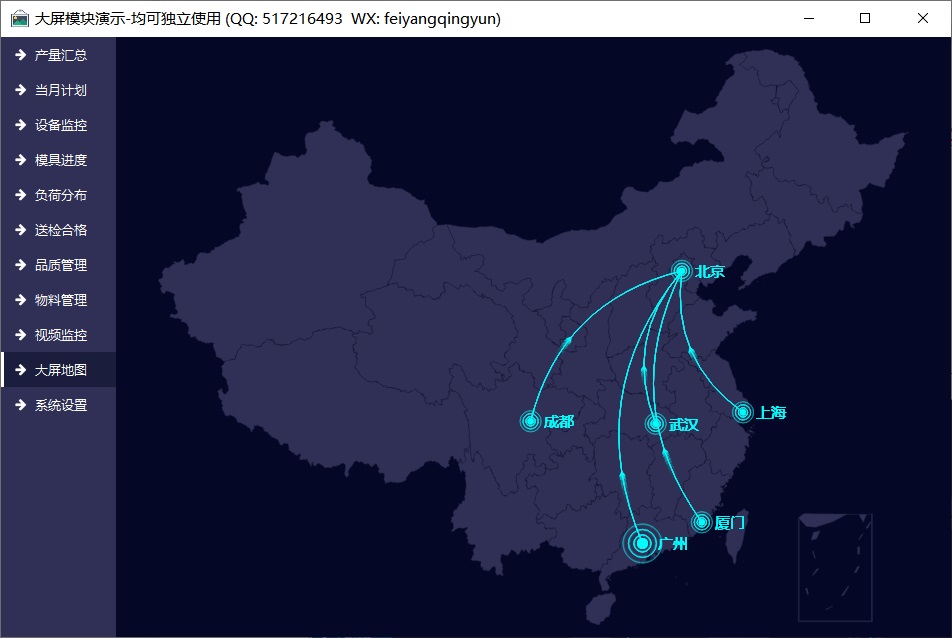
- 迁徙效果:中国地图不同城市飞机迁徙效果;
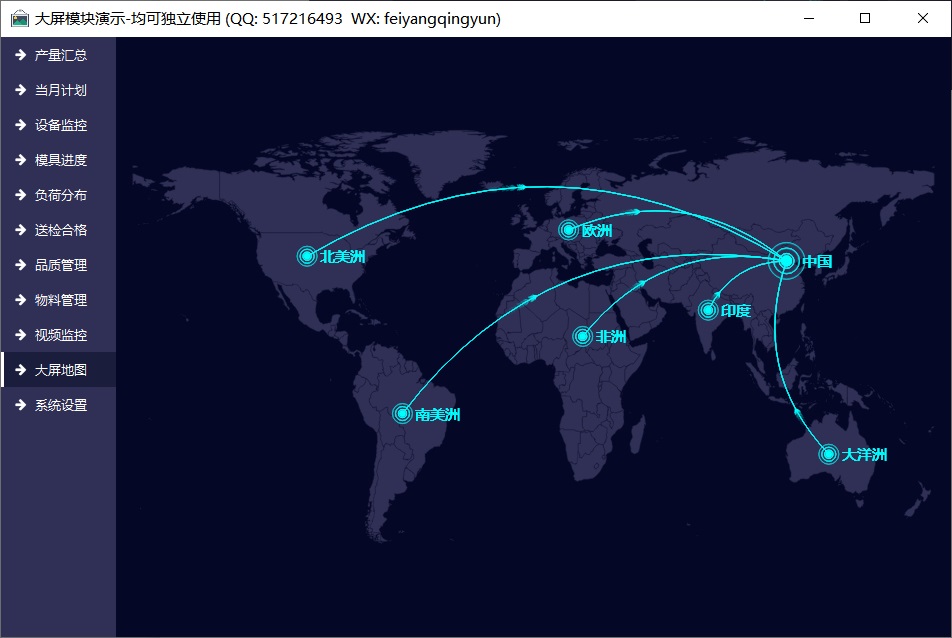
- 世界地图:世界地图不同国家飞机迁徙效果;
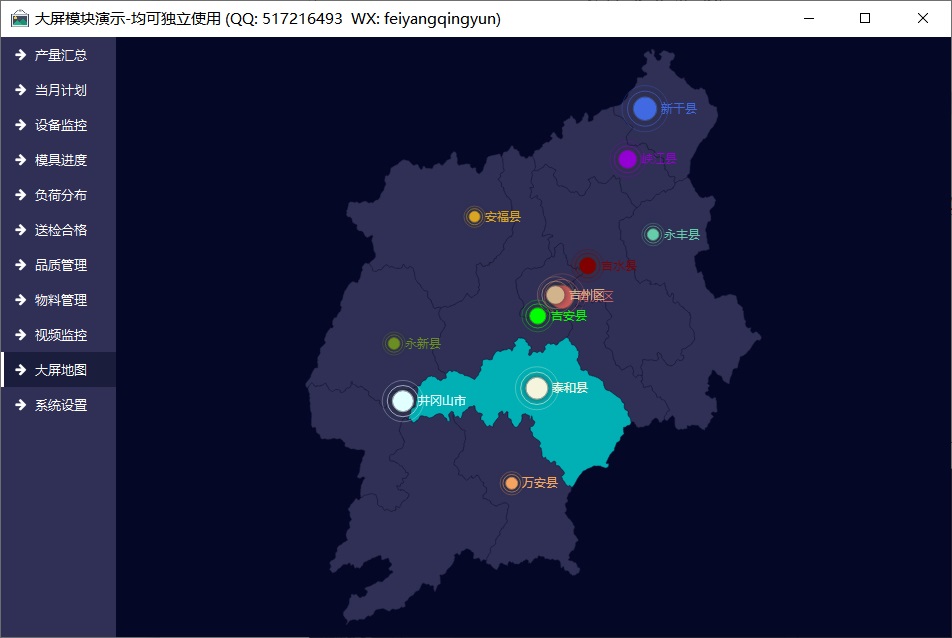
- 区域地图:指定某个省市不同县城闪烁点效果,不同颜色点;
二、功能特点
- 采用分层设计,整体总共分三级界面,一级界面是整体布局,二级界面是单个功能模块,三级界面是单个控件。
- 子控件包括饼图、圆环图、曲线图、柱状图、柱状分组图、横向柱状图、横向柱状分组图、合格率控件、百分比控件、进度控件、设备状态面板、表格数据、地图控件、视频控件等。
- 二级界面可以自由拖动悬浮,支持最小化隐藏、最大化关闭、响应双击自定义标题栏。
- 数据源支持模拟数据(默认)、数据库采集、串口通信(需定制)、网络通信(需定制)、网络请求等,可自由设定每个子界面的采集间隔即数据刷新频率。
- 采用纯QWidget编写,亲测Qt4.6到Qt6.2任意版本,理论上支持后续其他Qt版本。
- 超强跨平台,亲测windows、linux、mac、国产uos、国产银河麒麟kylin等系统,效果完美,同时还支持嵌入式linux比如树莓派、香橙派、全志、imx6等。
- 同时集成了自定义控件、qchart饼图、echart地图等功能。
- 内置多套配色风格样式(紫色、蓝色、深蓝、黑色),默认紫色,自适应任意分辨率。
- 可设置系统标题、目标分辨率、布局方案,启动立即应用。
- 可设置主背景颜色、面板颜色、十字线游标颜色等各种颜色。
- 可设置多条曲线不同颜色,没有设置颜色的情况下内置多套精美颜色随机应用。
- 可设置标题栏背景颜色、文字颜色。
- 可设置曲线图表背景颜色、文字颜色、网格颜色。
- 可设置正常颜色、警戒颜色、报警颜色、禁用颜色、百分比进度颜色。
- 可分别设置各种字体大小,比如全局字体、软件名称、标题栏、子标题栏、加粗标签等。
- 可设置标题栏高度、表头高度、行高度。
- 曲线支持游标、定位线、悬停高亮数据点、悬停显示值。
- 柱状图支持顶部(可设置顶端、上部、中间、底部)显示数据,全部自适应计算位置。
- 支持平滑曲线,内置多种平滑曲线算法,还支持面积图平滑。
- 面积图填充颜色可选多种规则比如单色透明度填充、透明度渐变填充等。
- 数据库支持sqlite、mysql、postgresql、oracle、国产人大金仓等数据库。
- 主界面直接鼠标右键切换布局、配色方案、关闭开启某个二级窗体。
- 自动记忆所有子窗口的大小和位置,下次启动立即应用。
- 动态加载布局方案菜单,可以动态新建布局、恢复布局、保存布局、另存布局等,用户可以制造任意布局。
- 二级窗体,双击从主窗体分离出来浮动,可以自由调整大小。再次双击标题栏最大化,再次双击还原。
- 子模块也可以全屏显示作为一个大屏,这样就可以一个大屏拓展出多个子大屏,放大查看子模块的数据详情,适用多屏展示。
- 每个模块都可以自定义采集速度,如果是数据库采集会自动排队处理,后期还可以拓展每个子模块都独立的数据库采集。
- 提供系统设置模块进行整体的配置参数设置,效果立即应用。
- 提供精美炫酷的大屏地图模块,包括静态图片、闪烁效果、迁徙效果、世界地图、区域地图等,可指定点的经纬度坐标,识别单击响应,可以做地图跳转等,每个点都可以不同的颜色和提示信息。
- 除了提供大屏系统外,还将每个模块都做了独立的模块示例界面,每个模块都可以独立学习使用,里面用到的控件也单独做了控件示例界面,方便学习每个控件如何使用。
- 非常详细的开发和使用手册,其中包括数据库说明、模块对照图、控件对照图、项目结构、代码说明(精确到每个类)、演示demo、使用方法等。
三、体验地址
- 体验地址:https://pan.baidu.com/s/1d7TH_GEYl5nOecuNlWJJ7g 提取码:01jf 文件名:bin_bigscreen.zip。
- 国内站点:https://gitee.com/feiyangqingyun
- 国际站点:https://github.com/feiyangqingyun
- 个人主页:https://blog.csdn.net/feiyangqingyun
- 知乎主页:https://www.zhihu.com/people/feiyangqingyun/
- 在线文档:https://feiyangqingyun.gitee.io/qwidgetdemo/bigscreen/
四、效果图
五、核心代码
#include "frmmodulemap.h"
#include "ui_frmmodulemap.h"
#include "quihelper.h"

#ifdef echarts
#include "echarts.h"
#include "echartjs.h"
#endif

frmModuleMap::frmModuleMap(QWidget *parent) : QWidget(parent), ui(new Ui::frmModuleMap)
{
    ui->setupUi(this);
    this->initForm();
    this->initBg();
    this->changeMapStyle(false);
}

frmModuleMap::~frmModuleMap()
{
    delete ui;
}

void frmModuleMap::showEvent(QShowEvent *)
{
    static bool isShow = false;
    if (!isShow) {
        isShow = true;
        QTimer::singleShot(100, this, SLOT(loadBg()));
    }
}

void frmModuleMap::resizeEvent(QResizeEvent *)
{
    if (AppConfig::MapStyle == "image") {
        loadImage();
    } else {
        resizeMap();
    }
}

void frmModuleMap::initForm()
{
    isLoad = false;
    labMap = new QLabel;
    labMap->setObjectName("labMap");
    labMap->setAlignment(Qt::AlignCenter);
    labMap->setSizePolicy(QSizePolicy::Ignored, QSizePolicy::Ignored);
    this->layout()->addWidget(labMap);
#ifdef echarts
    web = new WebView(this);
    web->setLayout(ui->verticalLayout);
    connect(web, SIGNAL(loadFinished(bool)),
            this, SLOT(loadFinished()));
    connect(web, SIGNAL(receiveDataFromJs(QString, QVariant)),
            this, SLOT(receiveDataFromJs(QString, QVariant)));
#endif

    //样式改变了需要重新载入地图,因为颜色变了
    connect(AppEvent::Instance(), SIGNAL(changeStyle()), this, SLOT(loadBg()));
    //地图样式改变
    connect(AppEvent::Instance(), SIGNAL(changeMapStyle()), this, SLOT(changeMapStyle()));
}

void frmModuleMap::initBg()
{
#ifdef echarts
    web->setBgColor(AppConfig::ColorMainBg);
#endif
}

void frmModuleMap::loadBg()
{
    if (AppConfig::MapStyle == "image") {
        loadImage();
    } else {
        loadMap();
    }
}

void frmModuleMap::loadImage()
{
    QString fileName = "bg_china1.png";
    if (AppConfig::ThemeName == "紫色风格") {
        fileName = "bg_china1.png";
    } else if (AppConfig::ThemeName == "蓝色风格") {
        fileName = "bg_china2.png";
    } else if (AppConfig::ThemeName == "深蓝风格") {
        fileName = "bg_china3.png";
    } else if (AppConfig::ThemeName == "黑色风格") {
        fileName = "bg_china4.png";
    }

    //等比例平滑缩放
    QPixmap pix(QString("%1/image_bigscreen/%2").arg(QUIHelper::appPath()).arg(fileName));
    pix = pix.scaled(labMap->size(), Qt::KeepAspectRatio, Qt::SmoothTransformation);
    labMap->setPixmap(pix);
}

void frmModuleMap::loadMap()
{
#ifdef echarts
    QString fileName = QString("%1/map_echarts.html").arg(ConfigPath);
    url = "file:///" + fileName;

    Echarts::Instance()->setHeight(this->height());
    Echarts::Instance()->setFileName(fileName);
    Echarts::Instance()->setSaveFile(SaveFile);

    Echarts::Instance()->setZoom(1.2);
    Echarts::Instance()->setMapJsName("china");
    Echarts::Instance()->setMapAreaName("china");

    QStringList cityName, cityValue, cityPoint, cityColor, cityTip;
    cityName << "上海" << "北京" << "成都" << "武汉" << "厦门" << "广州";
    cityValue << "250" << "220" << "150" << "180" << "140" << "170";
    cityPoint << "121.48,31.22" << "116.46,39.92" << "104.06,30.67" << "114.31,30.52" << "118.1,24.46" << "113.23,23.16";

    //设置颜色,也可以定义成不同的颜色,牛逼吧
    for (int i = 0; i < cityName.count(); i++) {
        cityColor << AppConfig::ColorPercent;
    }

    //设置提示信息,为空则按照默认规则,更牛逼吧
    //提示信息可以是html字符串(这样就强大到爆了) 换行符是 <br>
    for (int i = 0; i < cityName.count(); i++) {
        cityTip << QString("%1 = %2%").arg(cityName.at(i)).arg(cityValue.at(i));
    }

    Echarts::Instance()->setCityName(cityName);
    Echarts::Instance()->setCityValue(cityValue);
    Echarts::Instance()->setCityPoint(cityPoint);
    Echarts::Instance()->setCityColor(cityColor);
    Echarts::Instance()->setCityTip(cityTip);

    QString html;
    if (AppConfig::MapStyle == "point") {
        html = Echarts::Instance()->newChartPoint();
    } else if (AppConfig::MapStyle == "move") {
        cityValue.clear();
        cityValue << "0" << "0" << "0" << "0" << "0" << "1";
        Echarts::Instance()->setCityValue(cityValue);
        html = Echarts::Instance()->newChartMove("北京");
    } else if (AppConfig::MapStyle == "world") {
        loadMapWord();
        html = Echarts::Instance()->newChartMove("中国");
    } else if (AppConfig::MapStyle == "area") {
        //如果要加载省份而不是市则设置 dirName和areaName 都是省份名称就行
        loadMapArea("江西", "吉安市");
        html = Echarts::Instance()->newChartPoint();
    }

    //下面为两种方式加载网页,如果内容为空则加载网页文件否则加载内容
    //一般为了保密建议加载内容,这样看不到生成的网页文件
    if (Echarts::Instance()->getSaveFile()) {
        web->load(url);
    } else {
        QString baseUrl = QString("%1/").arg(ConfigPath);
        web->load("", html, baseUrl);
        //QString http = "http://data.fengmap.cn:1024/yz/connect/DEMO/%E6%A8%A1%E5%9E%8B3D/DEMO%E4%B8%89%E7%BB%B41/20180611_%E5%94%90%E5%B1%B1%E5%B7%A5%E4%BA%BA%E5%8C%BB%E9%99%A2_241902";
        //web->load(http);
    }
#endif
}

void frmModuleMap::loadMapWord()
{
    QStringList cityName, cityValue, cityPoint, cityColor, cityTip;
#if 0
    cityName << "美国1" << "美国2" << "美国3" << "英国" << "德国" << "荷兰" << "澳大利亚" << "温州";
    cityValue << "0" << "0" << "0" << "0" << "0" << "0" << "0" << "1";
    cityPoint << "-115.652087,44.677279" << "-97.990682,32.358956" << "-119.037189,35.667425"
              << "-1.742162,52.468150" << "10.032107,50.633281" << "5.763934,53.181365"
              << "134.250655,-23.981496" << "120.65,28.01";
#else
    cityName << "北美洲" << "南美洲" << "非洲" << "欧洲" << "大洋洲" << "印度" << "中国";
    cityValue << "0" << "0" << "0" << "0" << "0" << "0" << "1";
    cityPoint << "-101.670961,41.103997" << "-58.842054,-11.895087" << "22.106051,14.099049"
              << "15.777381,49.971800" << "132.637011,-25.596128" << "78.475369,22.934290"
              << "113.651000,39.526776";
#endif

    //设置颜色,也可以定义成不同的颜色,牛逼吧
    for (int i = 0; i < cityName.count(); i++) {
        cityColor << "";
        cityTip << QString("销售额占比: %1 = %2%").arg(cityName.at(i)).arg(rand() % 100);
    }

    Echarts::Instance()->setCityName(cityName);
    Echarts::Instance()->setCityValue(cityValue);
    Echarts::Instance()->setCityPoint(cityPoint);
    Echarts::Instance()->setCityColor(cityColor);
    Echarts::Instance()->setCityTip(cityTip);
    Echarts::Instance()->setMapJsName("world");
    Echarts::Instance()->setMapAreaName("world");
}

bool frmModuleMap::loadMapArea(const QString &dirName, const QString &areaName)
{
    QStringList cityName, cityValue, cityPoint, cityColor, cityTip;
    QString jsName = dirName + "/" + areaName;
    QString jsFile = QString("%1/areajs/%2/%3.js").arg(ConfigPath).arg(dirName).arg(areaName);
    //文件不存在则不用加载
    if (!QFile(jsFile).exists()) {
        return false;
    }

    QStringList infos = EchartJs::getInfoFromJs(jsFile);
    foreach (QString info, infos) {
        QStringList list = info.split("|");
        cityName << list.at(0);
        cityValue << QString("%1").arg((rand() % 150) + 100);
        cityPoint << list.at(1);
    }

    QStringList colors = QColor::colorNames();
    for (int i = 0; i < cityName.count(); i++) {
        cityColor << colors.at(rand() % colors.count());
        cityTip << QString("%1 = %2 产量").arg(cityName.at(i)).arg(cityValue.at(i));
    }

    Echarts::Instance()->setCityName(cityName);
    Echarts::Instance()->setCityValue(cityValue);
    Echarts::Instance()->setCityPoint(cityPoint);
    Echarts::Instance()->setCityColor(cityColor);
    Echarts::Instance()->setCityTip(cityTip);
    Echarts::Instance()->setMapJsName(jsName);
    Echarts::Instance()->setMapAreaName(areaName);
    return true;
}

void frmModuleMap::resizeMap()
{
#ifdef echarts
    if (isLoad) {
        QString js = QString("resize(%1, %2)").arg(this->width()).arg(this->height());
        web->runJs(js);
    }
#endif
}

void frmModuleMap::changeMapStyle(bool load)
{
    if (AppConfig::MapStyle == "image") {
#ifdef echarts
        web->setVisible(false);
#endif
        labMap->setVisible(true);
    } else {
        labMap->setVisible(false);
#ifdef echarts
        web->setVisible(true);
#endif
    }

    if (load) {
        //qApp->processEvents();
        if (AppConfig::MapStyle == "image") {
            loadImage();
        } else {
            loadMap();
        }
    }
}

void frmModuleMap::loadFinished()
{
    isLoad = true;
}

void frmModuleMap::receiveDataFromJs(const QString &type, const QVariant &data)
{
    qDebug() << type << data;
    QString datas = data.toString();

    if (type == "name") {
        //根据单击的省份重新加载省份地图
        if (AppConfig::MapStyle == "point" || AppConfig::MapStyle == "move") {
            //如果设置成功则切进去并记住省份名称
            bool ok = loadMapArea(datas, datas);
            if (ok) {
                QString html = Echarts::Instance()->newChartPoint();
                if (Echarts::Instance()->getSaveFile()) {
                    web->load(url);
                } else {
                    QString baseUrl = QString("%1/").arg(ConfigPath);
                    web->load("", html, baseUrl);
                }
            }
        } else {
            QUIHelper::showMessageBoxInfo(QString("当前单击了区域 %1").arg(datas));
        }
    } else if (type == "params") {
        //如果单击的不是点数据则会带undefined,这样可以过滤掉不需要的数据
        if (!datas.contains("undefined")) {
            QUIHelper::showMessageBoxInfo(QString("当前单击了点 %1").arg(datas));
        }
    }
}