最近和朋友一起做的监控配置,拿出来共享一下
1.下载prometheus安装包(linux版)到 /opt/minitor/prometheus 。
下载地址:https://download.csdn.net/download/a15565772151/11111904
不知道为啥,csdn没法自己设置不需要积分了,可能是我没找到在哪里操作,可以私聊我一下我发你资源
2.运行 tar -zxvf prometheus-2.0.0.linux-amd64.tar.gz ,解压文件到当前目录。
3.执行 vim /opt/minitor/prometheus/prometheus.yml。 如果vim不可用,可以使用vi,这里使用vim主要是为了好看。额。。。。或者可以yum install vim
# my global config
global:
  scrape_interval:     5s # Set the scrape interval to every 15 seconds. Default is every 1 minute.
  evaluation_interval: 5s # Evaluate rules every 15 seconds. The default is every 1 minute.
  # scrape_timeout is set to the global default (10s).

# Alertmanager configuration
alerting:
  alertmanagers:
    - static_configs:
#     - targets: ['localhost:9093']

# Load rules once and periodically evaluate them according to the global 'evaluation_interval'.
rule_files:
# - "/opt/prometheus/prome/prometheus-2.0.0.linux-amd64/rules/rules.yml"

# A scrape configuration containing exactly one endpoint to scrape:
# Here it's Prometheus itself.
scrape_configs:
  # The job name is added as a label `job=<job_name>` to any timeseries scraped from this config.
  - job_name: 'prometheus'

    # metrics_path defaults to '/metrics'
    # scheme defaults to 'http'.

    static_configs:
      - targets: ['ip地址:9090']
        labels:
          instance: prometheus
一定要注意缩进,同一级别的一定得对其
4.启动prometheus。
nohup ./prometheus --config.file=prometheus.yml --web.listen-address=:9090 &
5.去prometheus自带的web页面上查看 http://IP地址:9090/graph
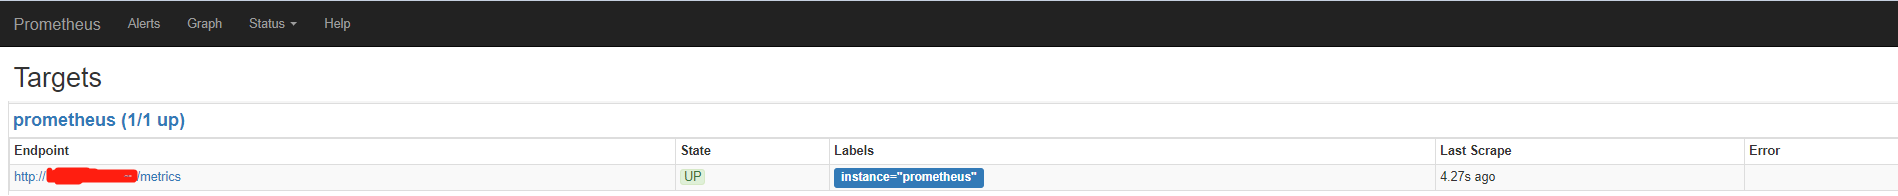
6.prometheus状态为up,说明配置成功。