一、安装blackbox-exporter
创建configmap
blackbox.yaml
modules:
  http_2xx:
    prober: http
  http_post_2xx:
    prober: http
    http:
      method: POST
  tcp_connect:
    prober: tcp
  pop3s_banner:
    prober: tcp
    tcp:
      query_response:
      - expect: "^+OK"
      tls: true
      tls_config:
        insecure_skip_verify: false
  ssh_banner:
    prober: tcp
    tcp:
      query_response:
      - expect: "^SSH-2.0-"
  irc_banner:
    prober: tcp
    tcp:
      query_response:
      - send: "NICK prober"
      - send: "USER prober prober prober :prober"
      - expect: "PING :([^ ]+)"
        send: "PONG ${1}"
      - expect: "^:[^ ]+ 001"
  icmp:
    prober: icmp
创建
# kubectl create cm blackbox-config --from-file=blackbox.yaml -n monitoring
configmap/blackbox-config created
创建blackcbox-exporter
apiVersion: v1
kind: Service
metadata:
  name: blackbox
  namespace: monitoring
  labels:
    k8s-app: blackbox
spec:
  selector:
    k8s-app: blackbox
  ports:
  - name: blackbox
    port: 9115
    protocol: TCP
  type: ClusterIP

---
apiVersion: apps/v1
kind: Deployment
metadata:
  name: blackbox
  namespace: monitoring
  labels:
    k8s-app: blackbox
spec:
  selector:
    matchLabels:
      k8s-app: blackbox
  replicas: 1
  template:
    metadata:
      labels:
        k8s-app: blackbox
    spec:
      containers:
      - name: blackbox
        image: prom/blackbox-exporter:master
        imagePullPolicy: IfNotPresent
        args: ["--config.file=/etc/blackbox/blackbox.yaml"]
        resources:
          requests:
            memory: 100M
        volumeMounts:
        - name: tz-config
          mountPath: /etc/localtime
          readOnly: true
        - name: blackbox-config
          mountPath: /etc/blackbox
          readOnly: true
      nodeSelector:
        monitor: "true"
      volumes:
        - name: tz-config
          hostPath:
            path: /usr/share/zoneinfo/Asia/Shanghai
        - name: blackbox-config
          configMap:
            name: blackbox-config
创建
kubectl create -f blackbox-exporter.yaml
查看
# kubectl get svc,pod -n monitoring -l k8s-app=blackbox
NAME               TYPE        CLUSTER-IP      EXTERNAL-IP   PORT(S)    AGE
service/blackbox   ClusterIP   10.108.47.141   <none>        9115/TCP   10m

NAME                            READY   STATUS    RESTARTS   AGE
pod/blackbox-86b7486879-w6n22   1/1     Running   0          5m9s
测试
# curl "http://10.108.47.141:9115/probe?target=baidu.com&module=http_2xx"


# HELP probe_dns_lookup_time_seconds Returns the time taken for probe dns lookup in seconds
# TYPE probe_dns_lookup_time_seconds gauge
probe_dns_lookup_time_seconds 0.017669272
# HELP probe_duration_seconds Returns how long the probe took to complete in seconds
# TYPE probe_duration_seconds gauge
probe_duration_seconds 0.079658423
# HELP probe_failed_due_to_regex Indicates if probe failed due to regex
# TYPE probe_failed_due_to_regex gauge
probe_failed_due_to_regex 0
# HELP probe_http_content_length Length of http content response
# TYPE probe_http_content_length gauge
probe_http_content_length 81
# HELP probe_http_duration_seconds Duration of http request by phase, summed over all redirects
# TYPE probe_http_duration_seconds gauge
probe_http_duration_seconds{phase="connect"} 0.031100739
probe_http_duration_seconds{phase="processing"} 0.030203142
probe_http_duration_seconds{phase="resolve"} 0.017669272
probe_http_duration_seconds{phase="tls"} 0
probe_http_duration_seconds{phase="transfer"} 0.0002315
# HELP probe_http_last_modified_timestamp_seconds Returns the Last-Modified HTTP response header in unixtime
# TYPE probe_http_last_modified_timestamp_seconds gauge
probe_http_last_modified_timestamp_seconds 1.26330408e+09
# HELP probe_http_redirects The number of redirects
# TYPE probe_http_redirects gauge
probe_http_redirects 0
# HELP probe_http_ssl Indicates if SSL was used for the final redirect
# TYPE probe_http_ssl gauge
probe_http_ssl 0
# HELP probe_http_status_code Response HTTP status code
# TYPE probe_http_status_code gauge
probe_http_status_code 200
# HELP probe_http_uncompressed_body_length Length of uncompressed response body
# TYPE probe_http_uncompressed_body_length gauge
probe_http_uncompressed_body_length 81
# HELP probe_http_version Returns the version of HTTP of the probe response
# TYPE probe_http_version gauge
probe_http_version 1.1
# HELP probe_ip_addr_hash Specifies the hash of IP address. It's useful to detect if the IP address changes.
# TYPE probe_ip_addr_hash gauge
probe_ip_addr_hash 2.752187856e+09
# HELP probe_ip_protocol Specifies whether probe ip protocol is IP4 or IP6
# TYPE probe_ip_protocol gauge
probe_ip_protocol 4
# HELP probe_success Displays whether or not the probe was a success
# TYPE probe_success gauge
probe_success 1
二、Blacakbox-exporter应用
先创建一个secret
prometheus-additional.yaml
- job_name: 'blackbox'
  metrics_path: /probe
  params:
    module: [http_2xx]  # Look for a HTTP 200 response.
  static_configs:
    - targets:
      #- http://prometheus.io    # Target to probe with http.
      #- https://prometheus.io   # Target to probe with https.
      - https://www.baidu.com # Target to probe with http on port 8080.
  relabel_configs:
    - source_labels: [__address__]
      target_label: __param_target
    - source_labels: [__param_target]
      target_label: instance
    - target_label: __address__
      replacement: blackbox:9115  # The blackbox exporter's real hostname:port.
- 替换ip地址为blackbox的service名称
创建
kubectl create secret generic additional-scrape-configs --from-file=prometheus-additional.yaml --dry-run -oyaml > additional-scrape-configs.yaml
# kubectl create -f additional-scrape-configs.yaml -n monitoring
secret/additional-scrape-configs created
查看
# kubectl get secret -n monitoring
NAME                              TYPE                                  DATA   AGE
additional-scrape-configs         Opaque
修改Prometheus的CRD
$path/prometheus/kube-prometheus/manifests/prometheus-prometheus.yaml
  serviceAccountName: prometheus-k8s
  additionalScrapeConfigs:
    name: additional-scrape-configs
    key: prometheus-additional.yaml
  serviceMonitorNamespaceSelector: {}
  serviceMonitorSelector: {}
- 新增additionalScrapeConfigs配置项
# kubectl replace -f prometheus-prometheus.yaml
重启Prometheus,不能自动启动,就先删除Prometheus的pod
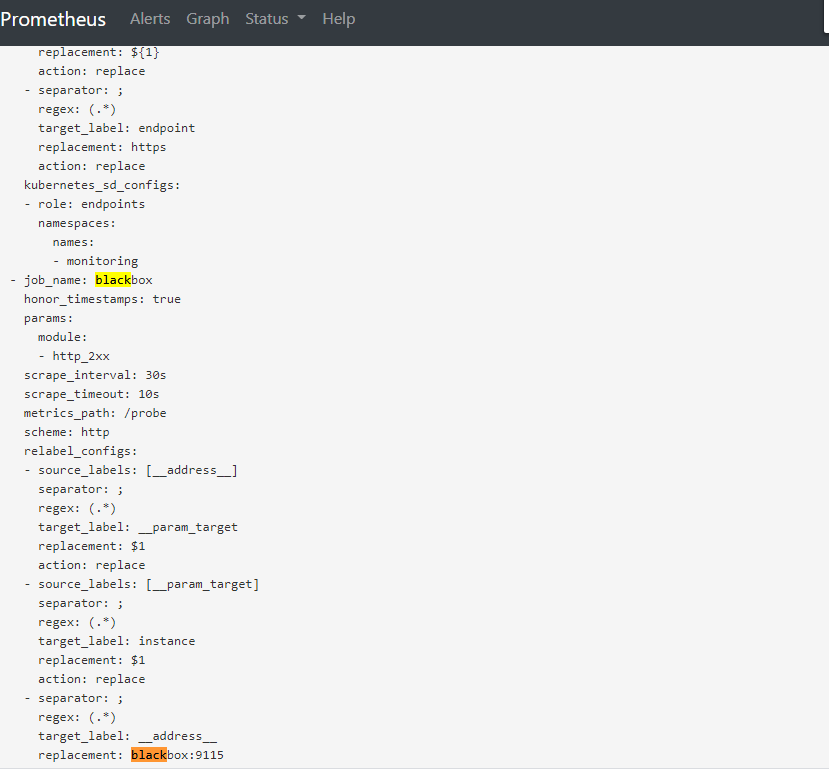
查看prometheus中status/configuration
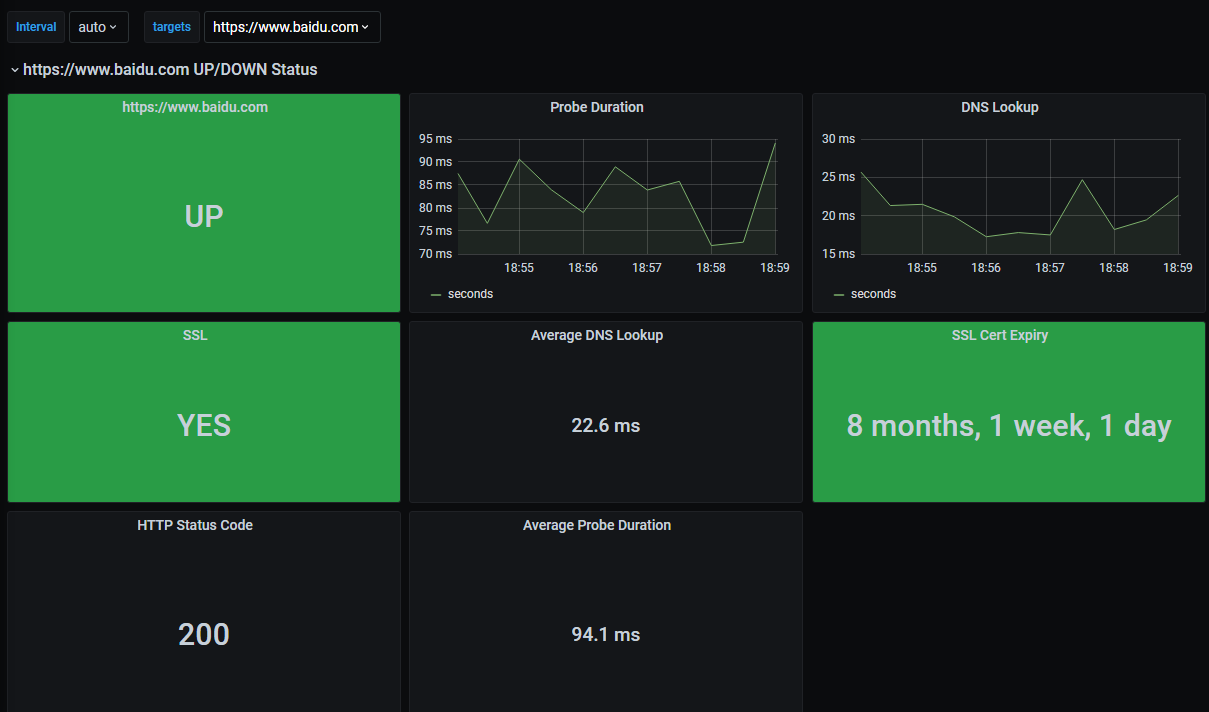
导入grafana的dashboard,可以在grafana官网上寻找