简介
line_profiler
逐行分析代码消耗时间
memory_profiler
逐行分析代码消耗内存
安装
pip install line_profiler

memory_profiler
由于pip安装出现编码错误,故使用源码包安装
<https://files.pythonhosted.org/packages/7a/92/7c0ecbe9ae1c391dff8ac1cd7801e8059df8942dca48dd6c31f511b14642/memory_profiler-0.59.0.tar.gz>
下载解压后修改setup.py中两处报错代码,加入 encoding="utf-8"后执行
pyton setup.py install
测试代码
ACCOUNT_TYPE={f'{i}':i for i in range(100000)}

@profile
def test():
    key = map(lambda x:int(x),ACCOUNT_TYPE)
    tmp = dict(zip(key,ACCOUNT_TYPE.values()))

@profile
def test1():
    t={}
    for key,value in ACCOUNT_TYPE.items():
        t[int(key)] = value


if __name__ == '__main__':
    test()
    test1()
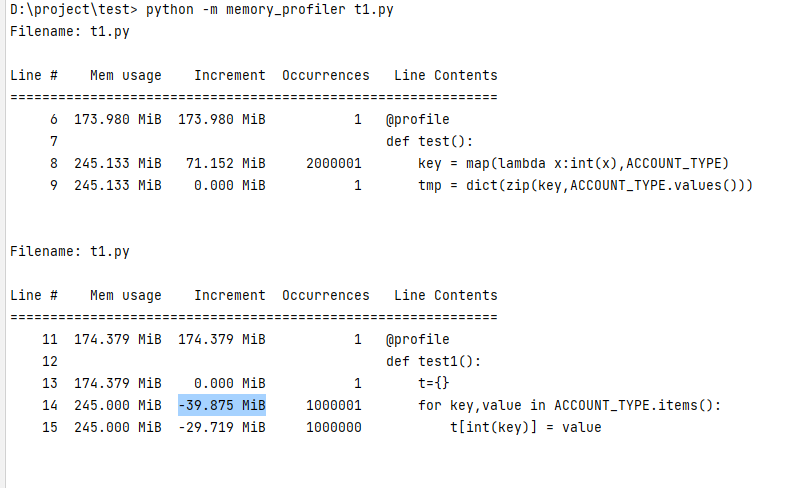
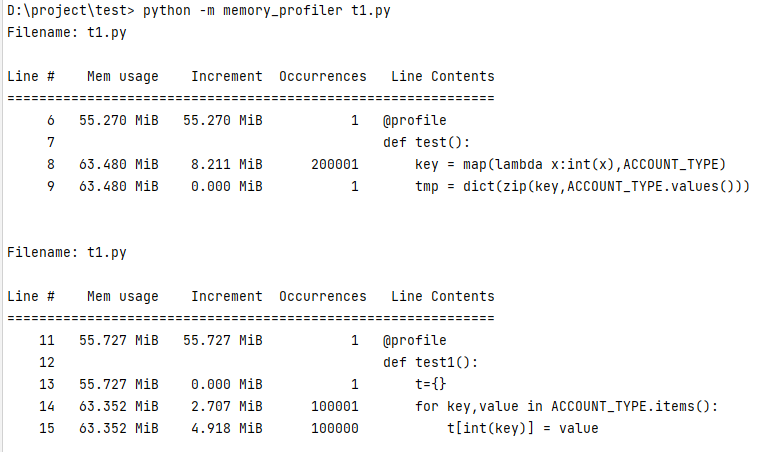
内存结果
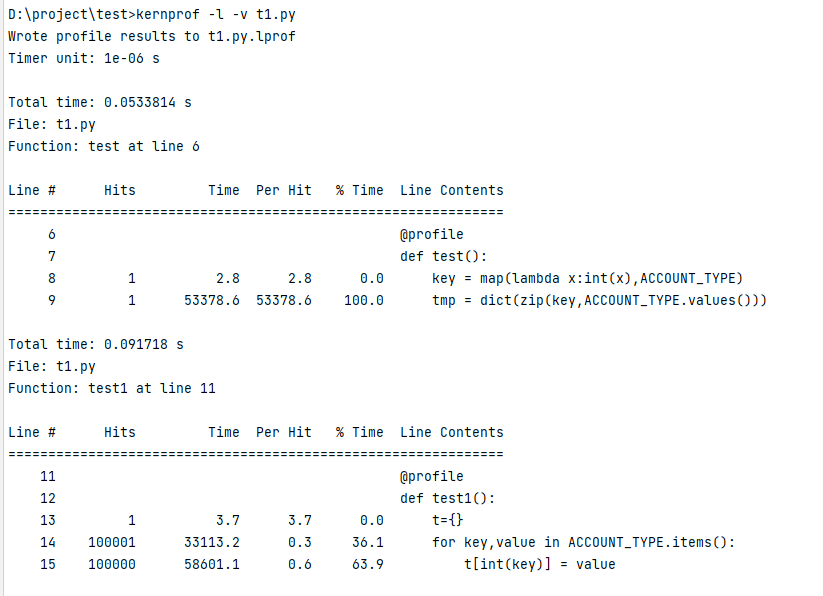
时间结果
分析
此图是基于10万key的字典得到的结果,再将key的数量增加到100万后,内存结果发生了较大的变化