import React from 'react';
import {
G2,
Chart,
Geom,
Axis,
Tooltip,
Coord,
Label,
Legend,
View,
Guide,
Shape,
Facet,
Util,
} from 'bizcharts';
const { Line } = Guide;
/**
1. 这里使用的是原始数据, 所以是 dates * first, 而格式化后的应该是 dates * value 把所有的 first 换成 value
2. colors: 自己可定义, 看是否可以使用对象(以方便日后指定关键词的颜色对应)
3. 上边数据中注释掉的是超出了 keywordTrend最小值和最大值范围之外的数据, 导致线太长出去了
*/
class Series extends React.Component {
state={
}
render() {
//平均值数组 value平均值
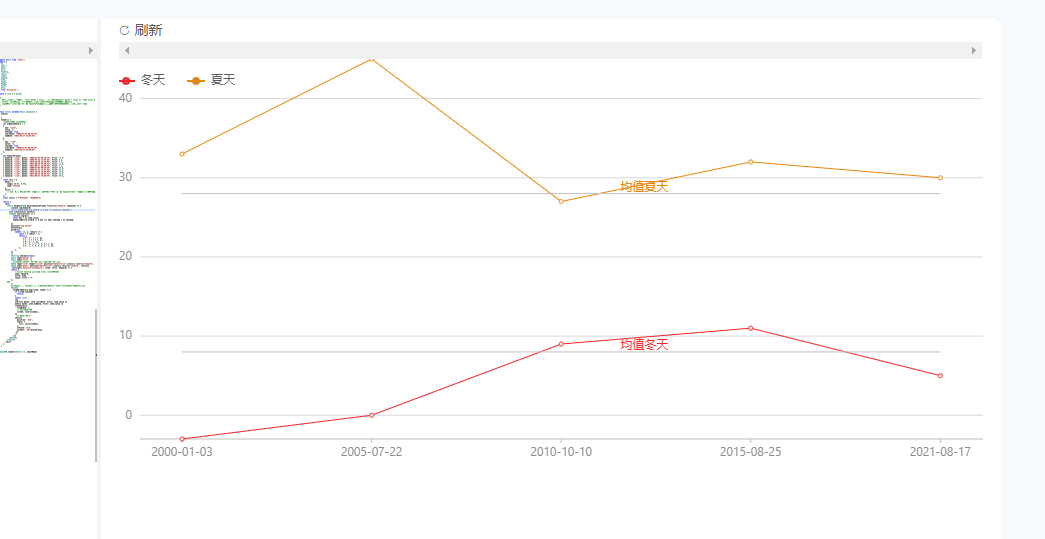
let avgSpreadScore = [
{
key: "冬天",
value: 8,
checked: true,
startDate: "2000-01-03 00:39:29",
endDate: "2021-08-17 18:06:55",
},
{
key: "夏天",
value: 28,
checked: true,
startDate: "2000-01-03 00:39:29",
endDate: "2021-08-17 18:06:55",
},
]
let keywordTrend=[
{ keyword: "冬天", dates: "2000-01-03 00:39:29", first: -3 },
{ keyword: "冬天", dates: "2005-07-22 13:57:24", first: 0 },
{ keyword: "冬天", dates: "2010-10-10 19:40:08", first: 9 },
{ keyword: "冬天", dates: "2015-08-25 20:59:11", first: 11 },
{ keyword: "冬天", dates: "2021-08-17 18:06:55", first: 5 },
{ keyword: "夏天", dates: "2000-01-03 00:39:29", first: 33 },
{ keyword: "夏天", dates: "2005-07-22 13:57:24", first: 45 },
{ keyword: "夏天", dates: "2010-10-10 19:40:08", first: 27 },
{ keyword: "夏天", dates: "2015-08-25 20:59:11", first: 32 },
{ keyword: "夏天", dates: "2021-08-17 18:06:55", first: 30 },
]
const cols = {
dates: {
range: [0.05, 0.95],
type:'timeCat'
},
first: {
// min: 0,// 这里要设置一个最小值, 否则可能图表中按照了 keywordTrend 中的最小值设置Y轴最小值
}
};
const colors = ["#f72525", "#ea870b"];
return (
<div>
<Chart height={400} data={keywordTrend} filter={[['keyword',(keyword) => {
console.log(keyword)
return avgSpreadScore.find(d => d.key === keyword).checked;
}]]} scale={cols} autoFit>
<Legend onClick={(ev) => {
console.log(ev);
const key = ev.item.value;
avgSpreadScore.find(d => d.key === key).checked = ev.checked;
}}
position="top-center"
offsetY={8}
marker={{
symbol: (x, y, radius) => {
const r = radius / 2;
return [
['M', x - 3 * r, y],
['L', x + 3 * r, y],
['M', x - r, y],
['A', r, r, 0, 0, 0, x + r, y],
['A', r, r, 0, 0, 0, x - r, y],
];
},
}}
/>
<Tooltip shared={true}/>
<Axis name="dates" />
<Axis name="first" />
{/*shape="smooth" 可配置为曲线,不设置为折线*/}
<Geom type="line" shape="circle" position="dates*first" size={1} color={['keyword', colors]} />
<Geom type="point" position="dates*first" size={2} color={['keyword', colors]}
tooltip={['dates*first*keyword', (time, first, keyword) => {
return {
//自定义 tooltip 上显示的 title 显示内容等。
name: keyword,
title: time,
value: first + '°'
};
}]}
/>
{/*<Geom/> 和 <Guide/> 是独立控制的,可以通过chart filter来建立交互联动*/}
<Guide>
{avgSpreadScore.map((item, index) => {
if (!item.checked) {
return;
}
return <Line
top
start={{ dates: item.startDate, first: item.value }}
end={{ dates: item.endDate, first: item.value }}
lineStyle={{
lineWidth: 2,
// 手动维护颜色
stroke: colors[index],
}}
/** 调整位置 */
text={{
position: 'end',
style: {
fill: colors[index],
},
offsetX: -320,
content: `均值${item.key}`
}}
/>
})}
</Guide>
</Chart>
</div>
);
}
}
ReactDOM.render(<Series />, mountNode)
