1 Kibana的显示配置
https://demo.elastic.co/app/kibana#/dashboard/welcome_dashboard
环境先处理干净

安装nginx和httpd-tools
2 使用压测工具产生日志
[root@node4 ~]# ab -n 100 -c 100 http://192.168.132.134/
This is ApacheBench, Version 2.3 <$Revision: 1430300 $>
Copyright 1996 Adam Twiss, Zeus Technology Ltd, http://www.zeustech.net/
Licensed to The Apache Software Foundation, http://www.apache.org/

Benchmarking 192.168.132.134 (be patient).....done


Server Software:        nginx/1.16.1
Server Hostname:        192.168.132.134
Server Port:            80

Document Path:          /
Document Length:        612 bytes

Concurrency Level:      100
Time taken for tests:   0.011 seconds
Complete requests:      100
Failed requests:        0
Write errors:           0
Total transferred:      84500 bytes
HTML transferred:       61200 bytes
Requests per second:    9071.12 [#/sec] (mean)
Time per request:       11.024 [ms] (mean)
Time per request:       0.110 [ms] (mean, across all concurrent requests)
Transfer rate:          7485.44 [Kbytes/sec] received

Connection Times (ms)
              min  mean[+/-sd] median   max
Connect:        0    3   0.5      3       3
Processing:     2    3   1.1      2       5
Waiting:        0    3   1.2      2       5
Total:          4    6   0.7      5       7
WARNING: The median and mean for the total time are not within a normal deviation
        These results are probably not that reliable.

Percentage of the requests served within a certain time (ms)
  50%      5
  66%      6
  75%      6
  80%      7
  90%      7
  95%      7
  98%      7
  99%      7
 100%      7 (longest request)
[root@node4 ~]# tail -f /usr/local/nginx/logs/access.log
192.168.132.181 - - [18/Jan/2020:21:47:23 -0500] "GET / HTTP/1.0" 200 612 "-" "ApacheBench/2.3"
192.168.132.181 - - [18/Jan/2020:21:47:23 -0500] "GET / HTTP/1.0" 200 612 "-" "ApacheBench/2.3"
192.168.132.181 - - [18/Jan/2020:21:47:23 -0500] "GET / HTTP/1.0" 200 612 "-" "ApacheBench/2.3"
3 安装filebeat
[root@node4 src]# wget https://artifacts.elastic.co/downloads/beats/filebeat/filebeat-7.5.1-x86_64.rpm
[root@node4 src]# rpm -ivh filebeat-7.5.1-x86_64.rpm
[root@node4 src]# rpm -qc filebeat

[root@node4 src]# cd /etc/filebeat/
[root@node4 filebeat]# cp filebeat.yml /opt/
[root@node4 filebeat]# grep -Ev "^$|[#;]" filebeat.yml
filebeat.inputs:
- type: log
  enabled: true
  paths:
    - /usr/local/nginx/logs/access.log
filebeat.config.modules:
  path: ${path.config}/modules.d/*.yml
  reload.enabled: false
setup.template.settings:
  index.number_of_shards: 1
setup.kibana:
output.elasticsearch:
  hosts: ["192.168.132.131:9200","192.168.132.132:9200","192.168.132.133:9200"]
processors:
  - add_host_metadata: ~
  - add_cloud_metadata: ~
  - add_docker_metadata: ~
  - add_kubernetes_metadata: ~
[root@node4 filebeat]# systemctl restart filebeat

使用kibana查看
访问:http://192.168.132.131:5601/app/kibana
对于一些基本的操作,再前面的学习中已经演示,参看前面的学习实验
4 配置nginx的日志改为json格式
log_format access_json '{"@timestamp":"$time_iso8601",'
                           '"host":"$server_addr",'
                           '"clientip":"$remote_addr",'
                           '"size":$body_bytes_sent,'
                           '"responsetime":$request_time,'
                           '"upstreamtime":"$upstream_response_time",'
                           '"upstreamhost":"$upstream_addr",'
                           '"http_host":"$host",'
                           '"url":"$uri",'
                           '"domain":"$host",'
                           '"xff":"$http_x_forwarded_for",'
                           '"referer":"$http_referer",'
                           '"status":"$status"}';
添加日志格式
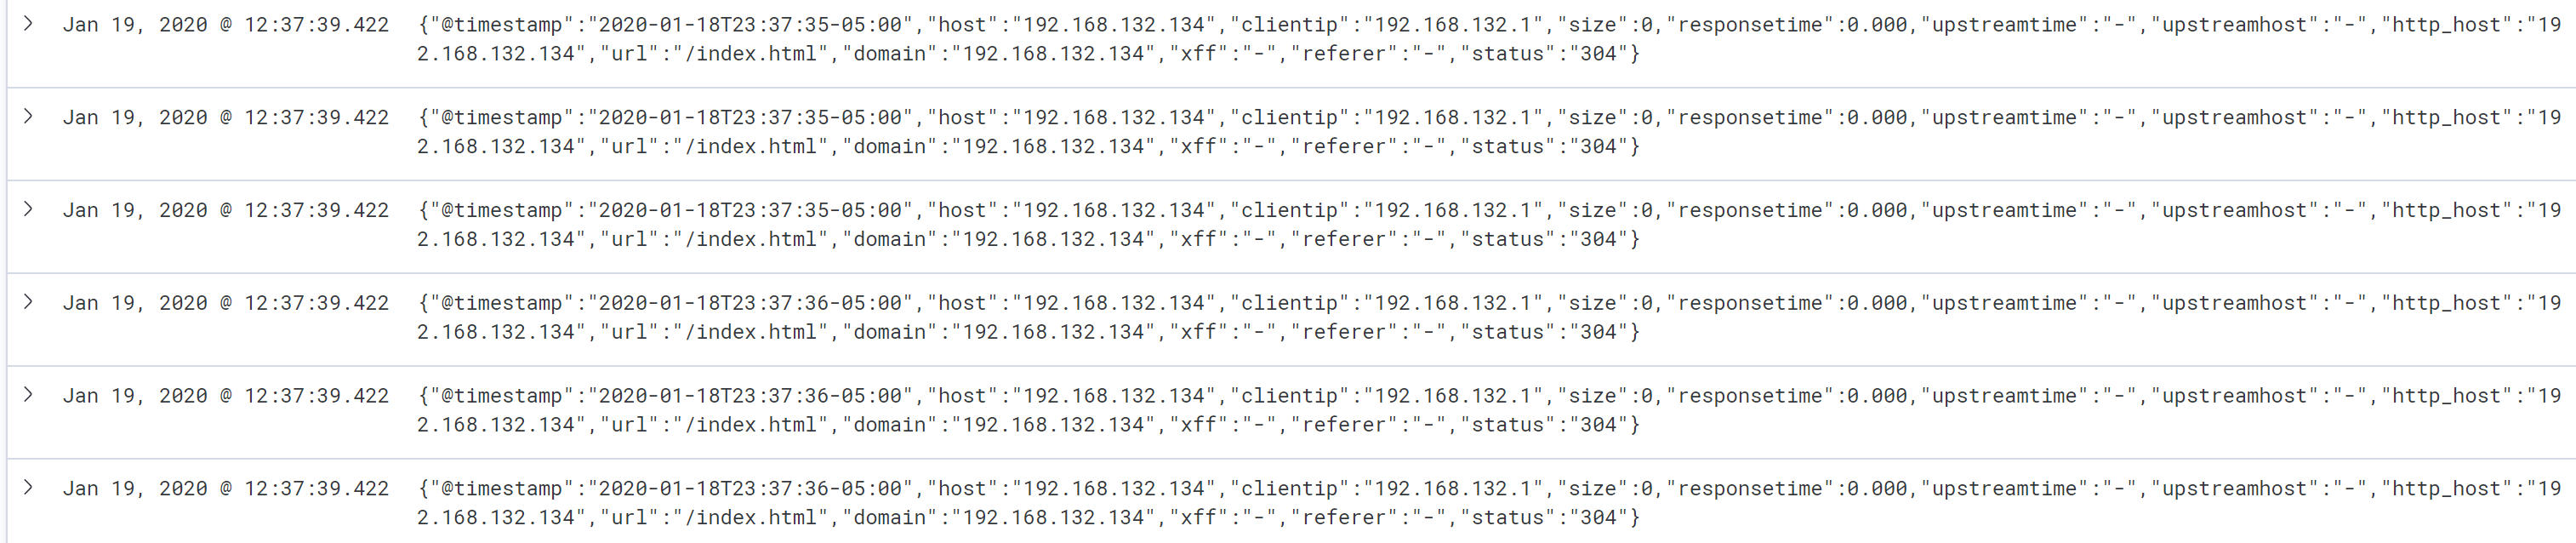
访问后
{"@timestamp":"2020-01-18T23:33:57-05:00","host":"192.168.132.134","clientip":"192.168.132.1","size":0,"responsetime":0.000,"upstreamtime":"-","upstreamhost":"-","http_host":"192.168.132.134","url":"/index.html","domain":"192.168.132.134","xff":"-","referer":"-","status":"304"}
安装jq工具
[root@node4 filebeat]# yum -y install jq
[root@node4 ~]# tail -f /usr/local/nginx/logs/access.log |jq .

但是读取的依然是整个的message日志
5 filebeat解析成json格式
[root@node4 ~]# grep -Ev "^$|[#;]" /etc/filebeat/filebeat.yml
filebeat.inputs:
- type: log
  enabled: true
  paths:
    - /usr/local/nginx/logs/access.log
  json.key_under_root: true
  json.overwrite_keys: true
filebeat.config.modules:
  path: ${path.config}/modules.d/*.yml
  reload.enabled: false
setup.template.settings:
  index.number_of_shards: 1
setup.kibana:
output.elasticsearch:
  hosts: ["192.168.132.131:9200","192.168.132.132:9200","192.168.132.133:9200"]
processors:
  - add_host_metadata: ~
  - add_cloud_metadata: ~
  - add_docker_metadata: ~
  - add_kubernetes_metadata: ~
[root@node4 ~]# systemctl restart filebeat
得到格式的日志
ES原始数据
{
"_index": "filebeat-7.5.1",
"_type": "_doc",
"_id": "oq03vG8BcnOPLK2r_2wa",
"_version": 1,
"_score": 1,
"_source": {
"@timestamp": "2020-01-19T05:13:02.912Z",
"json": {
"upstreamtime": "-",
"host": "192.168.132.134",
"@timestamp": "2020-01-19T00:13:01-05:00",
"Agent": "Mozilla/5.0 (Windows NT 10.0; Win64; x64) AppleWebKit/537.36 (KHTML, like Gecko) Chrome/79.0.3945.117 Safari/537.36",
"clientip": "192.168.132.1",
"domain": "192.168.132.134",
"http_host": "192.168.132.134",
"status": "304",
"referer": "-",
"xff": "-",
"responsetime": 0,
"url": "/index.html",
"size": 0,
"upstreamhost": "-"
},
"input": {
"type": "log"
},
"ecs": {
"version": "1.1.0"
},
"host": {
"name": "node4",
"hostname": "node4",
"architecture": "x86_64",
"os": {
"platform": "centos",
"version": "7 (Core)",
"family": "redhat",
"name": "CentOS Linux",
"kernel": "3.10.0-957.27.2.el7.x86_64",
"codename": "Core"
},
"id": "a833bbe7e3634c75ab1b427c4049d056",
"containerized": false
},
"agent": {
"ephemeral_id": "bab448ec-726f-48bf-aa62-0b8fe39c2684",
"hostname": "node4",
"id": "3d856c84-4859-4b20-a25f-4b6c1a8a8108",
"version": "7.5.1",
"type": "filebeat"
},
"log": {
"file": {
"path": "/usr/local/nginx/logs/access.log"
},
"offset": 15601
}
}
}
Kibana显示
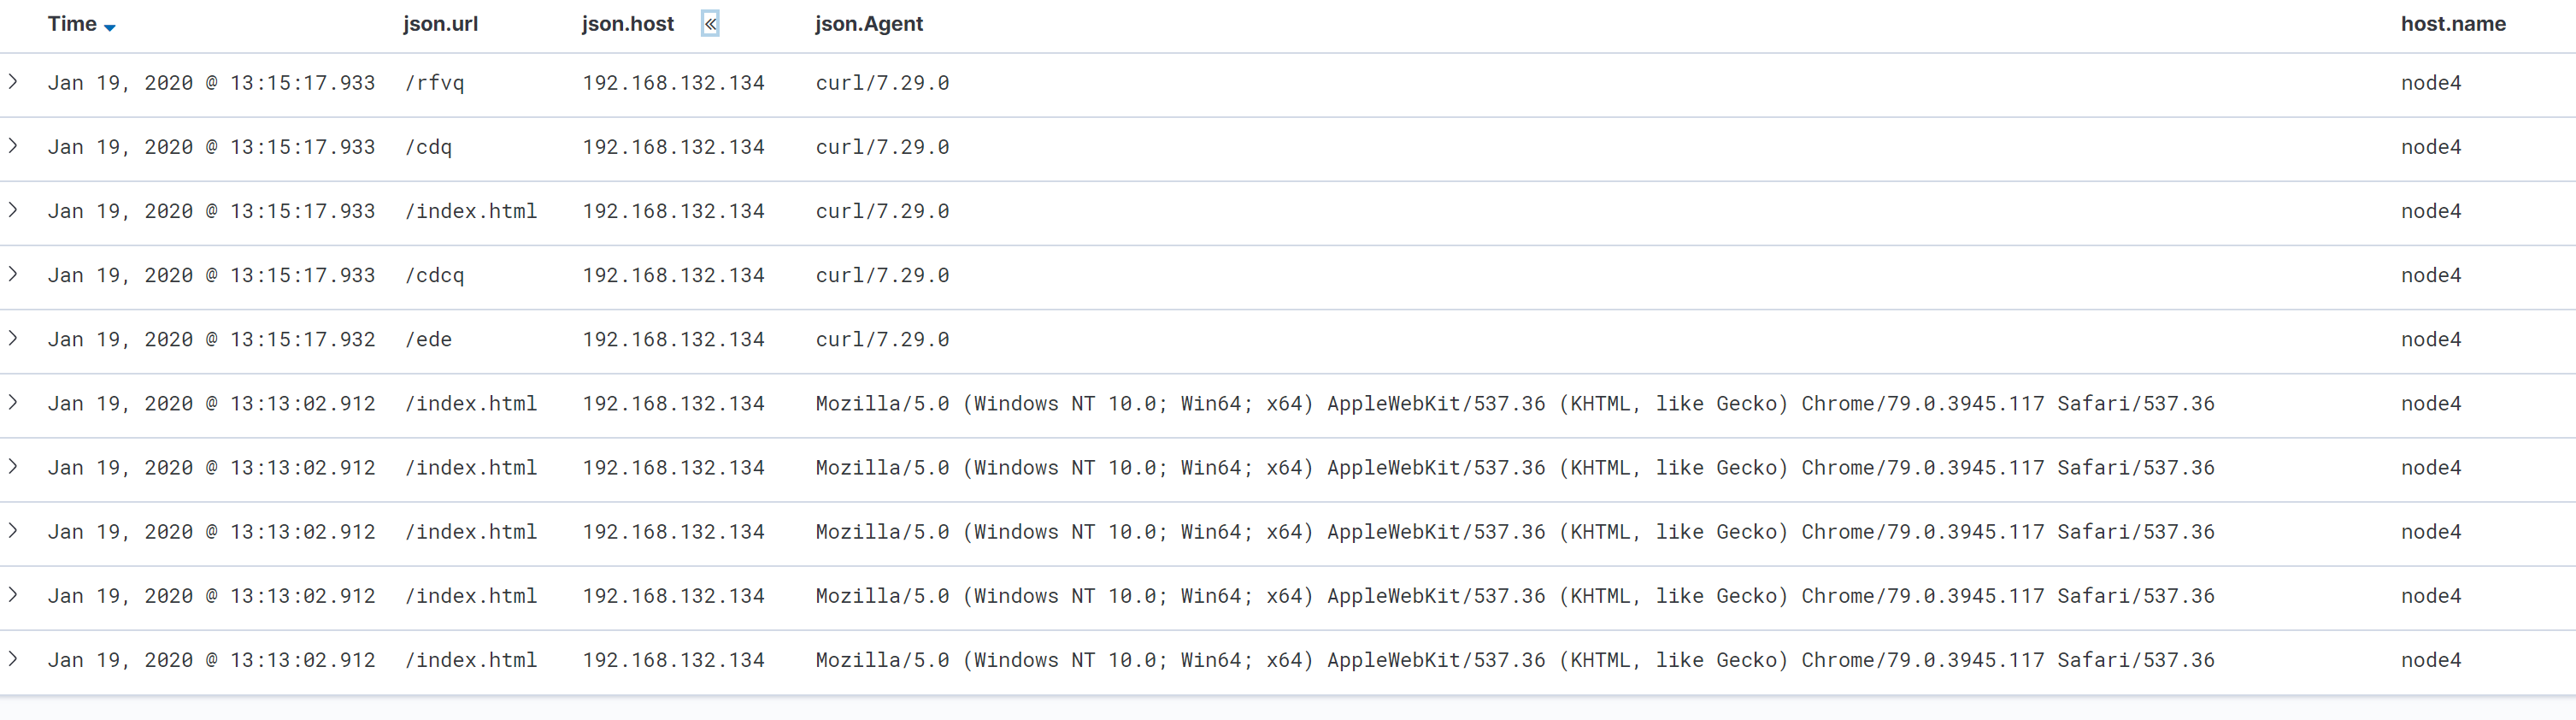
使用json格式收集nginx的日志介绍到这里