背景:负责基于区块链的某公正项目的状态上报模块设计编码,基于Prometheus进行二次开发
1、说明
Prometheus 是一个开源的服务监控软件,它通过 HTTP 协议从远程机器收集数据并存储在本
地的时序数据库上。Prometheus 通过安装在远程机器上的 exporter 来收集监控数据。
目前用到两个 exporter:
a、node exporter,用于收集系统数据
b、mysqld exporter, 用于收集 Mysql 数据
下面本地的相关路径、用户名、密码、参数配置仅作例子。
2、安装 Prometheus
a、下载
wget
https://github.com/prometheus/prometheus/releases/download/v1.6.3/prometheus-
1.6.3.linux-amd64.tar.gz -O prometheus-1.6.3.linux-amd64.tar.gz
b、解压
mkdir /usr/local/services/prometheus
tar zxf prometheus-1.6.3.linux-amd64.tar.gz -C /usr/local/services/prometheus –
strip-components=1
3、配置 Prometheus
在安装目录下编辑配置文件 prometheus.yml,host 是主机 IP,端口对应 exporter 监
听端口
global:
scrape_interval:
15s
evaluation_interval: 15s
scrape_configs:
- job_name: XXX1system
static_configs:
- targets: ['host:9103']
labels:
instance: XXX1system
- job_name: XXX1mysql
static_configs:
- targets: ['host:9104']
labels:
instance: XXX1mysql
- job_name: XXX2system
static_configs:
- targets: ['host:9103']
labels:
instance: XXX2system
- job_name: XXX2mysql
static_configs:
- targets: ['host:9104']
labels:
instance: XXX2mysql
同理。。。。。。。。。。。。。。。。。。。。。。。。。。。。
4、运行 Prometheus
./prometheus -web.listen-address “:9092”
5、部署 exporter
a、下载
wget https://github.com/prometheus/node_exporter/releases/download/v0.14.0/node_exporter-0.14.0.linux-amd64.tar.gz -O node_exporter-0.14.0.linux-amd64.tar.gz
wget https://github.com/prometheus/mysqld_exporter/releases/download/v0.10.0/mysqld_exporter-0.10.0.linux-amd64.tar.gz -O mysqld_exporter-0.10.0.linux-amd64.tar.gz
b、解压
tar zxf node_exporter-0.14.0.linux-amd64.tar.gz -C /usr/local/services/prometheus_exporters --strip-components=1
tar zxf mysqld_exporter-0.10.0.linux-amd64.tar.gz -C /usr/local/services/prometheus_exporters –strip-components=1
c、运行
cd /usr/local/services/prometheus_exporters
node exporter 直接运行即可
./node_exporter -web.listen-address “:9103”
cd /usr/local/services/prometheus_exporters
创建.my.cnf 文件
cat << EOF > .my.cnf
[client]
user=root
password=1qaz@WSX3edc$RFVyl
EOF
现在可以运行 mysqld exporter
./mysqld_exporter -config.my-cnf=".my.cnf"
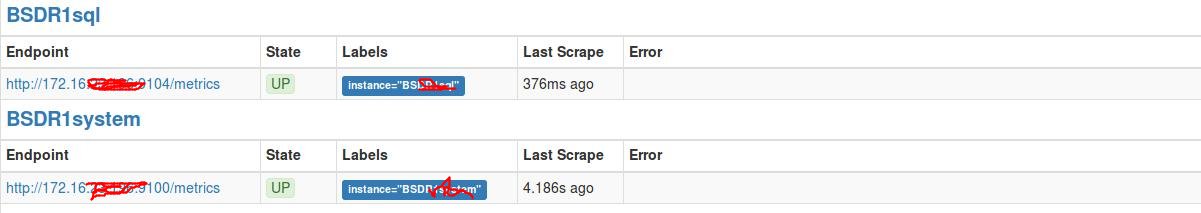
6、检验
Prometheus 内置了一个 web 界面,我们可以通过 http://FBAAR 的 ip:9092 进行访问。访问界面,在
Status->Targets 下,看到 Target 的状态变为 up 时,说明 Prometheus 可正常接收 exporter 的数据
了