ELKStack之极速入门(上)
链接:https://pan.baidu.com/s/1V2aYpB86ZzxL21Hf-AF1rA
提取码:7izv
复制这段内容后打开百度网盘手机App,操作更方便哦
1. EKL介绍
1.1 需求背景
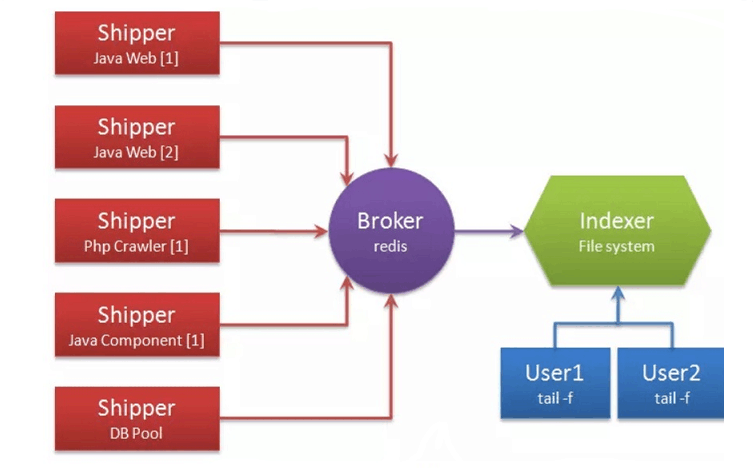
- 一般我们需要进行日志分析场景:直接在日志文件中 grep、awk 就可以获得自己想要的信息。但在规模较大的场景中,此方法效率低下,面临问题包括日志量太大如何归档、文本搜索太慢怎么办、如何多维度查询。需要集中化的日志管理,所有服务器上的日志收集汇总。常见解决思路是建立集中式日志收集系统,将所有节点上的日志统一收集,管理,访问。
- 一般大型系统是一个分布式部署的架构,不同的服务模块部署在不同的服务器上,问题 出现时,大部分情况需要根据问题暴露的关键信息,定位到具体的服务器和服务模块, 构建一套集中式日志系统,可以提高定位问题的效率。
- 一个完整的集中式日志系统,需要包含以下几个主要特点:
(1)收集-能够采集多种来源的日志数据
(2)传输-能够稳定的把日志数据传输到中央系统
(3)存储-如何存储日志数据
(4)分析-可以支持 UI 分析
(5)警告-能够提供错误报告,监控机制- ELK提供了一整套解决方案,并且都是开源软件,之间互相配合使用,完美衔接,高效的 满足了很多场合的应用。目前主流的一种日志系统。
1.2 ELKStack介绍

- Logstash : 开源的服务器端数据处理管道,能够同时从多个来源采集数据,转换数据, 然后将数据存储到数据库中。
- Elasticsearch:搜索,分析和存储数据,分布式数据库。
- Kibana:数据可视化。
- Beats:轻量型采集器的平台,从边缘机器向Logstash和Elasticsearch发送数据。
- Filebeat:轻量型日志采集器。
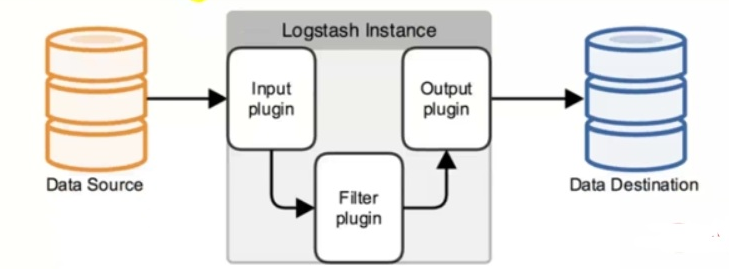
1.3 ELK Stack架构
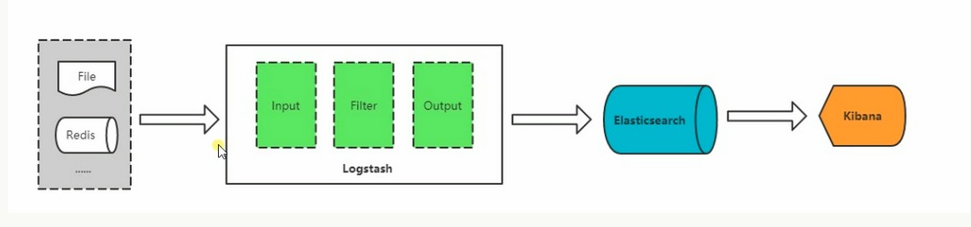
- Input:输入,输出数据可以是Stdin,File,TCP,Redis,Syslog等
- Filter:过滤,将日志格式化。有丰富的过滤插件:Grok正则捕获,Date时间处 理,Json编码解码,Mutate数据修改等
- Output:输出,输出目标可以是Stdout,File,TCP,Redis,ES等
2. elk的安装与部署
2.1 准备工作
| 主机名 | 主机IP |
|---|---|
| ELK-kibana | 192.168.200.15 |
2.2 安装环境
[root@ELK-Kibana ~]# cat /etc/redhat-release
CentOS Linux release 7.6.1810 (Core)
[root@ELK-Kibana ~]# uname -r
3.10.0-957.12.1.el7.x86_64
[root@ELK-Kibana ~]#
[root@ELK-Kibana ~]# systemctl stop firewalld
[root@ELK-Kibana ~]# systemctl disable firewalld
[root@ELK-Kibana ~]# setenforce 0
setenforce: SELinux is disabled

[root@ELK-Kibana ~]# ll /root/yuanmabao/
总用量 462332
-rw-r--r-- 1 root root   9621331 8月  23 14:46 apache-tomcat-8.5.33.tar.gz
-rw-r--r-- 1 root root  29050159 8月  23 14:46 elasticsearch-6.2.3.tar.gz
-rw-r--r-- 1 root root  30948737 8月  23 14:46 GeoLite2-City.tar.gz
-rw-r--r-- 1 root root 181238643 8月  23 14:46 jdk-8u60-linux-x64.tar.gz
-rw-r--r-- 1 root root  83426328 8月  23 14:46 kibana-6.2.3-linux-x86_64.tar.gz
-rw-r--r-- 1 root root 138221072 8月  23 14:46 logstash-6.2.3.tar.gz
-rw-r--r-- 1 root root    910812 8月  23 14:46 nginx-1.10.2.tar.gz
2.3 安装jdk环境
[root@ELK-Kibana ~]# cd yuanmabao/
[root@ELK-Kibana yuanmabao]# tar xf jdk-8u60-linux-x64.tar.gz -C /usr/local/
[root@ELK-Kibana yuanmabao]# mv /usr/local/jdk1.8.0_60 /usr/local/jdk
[root@ELK-Kibana yuanmabao]# ll -d /usr/local/jdk
drwxr-xr-x 8 10 143 255 8月   5 2015 /usr/local/jdk
2.4 配置java环境变量
[root@ELK-Kibana yuanmabao]# sed -i.ori '$a export JAVA_HOME=/usr/local/jdk
export PATH=$PATH:$JAVA_HOME/bin
export CLASSPATH=.:$JAVA_HOME/lib/tools.jar:$JAVA_HOME/lib/dt.jar:$CLASSPATH' /etc/profile
[root@ELK-Kibana yuanmabao]# tail -3 /etc/profile
export JAVA_HOME=/usr/local/jdk
export PATH=$PATH:$JAVA_HOME/bin
export CLASSPATH=.:$JAVA_HOME/lib/tools.jar:$JAVA_HOME/lib/dt.jar:$CLASSPATH


[root@ELK-Kibana yuanmabao]# source /etc/profile
[root@ELK-Kibana yuanmabao]# java -version
java version "1.8.0_60"
Java(TM) SE Runtime Environment (build 1.8.0_60-b27)
Java HotSpot(TM) 64-Bit Server VM (build 25.60-b23, mixed mode)
3. kibana的安装和启动
3.1 kibana简介
- kibana的用途:主要用来展现数据,它本身不存储数据
- kibana的下载地址:https://artifacts.elastic.co/downloads/kibana/kibana-6.2.3-linux-x86_64.tar.gz
3.2 编译部署kibana
[root@ELK-Kibana yuanmabao]# useradd -s /sbin/nologin -M elk
[root@ELK-Kibana yuanmabao]# id elk
uid=1000(elk) gid=1000(elk) 组=1000(elk)


[root@ELK-Kibana yuanmabao]# tar xf kibana-6.2.3-linux-x86_64.tar.gz -C /usr/local/
[root@ELK-Kibana yuanmabao]# mv /usr/local/kibana-6.2.3-linux-x86_64 /usr/local/kibana
[root@ELK-Kibana yuanmabao]# ll -d /usr/local/kibana
drwxrwxr-x 12 elk elk 232 3月  13 2018 /usr/local/kibana
3.3 kibana配置文件修改
#修改前的配置文件
[root@ELK-Kibana yuanmabao]# cat -n /usr/local/kibana/config/kibana.yml | sed -n   '2p;7p;21p;39p;40p'
     2	#server.port: 5601
     7	#server.host: "localhost"
    21	#elasticsearch.url: "http://localhost:9200"
    39	#elasticsearch.username: "user"
    40	#elasticsearch.password: "pass"
#修改后的配置文件
[root@ELK-Kibana yuanmabao]# vim /usr/local/kibana/config/kibana.yml
[root@ELK-Kibana yuanmabao]# cat -n /usr/local/kibana/config/kibana.yml | sed -n   '2p;7p;21p;39p;40p'
     2	server.port: 5601            #暂时就先修改这两行
     7	server.host: "0.0.0.0"       #暂时就先修改这两行
    21	#elasticsearch.url: "http://localhost:9200"
    39	#elasticsearch.username: "user"
    40	#elasticsearch.password: "pass"
3.4 将kibana目录的属主,属组修改为elk
[root@ELK-Kibana yuanmabao]# chown -R elk:elk /usr/local/kibana/
3.5 新增启动脚本
[root@ELK-Kibana yuanmabao]# vim /usr/local/kibana/bin/start.sh
[root@ELK-Kibana yuanmabao]# cat /usr/local/kibana/bin/start.sh
nohup /usr/local/kibana/bin/kibana >> /tmp/kibana.log 2>> /tmp/kibana.log &

[root@ELK-Kibana yuanmabao]# chmod a+x /usr/local/kibana/bin/start.sh
[root@ELK-Kibana yuanmabao]# ll -d /usr/local/kibana/bin/start.sh
-rwxr-xr-x 1 root root 76 8月  23 15:19 /usr/local/kibana/bin/start.sh
3.6 用普通用户降权启动kibana
[root@ELK-Kibana yuanmabao]# su -s /bin/bash elk '/usr/local/kibana/bin/start.sh'
[root@ELK-Kibana yuanmabao]# ps -ef | grep elk | grep -v grep
elk        7051      1 19 15:20 pts/0    00:00:02 /usr/local/kibana/bin/../node/bin/node --no-warnings /usr/local/kibana/bin/../src/cli
3.7 查看错误日志
[root@ELK-Kibana yuanmabao]# cat /tmp/kibana.log | grep warning | head
{"type":"log","@timestamp":"2019-08-23T07:20:53Z","tags":["warning","elasticsearch","admin"],"pid":7051,"message":"Unable to revive connection: http://localhost:9200/"}
{"type":"log","@timestamp":"2019-08-23T07:20:53Z","tags":["warning","elasticsearch","admin"],"pid":7051,"message":"No living connections"}
{"type":"log","@timestamp":"2019-08-23T07:20:56Z","tags":["warning","elasticsearch","admin"],"pid":7051,"message":"Unable to revive connection: http://localhost:9200/"}
{"type":"log","@timestamp":"2019-08-23T07:20:56Z","tags":["warning","elasticsearch","admin"],"pid":7051,"message":"No living connections"}
{"type":"log","@timestamp":"2019-08-23T07:20:58Z","tags":["warning","elasticsearch","admin"],"pid":7051,"message":"Unable to revive connection: http://localhost:9200/"}
{"type":"log","@timestamp":"2019-08-23T07:20:58Z","tags":["warning","elasticsearch","admin"],"pid":7051,"message":"No living connections"}
{"type":"log","@timestamp":"2019-08-23T07:21:01Z","tags":["warning","elasticsearch","admin"],"pid":7051,"message":"Unable to revive connection: http://localhost:9200/"}
{"type":"log","@timestamp":"2019-08-23T07:21:01Z","tags":["warning","elasticsearch","admin"],"pid":7051,"message":"No living connections"}
{"type":"log","@timestamp":"2019-08-23T07:21:03Z","tags":["warning","elasticsearch","admin"],"pid":7051,"message":"Unable to revive connection: http://localhost:9200/"}
{"type":"log","@timestamp":"2019-08-23T07:21:03Z","tags":["warning","elasticsearch","admin"],"pid":7051,"message":"No living connections"}
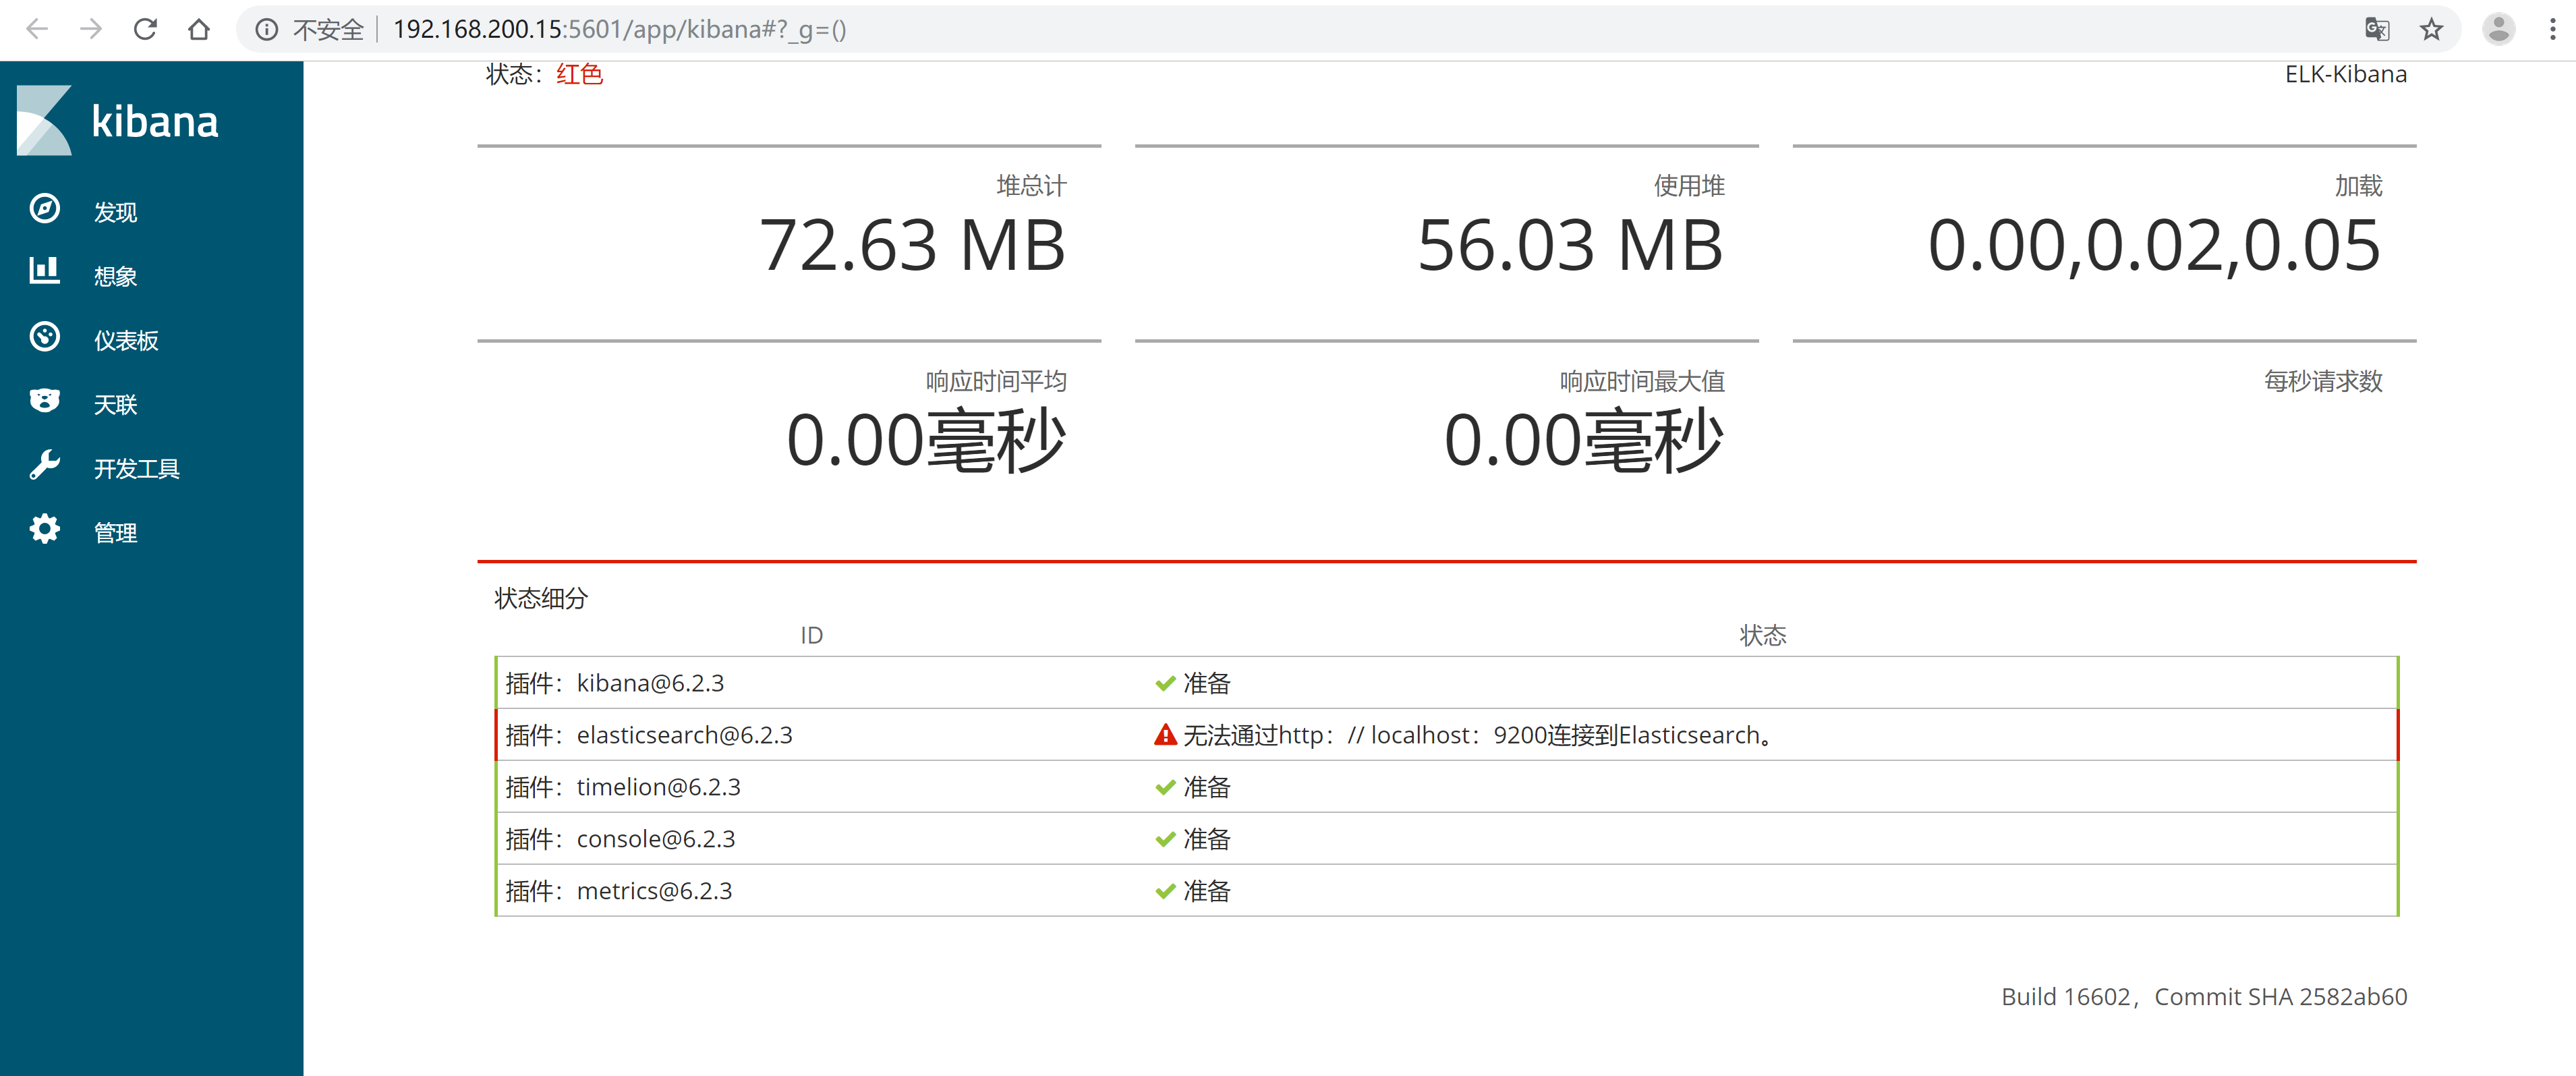
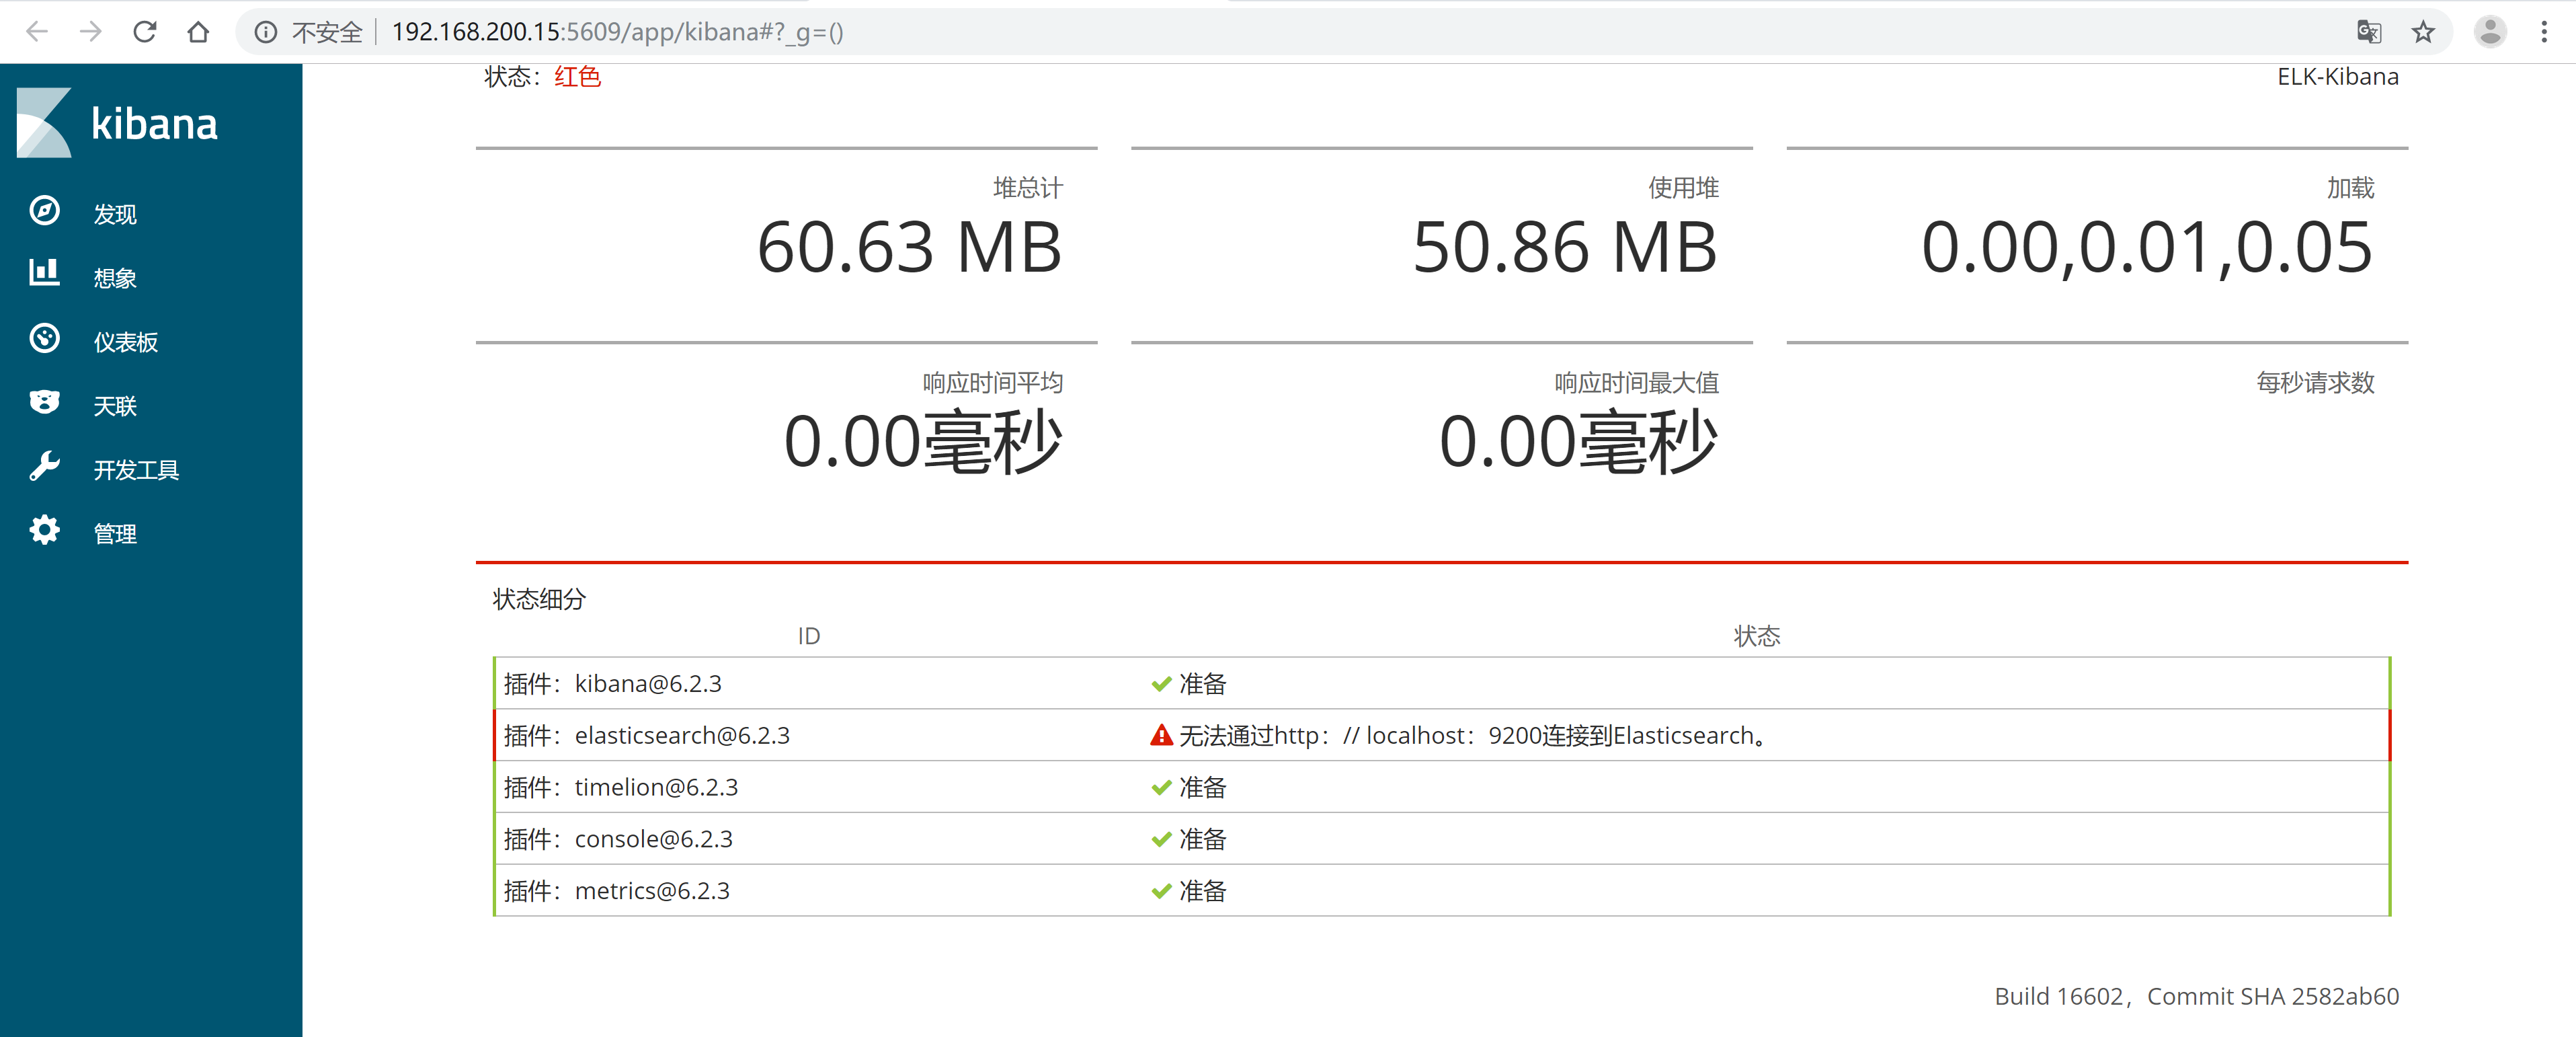
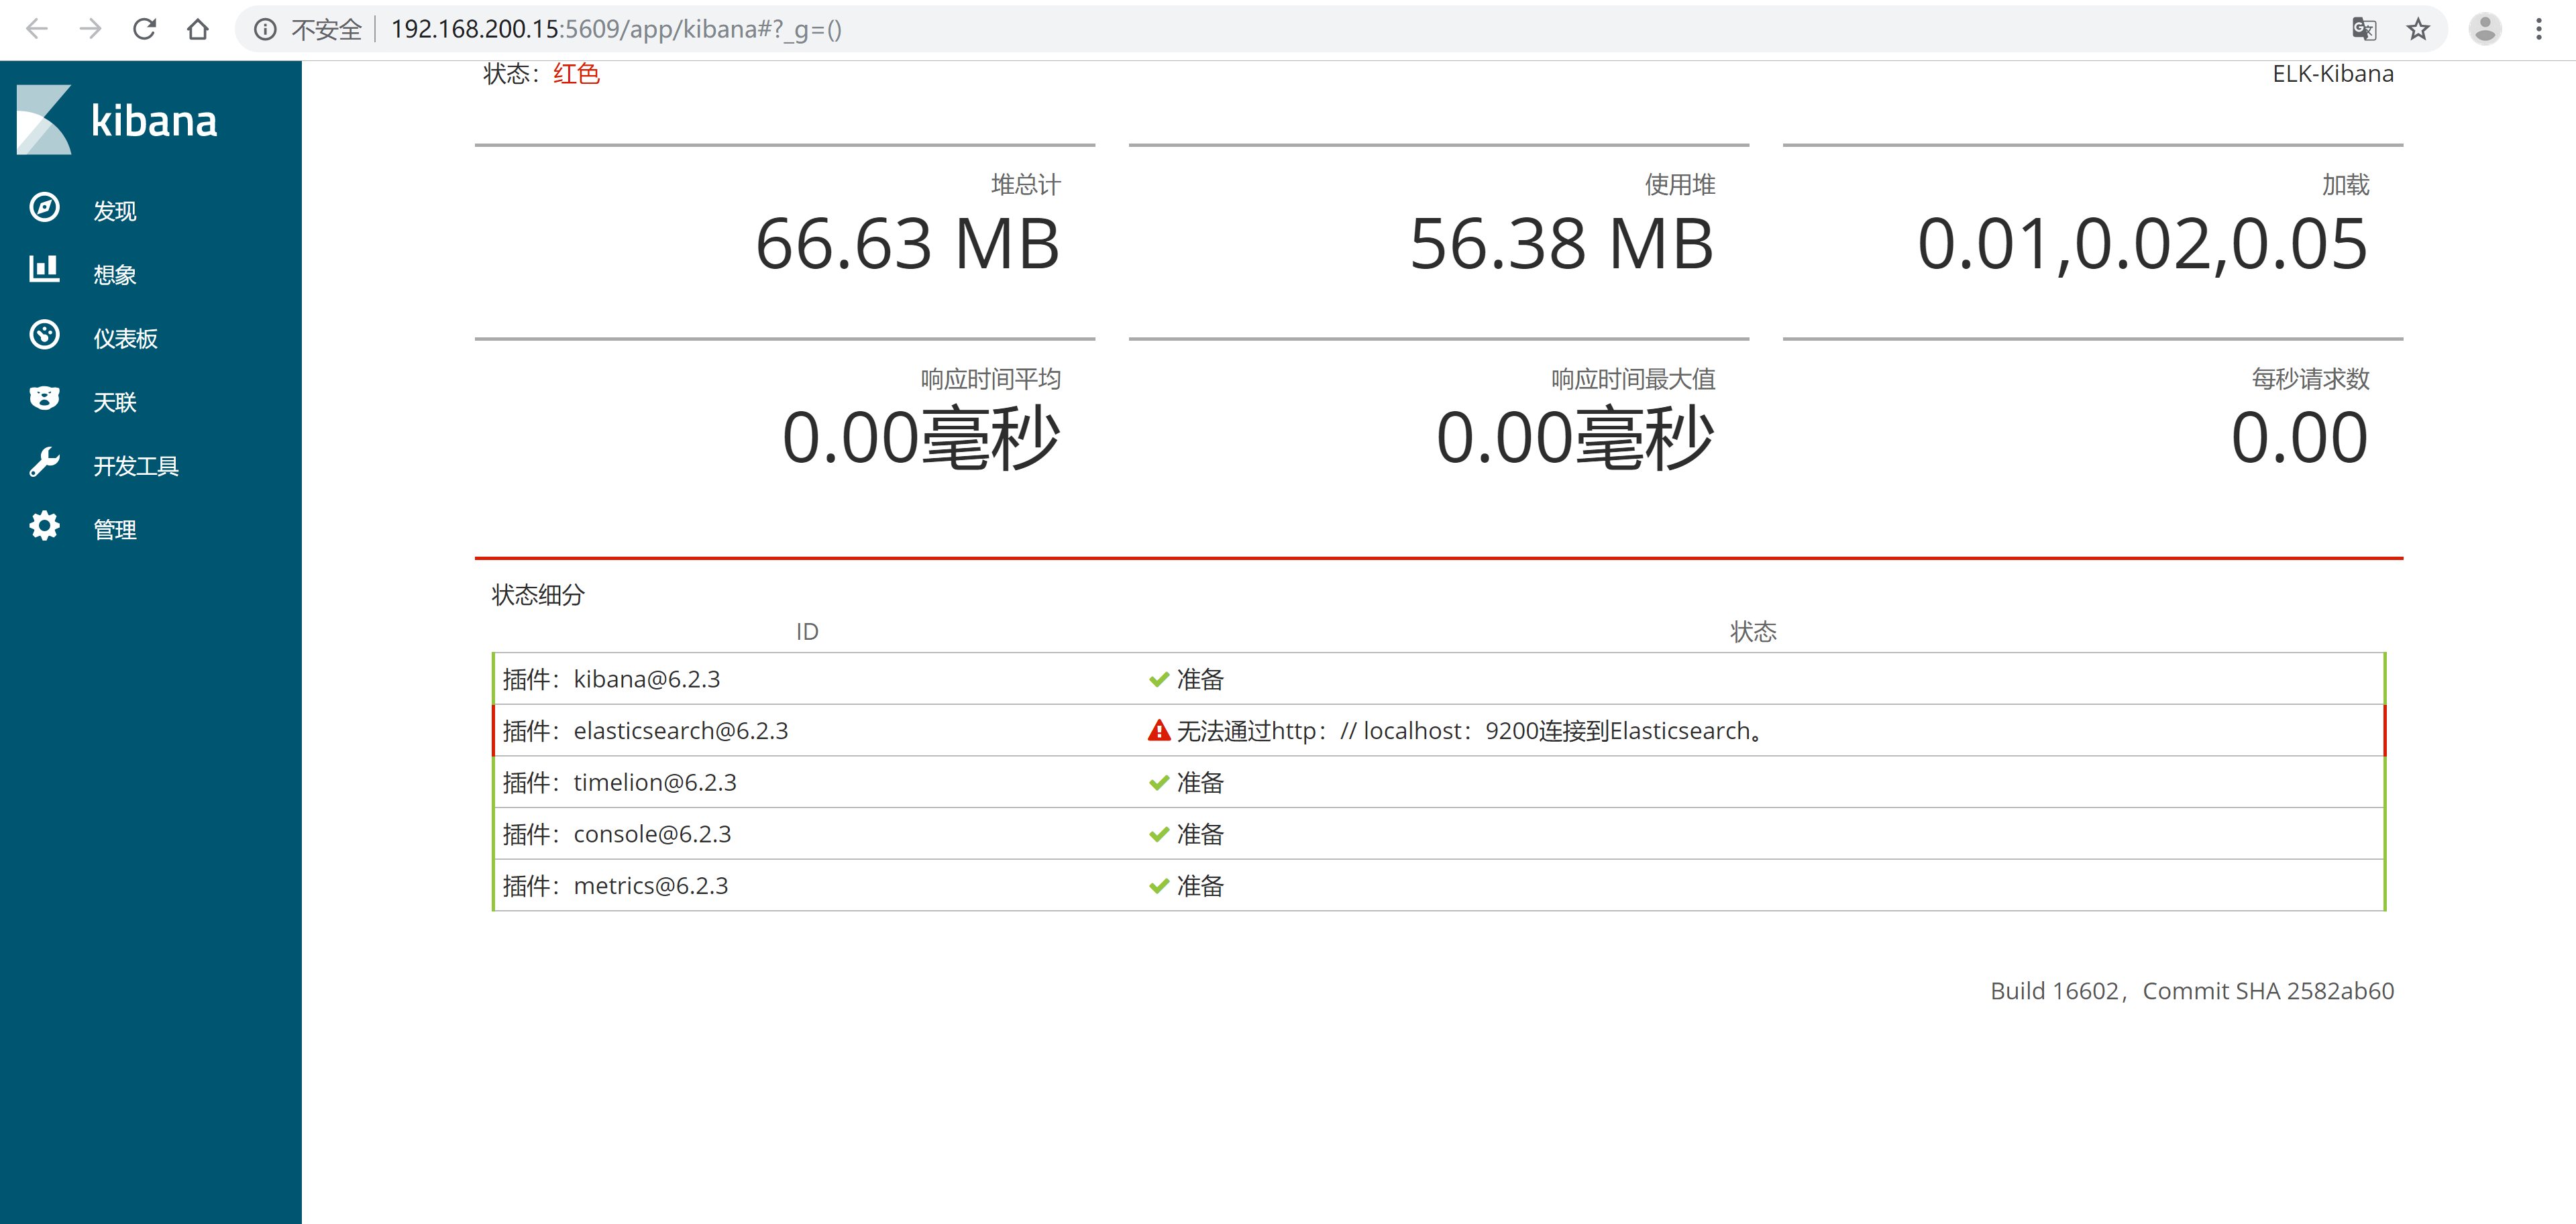
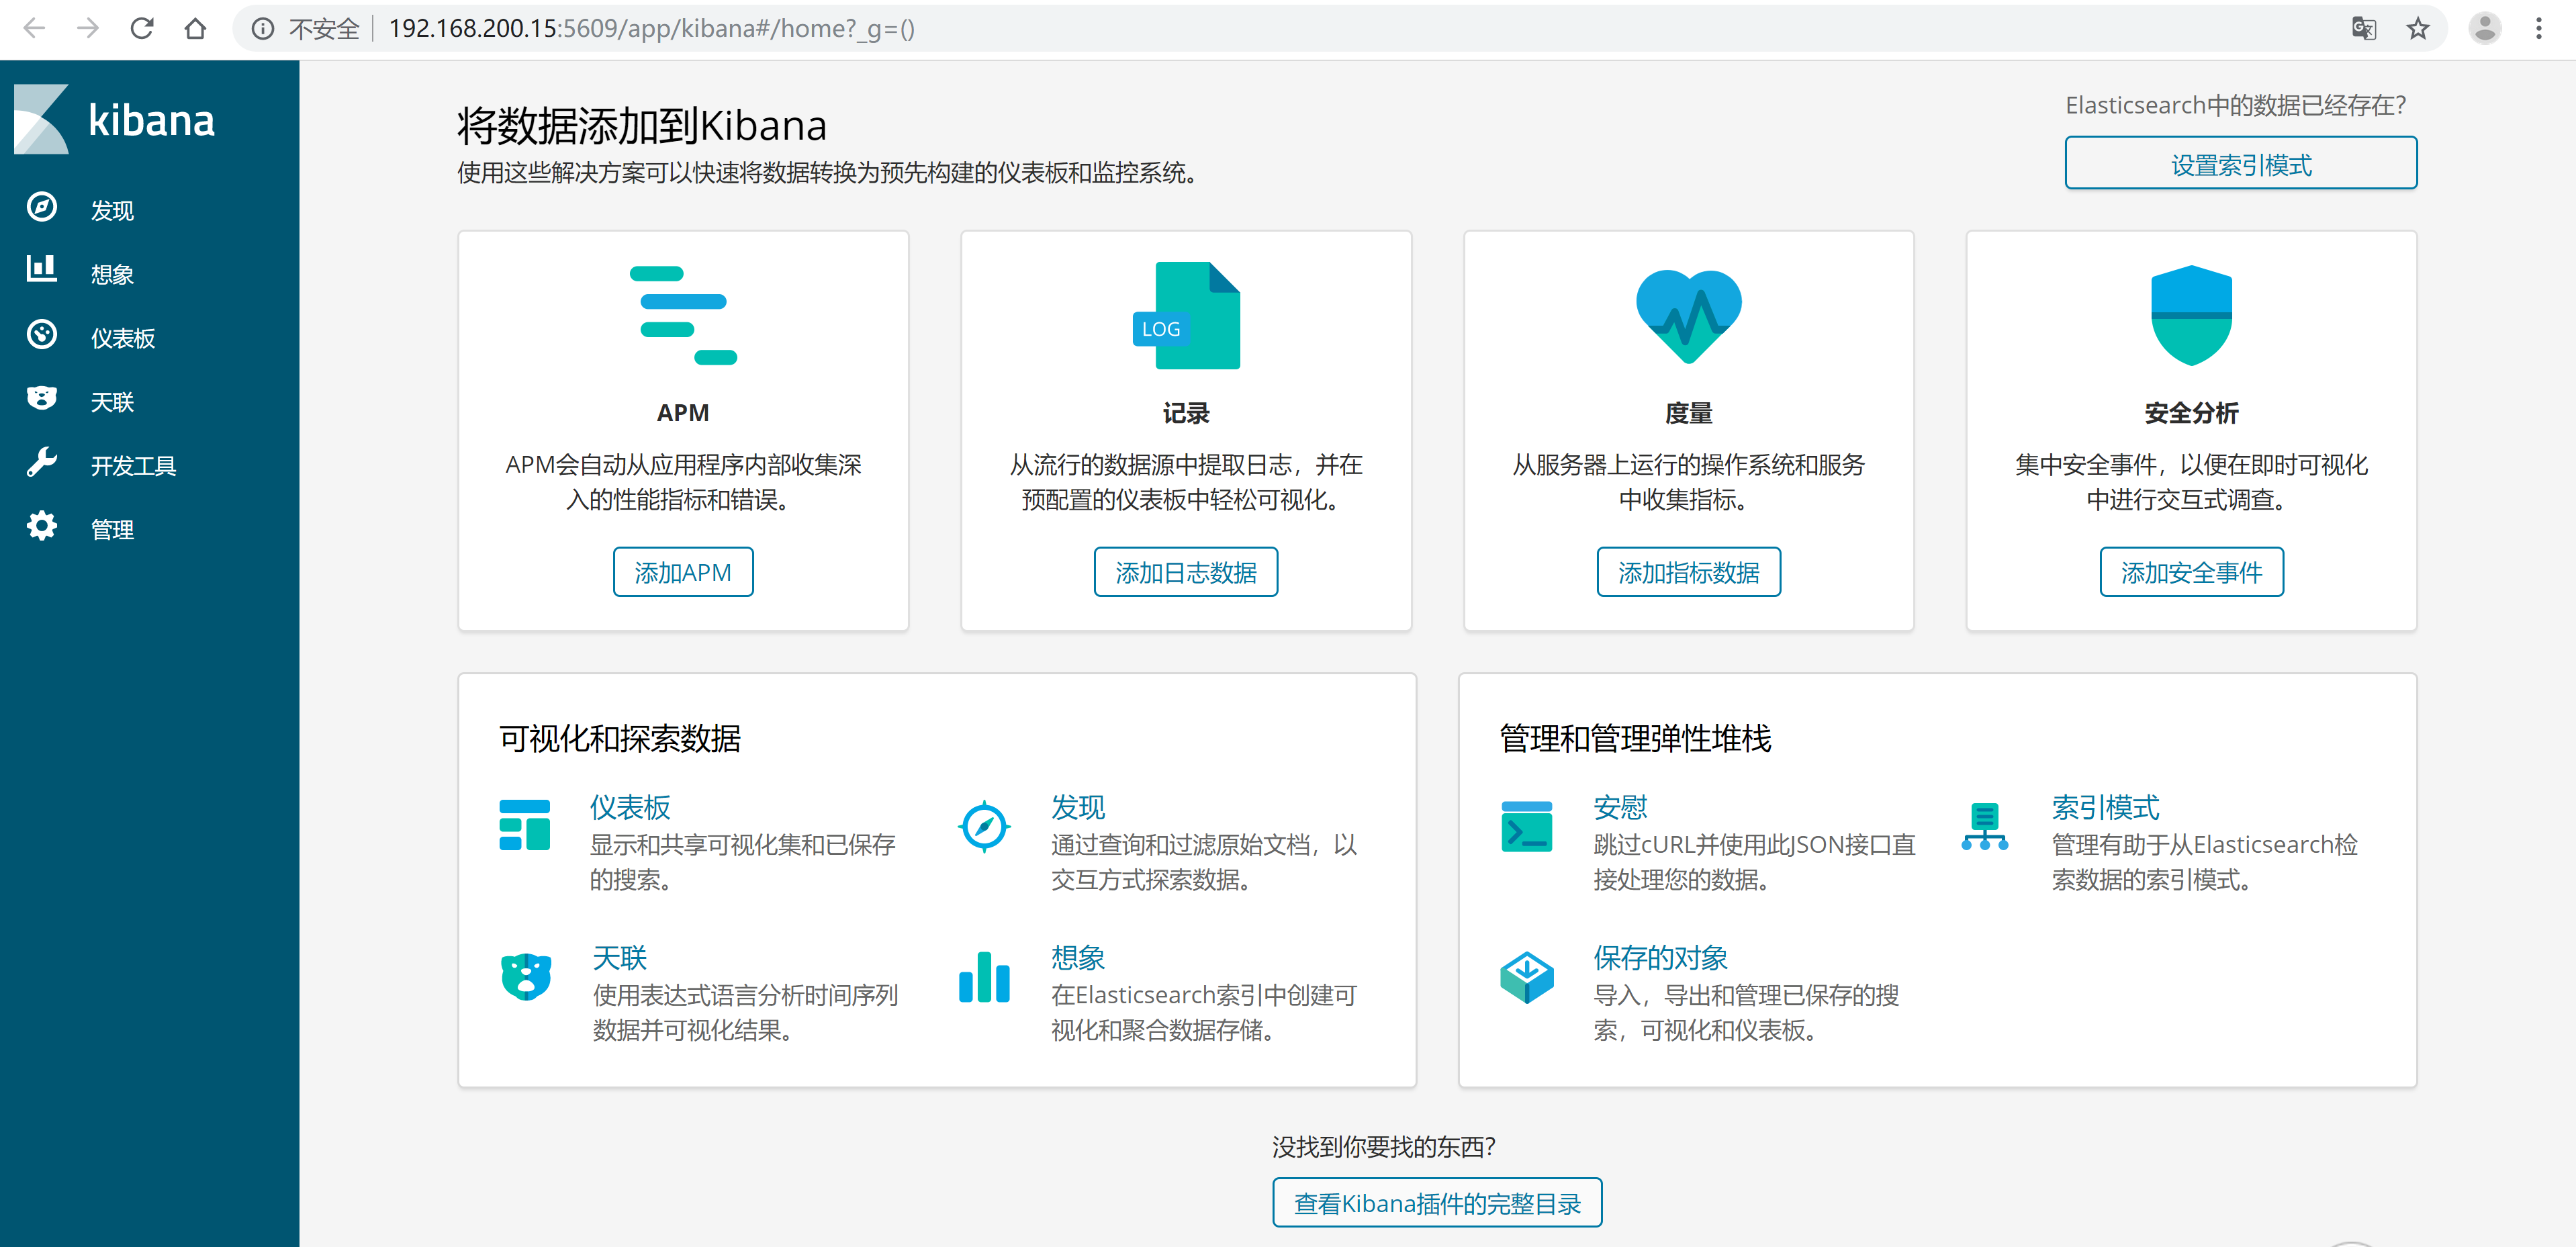
3.8 访问kibana
4. 使用nginx来限制访问kibana
4.1 使用nginx转发kibana
由于kibana没有权限控制,可以借助nginx来部署认证和进行ip控制
4.1.1 修改kibana的配置文件,改为监听127.0.0.1
[root@ELK-Kibana yuanmabao]# vim /usr/local/kibana/config/kibana.yml
[root@ELK-Kibana yuanmabao]# sed -n '7p' /usr/local/kibana/config/kibana.yml
server.host: "127.0.0.1"
4.1.2 重启kibana服务
[root@ELK-Kibana yuanmabao]# ps -ef | grep elk | grep -v grep
elk        7051      1  0 15:24 pts/0    00:00:10 /usr/local/kibana/bin/../node/bin/node --no-warnings /usr/local/kibana/bin/../src/cli
[root@ELK-Kibana yuanmabao]# kill -9 7051

[root@ELK-Kibana yuanmabao]# su -s /bin/bash elk '/usr/local/kibana/bin/start.sh'
[root@ELK-Kibana yuanmabao]# ps -ef | grep elk | grep -v grep
elk        7143      1 69 16:25 pts/1    00:00:02 /usr/local/kibana/bin/../node/bin/node --no-warnings /usr/local/kibana/bin/../src/cli
4.2 借助nginx来限制访问,控制源IP的访问
4.2.1 编译安装nginx
#安装依赖包
[root@ELK-Kibana yuanmabao]# yum -y install pcre-devel openssl-devel
[root@ELK-Kibana yuanmabao]# rpm -qa pcre-devel openssl-devel
pcre-devel-8.32-17.el7.x86_64
openssl-devel-1.0.2k-16.el7_6.1.x86_64
#编译安装nginx
[root@ELK-Kibana yuanmabao]# useradd -s /sbin/nologin -M  nginx
[root@ELK-Kibana yuanmabao]# id nginx
uid=1001(nginx) gid=1001(nginx) 组=1001(nginx)

[root@ELK-Kibana yuanmabao]# tar xf nginx-1.10.2.tar.gz -C /usr/src/
[root@ELK-Kibana yuanmabao]# cd /usr/src/nginx-1.10.2/
[root@ELK-Kibana nginx-1.10.2]# ./configure --user=nginx --group=nginx --prefix=/usr/local/nginx --with-http_stub_status_module --with-http_ssl_module
#以下省略若干。。。

[root@ELK-Kibana nginx-1.10.2]# make && make install
#以下省略若干。。。
[root@ELK-Kibana nginx-1.10.2]# ln -s /usr/local/nginx/sbin/* /usr/local/sbin/
[root@ELK-Kibana nginx-1.10.2]# nginx -V
nginx version: nginx/1.10.2
built by gcc 4.8.5 20150623 (Red Hat 4.8.5-36) (GCC)
built with OpenSSL 1.0.2k-fips  26 Jan 2017
TLS SNI support enabled
configure arguments: --user=nginx --group=nginx --prefix=/usr/local/nginx --with-http_stub_status_module --with-http_ssl_module
4.2.2 编辑nginx配置文件,进行访问控制,并启动nginx
[root@ELK-Kibana nginx-1.10.2]# cd /usr/local/nginx/
[root@ELK-Kibana nginx]# cp conf/nginx.conf{,.bak}
[root@ELK-Kibana nginx]# vim conf/nginx.conf
[root@ELK-Kibana nginx]# cat conf/nginx.conf
worker_processes  1;
events {
    worker_connections  1024;
}
http {
    include       mime.types;
    default_type  application/octet-stream;
    log_format main '$remote_addr - $remote_user [$time_local]  "$request"'
    '$status $body_bytes_sent "$http_referer"'
    '"$http_user_agent""$http_x_forwarded_for"';
    sendfile        on;
    keepalive_timeout  65;
    server {
        listen       5609;
        access_log /usr/local/nginx/logs/kibana_access.log main;
        error_log /usr/local/nginx/logs/kibana_error.log error;
    location / {
        allow 192.168.200.1;
        deny all;
        proxy_pass http://127.0.0.1:5601;
        }
    }
}

[root@ELK-Kibana nginx]# nginx -t
nginx: the configuration file /usr/local/nginx/conf/nginx.conf syntax is ok
nginx: configuration file /usr/local/nginx/conf/nginx.conf test is successful
[root@ELK-Kibana nginx]# nginx
[root@ELK-Kibana nginx]# netstat -antup | grep nginx
tcp        0      0 0.0.0.0:5609            0.0.0.0:*               LISTEN      9709/nginx: master
4.3 访问nginx监听端口5609:http://192.168.200.15:5609
4.4 如果访问IP经常改变,授权就会很麻烦。可以利用nginx的访问验证功能来认证访问
4.4.1 修改nginx配置文件
[root@ELK-Kibana nginx]# vim conf/nginx.conf
[root@ELK-Kibana nginx]# cat conf/nginx.conf
worker_processes  1;
events {
    worker_connections  1024;
}
http {
    include       mime.types;
    default_type  application/octet-stream;
    log_format main '$remote_addr - $remote_user [$time_local]  "$request"'
    '$status $body_bytes_sent "$http_referer"'
    '"$http_user_agent""$http_x_forwarded_for"';
    sendfile        on;
    keepalive_timeout  65;
    server {
        listen       5609;
        access_log /usr/local/nginx/logs/kibana_access.log main;
        error_log /usr/local/nginx/logs/kibana_error.log error;
    location / {
        auth_basic "elk auth";                                   #修改这两行
        auth_basic_user_file /usr/local/nginx/conf/htpasswd;     #修改这两行
        proxy_pass http://127.0.0.1:5601;
        }
    }
}
[root@ELK-Kibana nginx]# nginx -t
nginx: the configuration file /usr/local/nginx/conf/nginx.conf syntax is ok
nginx: configuration file /usr/local/nginx/conf/nginx.conf test is successful
[root@ELK-Kibana nginx]# nginx -s reload
4.4.2 配置nginx登录密码
[root@ELK-Kibana nginx]# yum -y install httpd
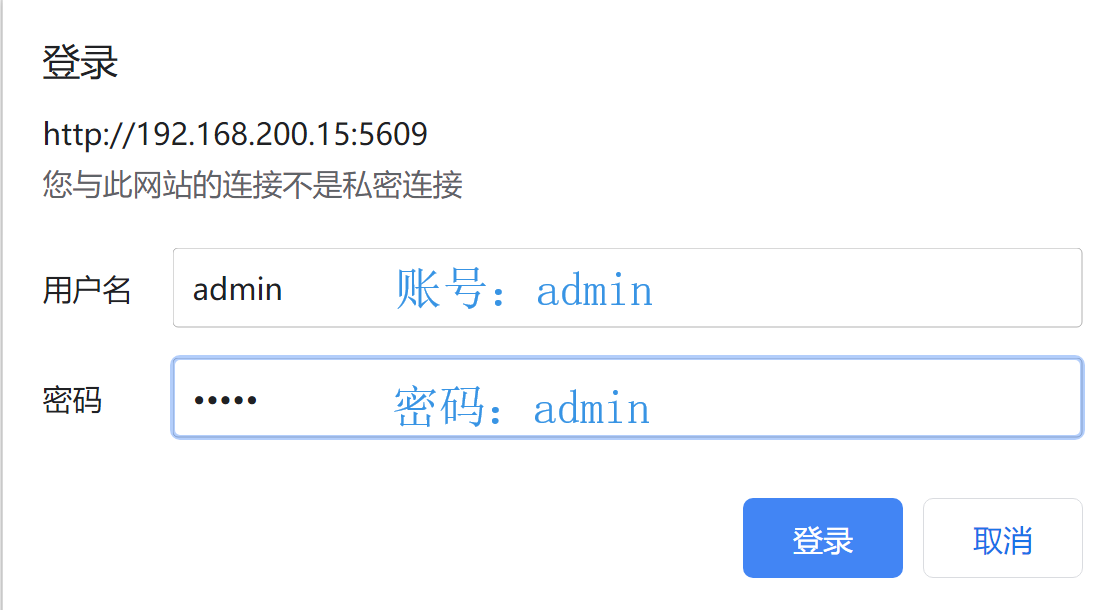
[root@ELK-Kibana nginx]# htpasswd -c /usr/local/nginx/conf/htpasswd admin #账号
New password:
Re-type new password:
Adding password for user admin #密码
4.4.3 再次访问nginx网址:http://192.168.200.15:5609
5. elasticsearch的安装和启动
elasticsearch未安装之前,kibana网页上报错,提示找不到elasticsearch
5.1 elasticsearch简介
- elasticsearch用途:elastic search主要用来存储数据,供kibana调取并进行展现
- elasticsearch下载地址:https://artifacts.elastic.co/downloads/elasticsearch/elasticsearch-6.2.3.tar.gz
5.2 解压部署elasticsearch
[root@ELK-Kibana nginx]# cd /root/yuanmabao/
[root@ELK-Kibana yuanmabao]# tar xf elasticsearch-6.2.3.tar.gz -C /usr/local/
[root@ELK-Kibana yuanmabao]# mv /usr/local/elasticsearch-6.2.3 /usr/local/elasticsearch
[root@ELK-Kibana yuanmabao]# ll -d /usr/local/elasticsearch
drwxr-xr-x 8 root root 143 3月  13 2018 /usr/local/elasticsearch
5.3 elasticsearch配置
#修改前的配置文件中的代码
[root@ELK-Kibana yuanmabao]# cat -n /usr/local/elasticsearch/config/elasticsearch.yml | sed -n '33p;37p;55p;59p'
    33	#path.data: /path/to/data
    37	#path.logs: /path/to/logs
    55	#network.host: 192.168.0.1
    59	#http.port: 9200
#修改后的配置文件中的代码
[root@ELK-Kibana yuanmabao]# vim /usr/local/elasticsearch/config/elasticsearch.yml
[root@ELK-Kibana yuanmabao]# cat -n /usr/local/elasticsearch/config/elasticsearch.yml | sed -n '33p;37p;55p;59p'
    33	path.data: /usr/local/elasticsearch/data
    37	path.logs: /usr/local/elasticsearch/logs
    55	network.host: 127.0.0.1
    59	http.port: 9200
5.4 把elasticsearch目录的用户和属主都更新为elk
[root@ELK-Kibana yuanmabao]# chown -R elk:elk /usr/local/elasticsearch/
5.5 更改jvm的内存限制(看个人配置,这里未做修改)
[root@elk config]# cat jvm.options | sed -n "22p;23p"
-Xms1g
-Xmx1g
5.6 编辑elasticsearch启动脚本,并在后台启动
[root@ELK-Kibana yuanmabao]# cd /usr/local/elasticsearch/bin/
[root@ELK-Kibana bin]# vim start.sh
[root@ELK-Kibana bin]# cat start.sh
#/bin/bash
#--Mr.yang--
/usr/local/elasticsearch/bin/elasticsearch -d >> /tmp/elasticsearch.log 2>> /tmp/elasticsearch.log

[root@ELK-Kibana bin]# chmod a+x start.sh
[root@ELK-Kibana bin]# ll -d start.sh
-rwxr-xr-x 1 root root 124 8月  23 17:24 start.sh
5.7 降权启动elasticsearch
[root@ELK-Kibana bin]# su -s /bin/bash elk start.sh
[root@ELK-Kibana bin]# ps -ef | grep elk | grep -v grep
elk        7143      1  0 16:25 pts/1    00:00:14 /usr/local/kibana/bin/../node/bin/node --no-warnings /usr/local/kibana/bin/../src/cli
elk        9852      1 36 17:25 pts/1    00:00:02 /usr/local/jdk/bin/java -Xms1g -Xmx1g -XX:+UseConcMarkSweepGC -XX:CMSInitiatingOccupancyFraction=75 -XX:+UseCMSInitiatingOccupancyOnly -XX:+AlwaysPreTouch -Xss1m -Djava.awt.headless=true -Dfile.encoding=UTF-8 -Djna.nosys=true -XX:-OmitStackTraceInFastThrow -Dio.netty.noUnsafe=true -Dio.netty.noKeySetOptimization=true -Dio.netty.recycler.maxCapacityPerThread=0 -Dlog4j.shutdownHookEnabled=false -Dlog4j2.disable.jmx=true -Djava.io.tmpdir=/tmp/elasticsearch.kNCsRtq1 -XX:+HeapDumpOnOutOfMemoryError -XX:+PrintGCDetails -XX:+PrintGCDateStamps -XX:+PrintTenuringDistribution -XX:+PrintGCApplicationStoppedTime -Xloggc:logs/gc.log -XX:+UseGCLogFileRotation -XX:NumberOfGCLogFiles=32 -XX:GCLogFileSize=64m -Des.path.home=/usr/local/elasticsearch -Des.path.conf=/usr/local/elasticsearch/config -cp /usr/local/elasticsearch/lib/* org.elasticsearch.bootstrap.Elasticsearch -d
5.8 观察日志,看看kibana日志还会不会报elasticsearch错误
[root@ELK-Kibana bin]# tail -f /tmp/kibana.log
{"type":"response","@timestamp":"2019-08-23T09:28:55Z","tags":[],"pid":7143,"method":"get","statusCode":200,"req":{"url":"/app/kibana","method":"get","headers":{"host":"127.0.0.1:5601","connection":"close","cache-control":"max-age=0","upgrade-insecure-requests":"1","user-agent":"Mozilla/5.0 (Windows NT 10.0; Win64; x64) AppleWebKit/537.36 (KHTML, like Gecko) Chrome/76.0.3809.100 Safari/537.36","accept":"text/html,application/xhtml+xml,application/xml;q=0.9,image/webp,image/apng,*/*;q=0.8,application/signed-exchange;v=b3","referer":"http://192.168.200.15:5609/app/kibana","accept-encoding":"gzip, deflate","accept-language":"zh-CN,zh;q=0.9"},"remoteAddress":"127.0.0.1","userAgent":"127.0.0.1","referer":"http://192.168.200.15:5609/app/kibana"},"res":{"statusCode":200,"responseTime":52,"contentLength":9},"message":"GET /app/kibana 200 52ms - 9.0B"}
6. logstash的安装和启动
6.1 logstash简介
- logstash用途:用来读取日志,正则分析日志,发送给elasticsearch数据库
- logstash下载地址:https://artifacts.elastic.co/downloads/logstash/logstash-6.2.3.tar.gz
6.2 解压部署logstash
[root@ELK-Kibana bin]# cd /root/yuanmabao/
[root@ELK-Kibana yuanmabao]# tar xf logstash-6.2.3.tar.gz -C /usr/local/
[root@ELK-Kibana yuanmabao]#  mv /usr/local/logstash-6.2.3 /usr/local/logstash
[root@ELK-Kibana yuanmabao]# ll -d /usr/local/logstash
drwxr-xr-x 11 root root 237 8月  23 17:55 /usr/local/logstash
6.3 logstash jvm配置简介,加入内存限制(这里看个人配置,这里没有修改)
[root@ELK-Kibana yuanmabao]# cat -n /usr/local/logstash/config/jvm.options | sed -n  '6p;7p;'
     6	-Xms1g
     7	-Xmx1g
6.4 新建logstash配置文件(默认没有)
[root@ELK-Kibana yuanmabao]# vim /usr/local/logstash/config/logstash.conf
[root@ELK-Kibana yuanmabao]# cat /usr/local/logstash/config/logstash.conf
#/bin/bash
#--Mr.yang--
input {
    file {
        path => "/usr/local/nginx/logs/kibana_access.log"    #读取日志路径
   }
}
output {
     elasticsearch {
         hosts => ["http://127.0.0.1:9200"]    #保存日志
    }
}
6.5 新建logstash的启动脚本
[root@ELK-Kibana yuanmabao]# cd /usr/local/logstash/bin/
[root@ELK-Kibana bin]# vim start.sh
[root@ELK-Kibana bin]# cat start.sh
#/bin/bash
#--Mr.yang--
nohup /usr/local/logstash/bin/logstash -f /usr/local/logstash/config/logstash.conf >> /tmp/logstash.log 2>>/tmp/logstash.log &

[root@ELK-Kibana bin]# chmod a+x start.sh
[root@ELK-Kibana bin]# ll -d start.sh
-rwxr-xr-x 1 root root 152 8月  23 18:13 start.sh
6.6 启动logstash
#logstash并没有监听端口,因此不需要用elk用户来启动

[root@ELK-Kibana bin]# /usr/local/logstash/bin/start.sh
[root@ELK-Kibana bin]# ps -ef | grep logstash | grep -v grep
root       9964      1 23 18:15 pts/2    00:00:54 /usr/local/jdk/bin/java -Xms1g -Xmx1g -XX:+UseParNewGC -XX:+UseConcMarkSweepGC -XX:CMSInitiatingOccupancyFraction=75 -XX:+UseCMSInitiatingOccupancyOnly -Djava.awt.headless=true -Dfile.encoding=UTF-8 -Djruby.compile.invokedynamic=true -Djruby.jit.threshold=0 -XX:+HeapDumpOnOutOfMemoryError -Djava.security.egd=file:/dev/urandom -cp /usr/local/logstash/logstash-core/lib/jars/animal-sniffer-annotations-1.14.jar:/usr/local/logstash/logstash-core/lib/jars/commons-compiler-3.0.8.jar:/usr/local/logstash/logstash-core/lib/jars/error_prone_annotations-2.0.18.jar:/usr/local/logstash/logstash-core/lib/jars/google-java-format-1.5.jar:/usr/local/logstash/logstash-core/lib/jars/guava-22.0.jar:/usr/local/logstash/logstash-core/lib/jars/j2objc-annotations-1.1.jar:/usr/local/logstash/logstash-core/lib/jars/jackson-annotations-2.9.1.jar:/usr/local/logstash/logstash-core/lib/jars/jackson-core-2.9.1.jar:/usr/local/logstash/logstash-core/lib/jars/jackson-databind-2.9.1.jar:/usr/local/logstash/logstash-core/lib/jars/jackson-dataformat-cbor-2.9.1.jar:/usr/local/logstash/logstash-core/lib/jars/janino-3.0.8.jar:/usr/local/logstash/logstash-core/lib/jars/javac-shaded-9-dev-r4023-3.jar:/usr/local/logstash/logstash-core/lib/jars/jruby-complete-9.1.13.0.jar:/usr/local/logstash/logstash-core/lib/jars/jsr305-1.3.9.jar:/usr/local/logstash/logstash-core/lib/jars/log4j-api-2.9.1.jar:/usr/local/logstash/logstash-core/lib/jars/log4j-core-2.9.1.jar:/usr/local/logstash/logstash-core/lib/jars/log4j-slf4j-impl-2.9.1.jar:/usr/local/logstash/logstash-core/lib/jars/logstash-core.jar:/usr/local/logstash/logstash-core/lib/jars/slf4j-api-1.7.25.jar org.logstash.Logstash -f /usr/local/logstash/config/logstash.conf
特别提示:logstash启动的比较慢,需要多等一会儿。如果在kibana的Discover里能看到添加索引就说明logstash启动好了
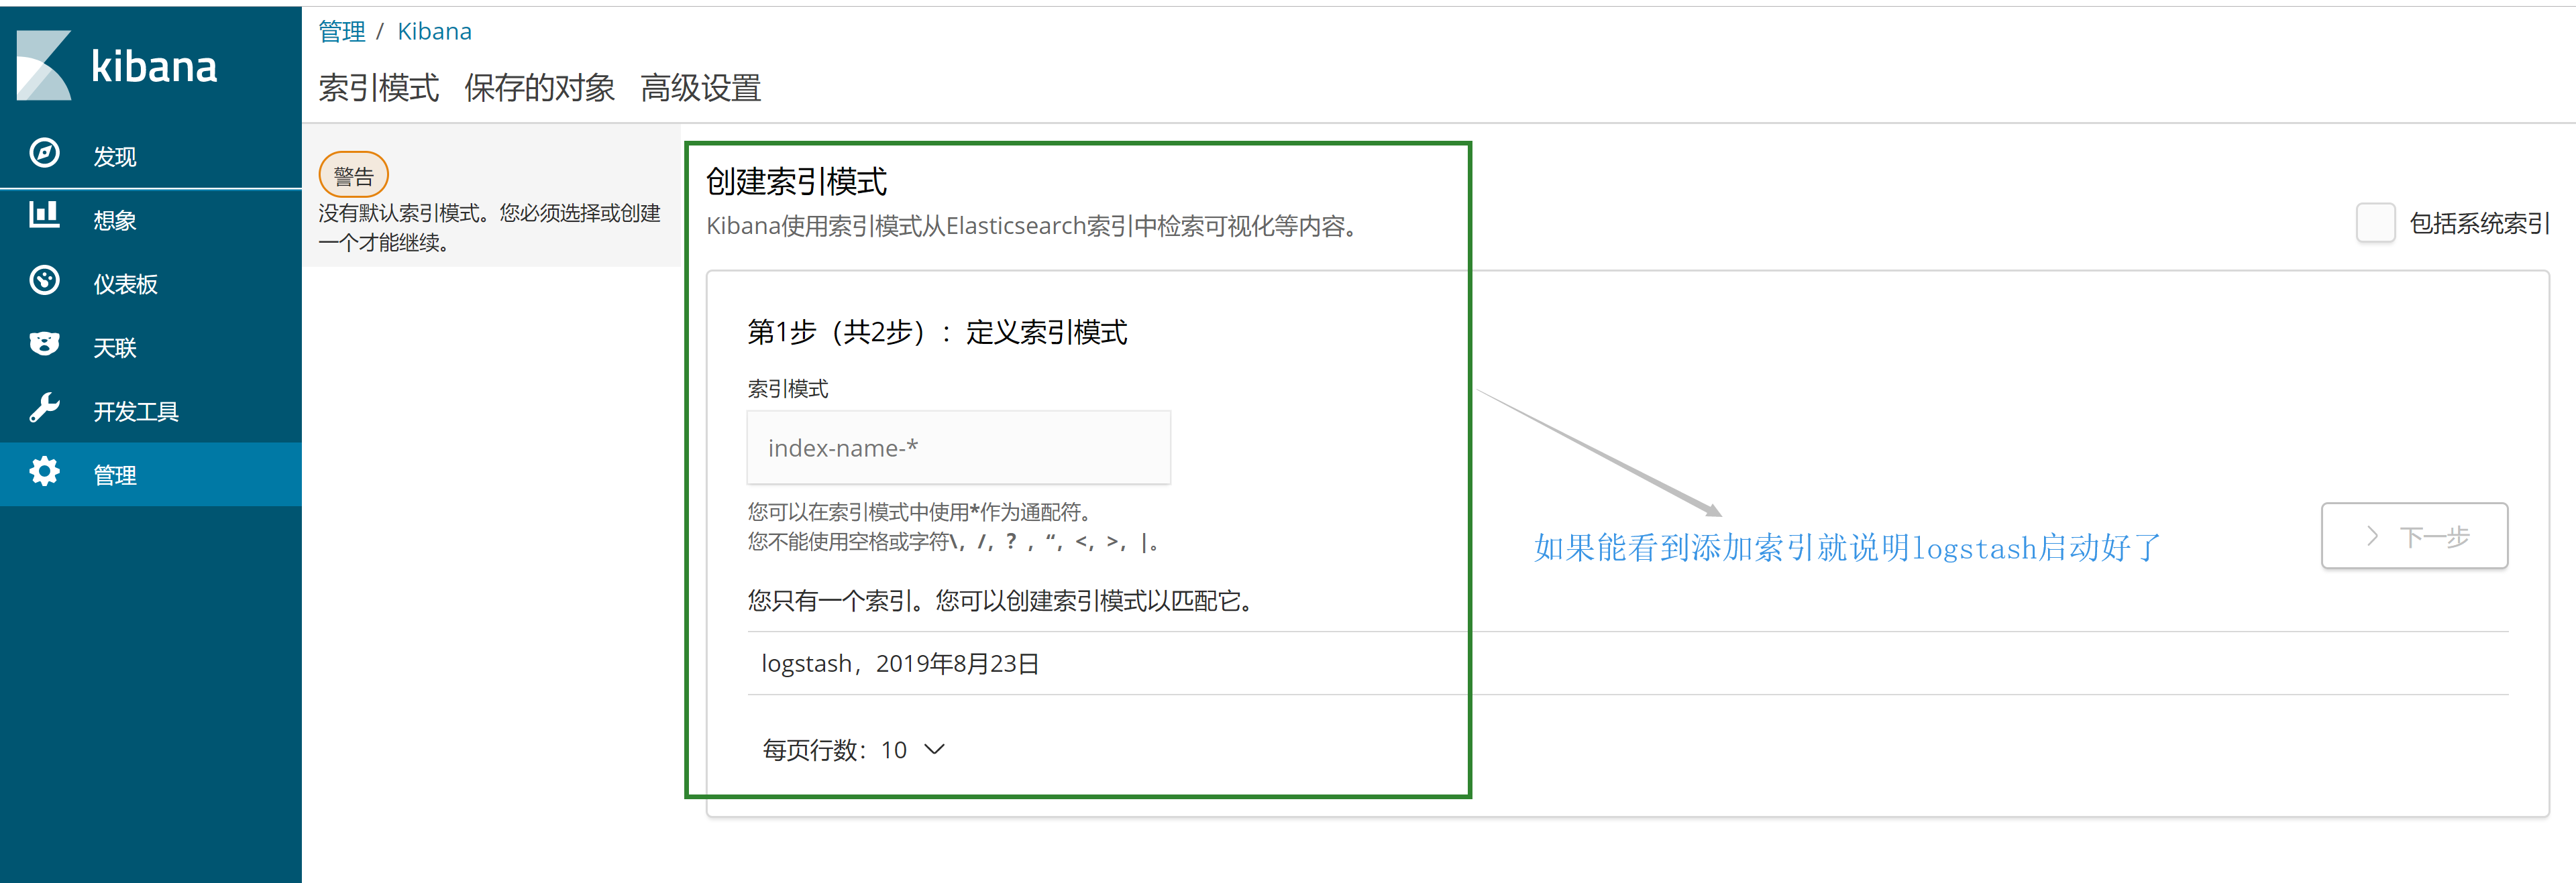
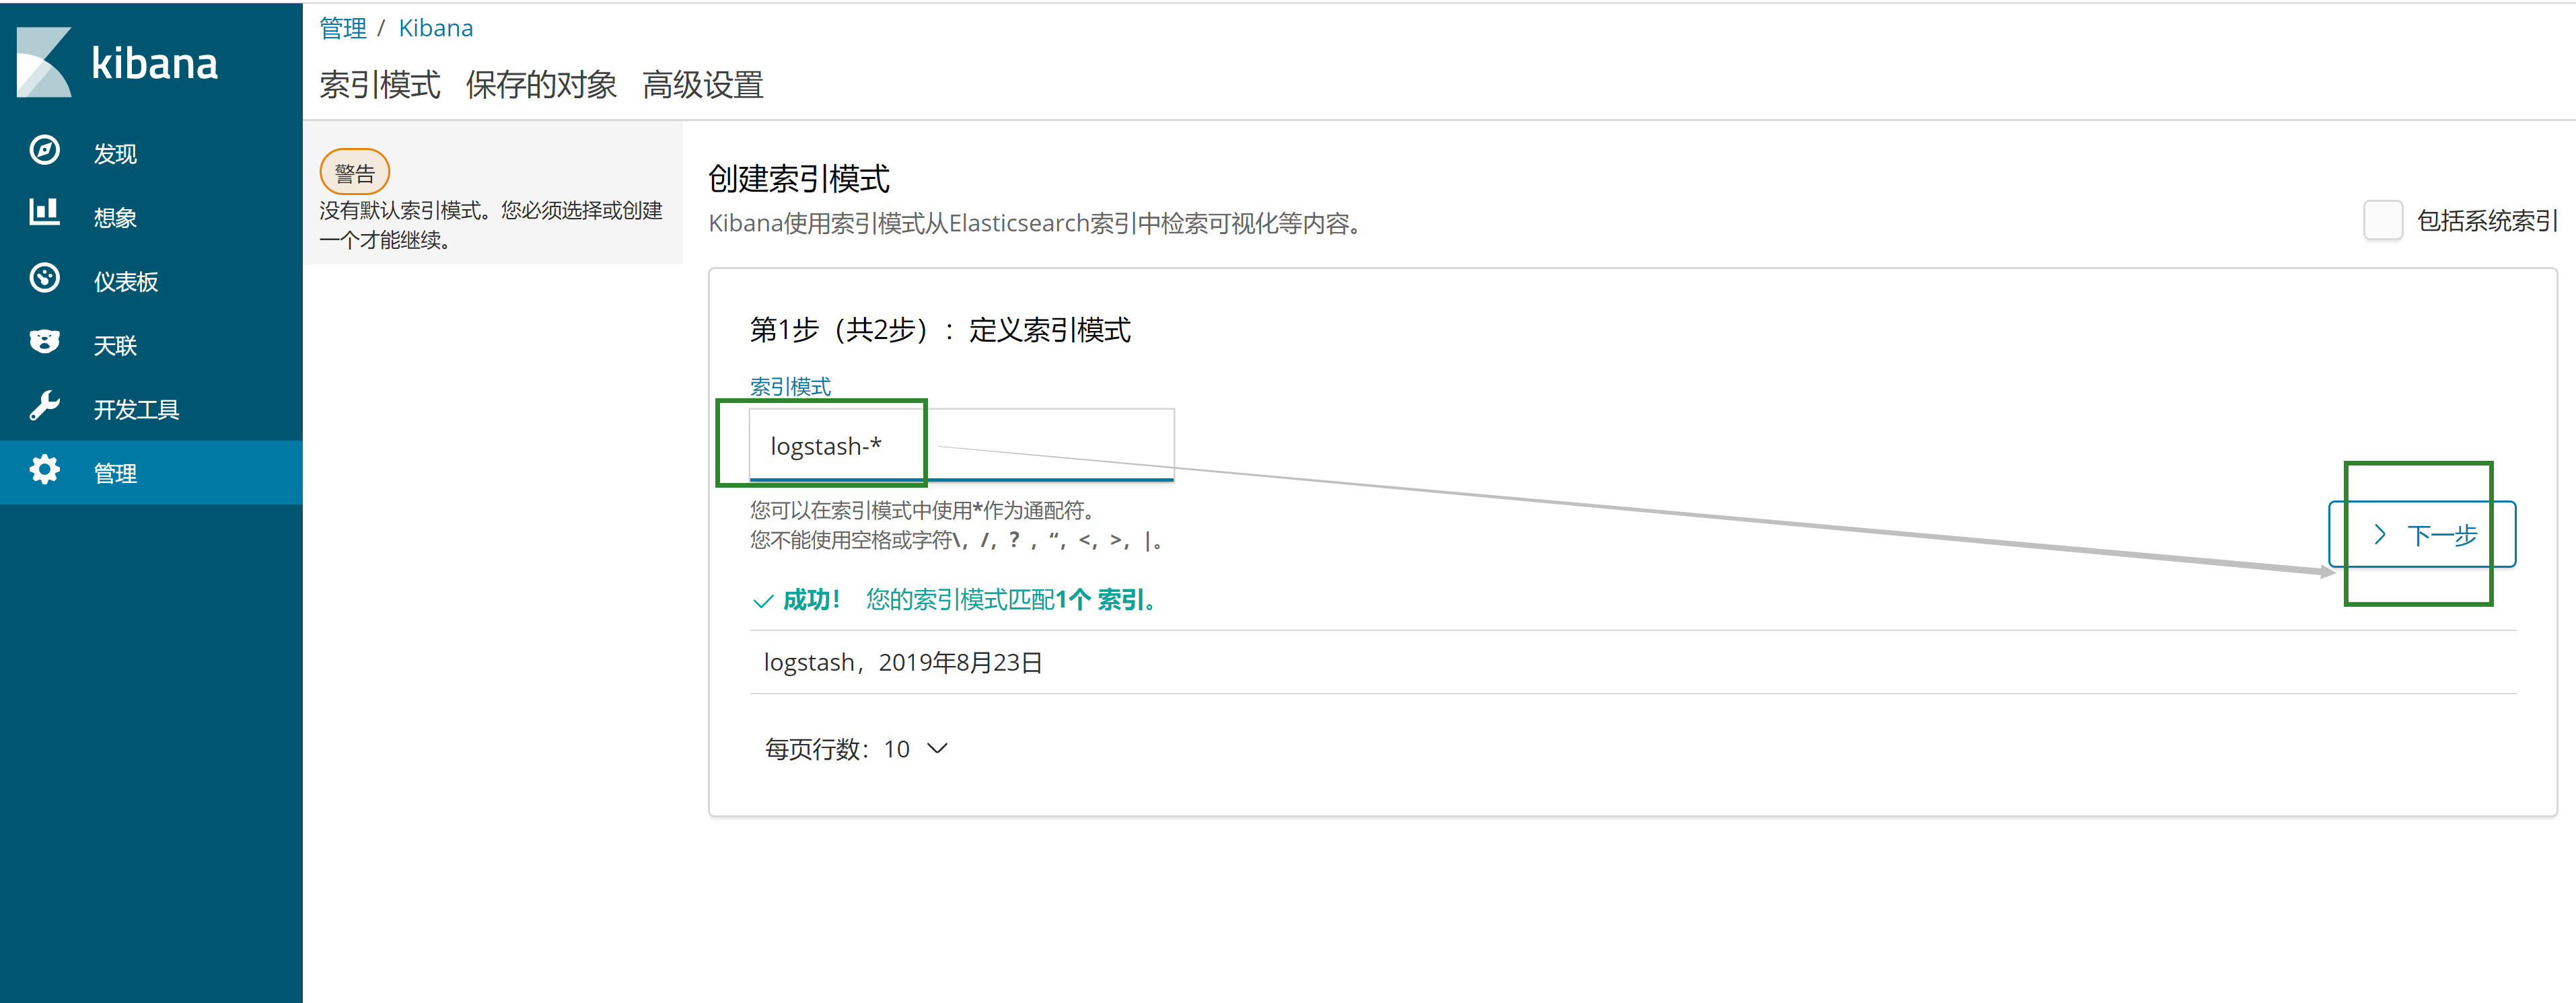
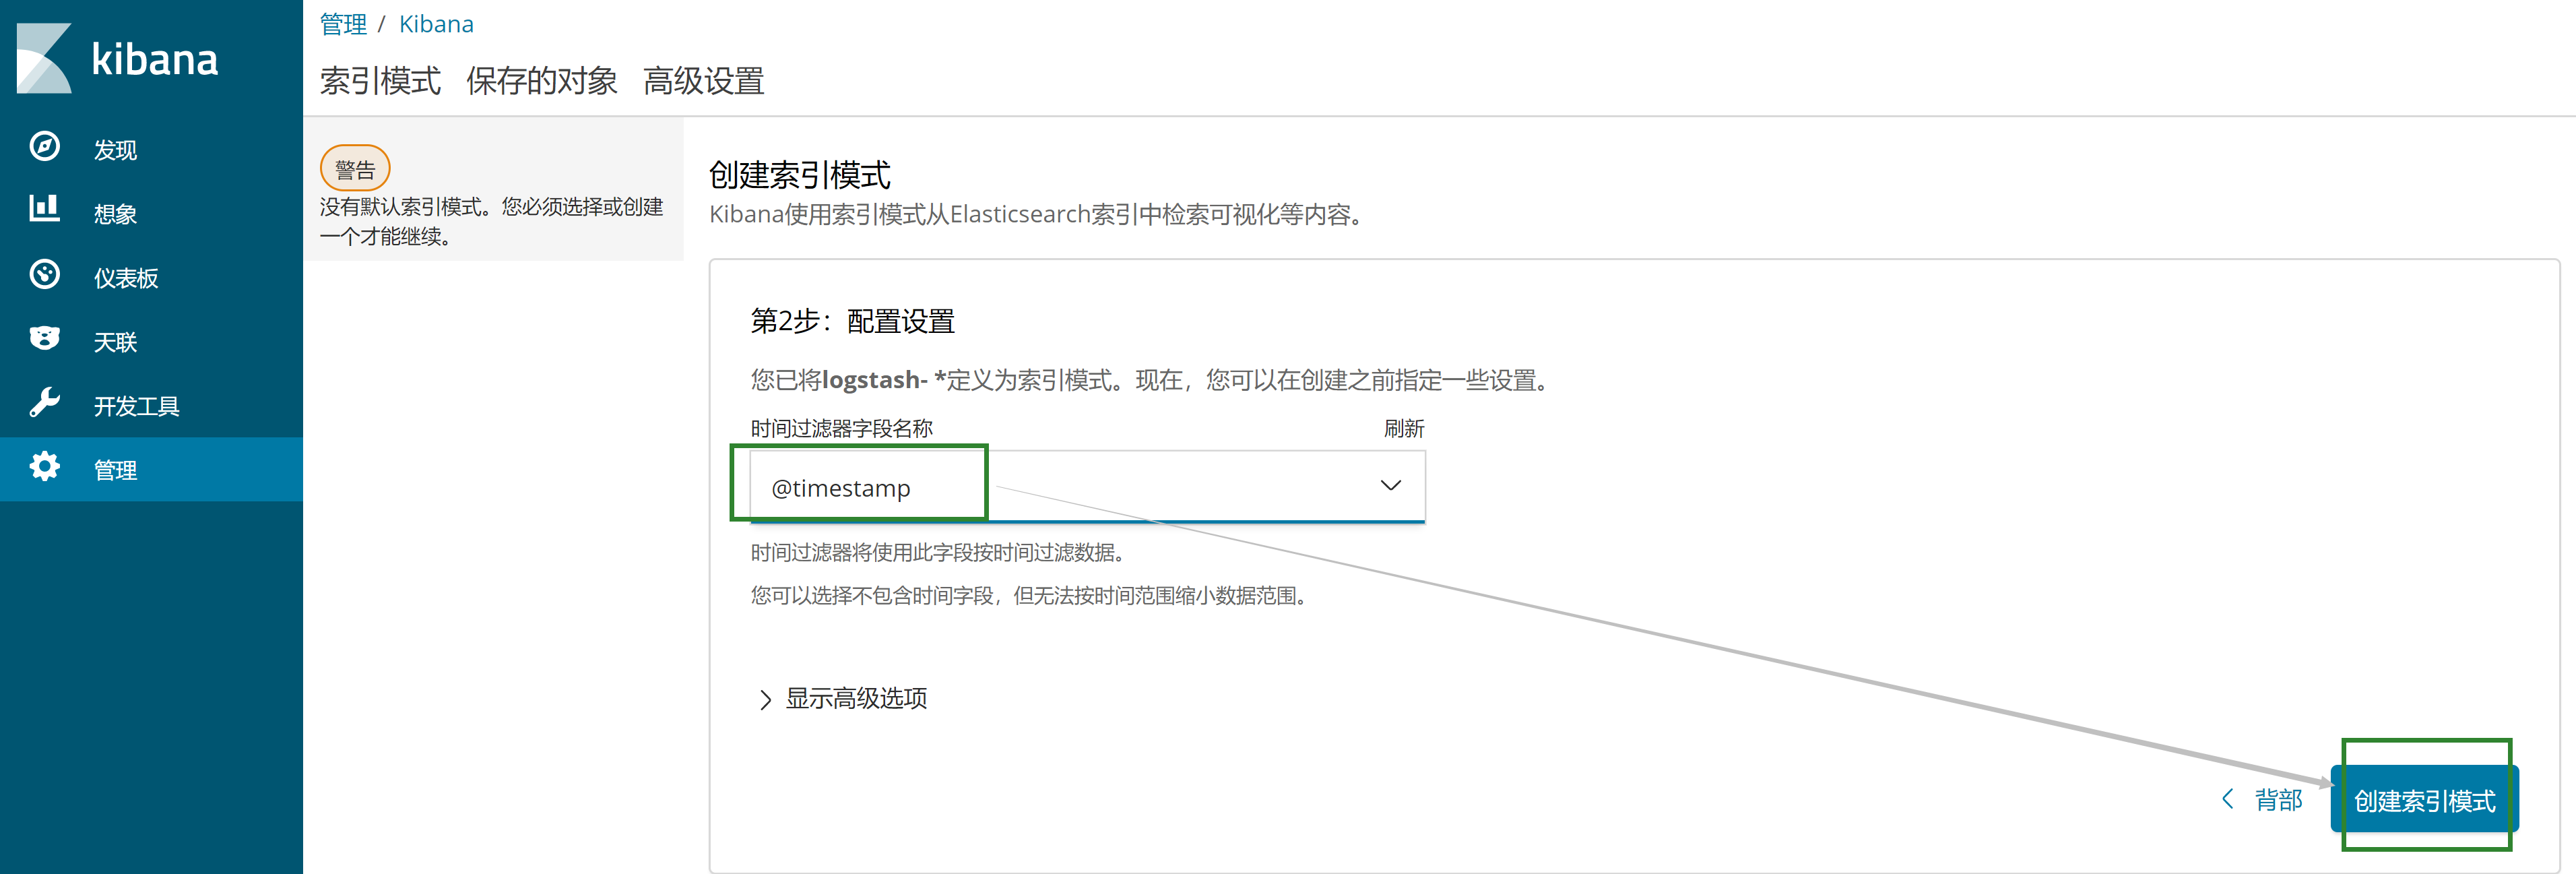
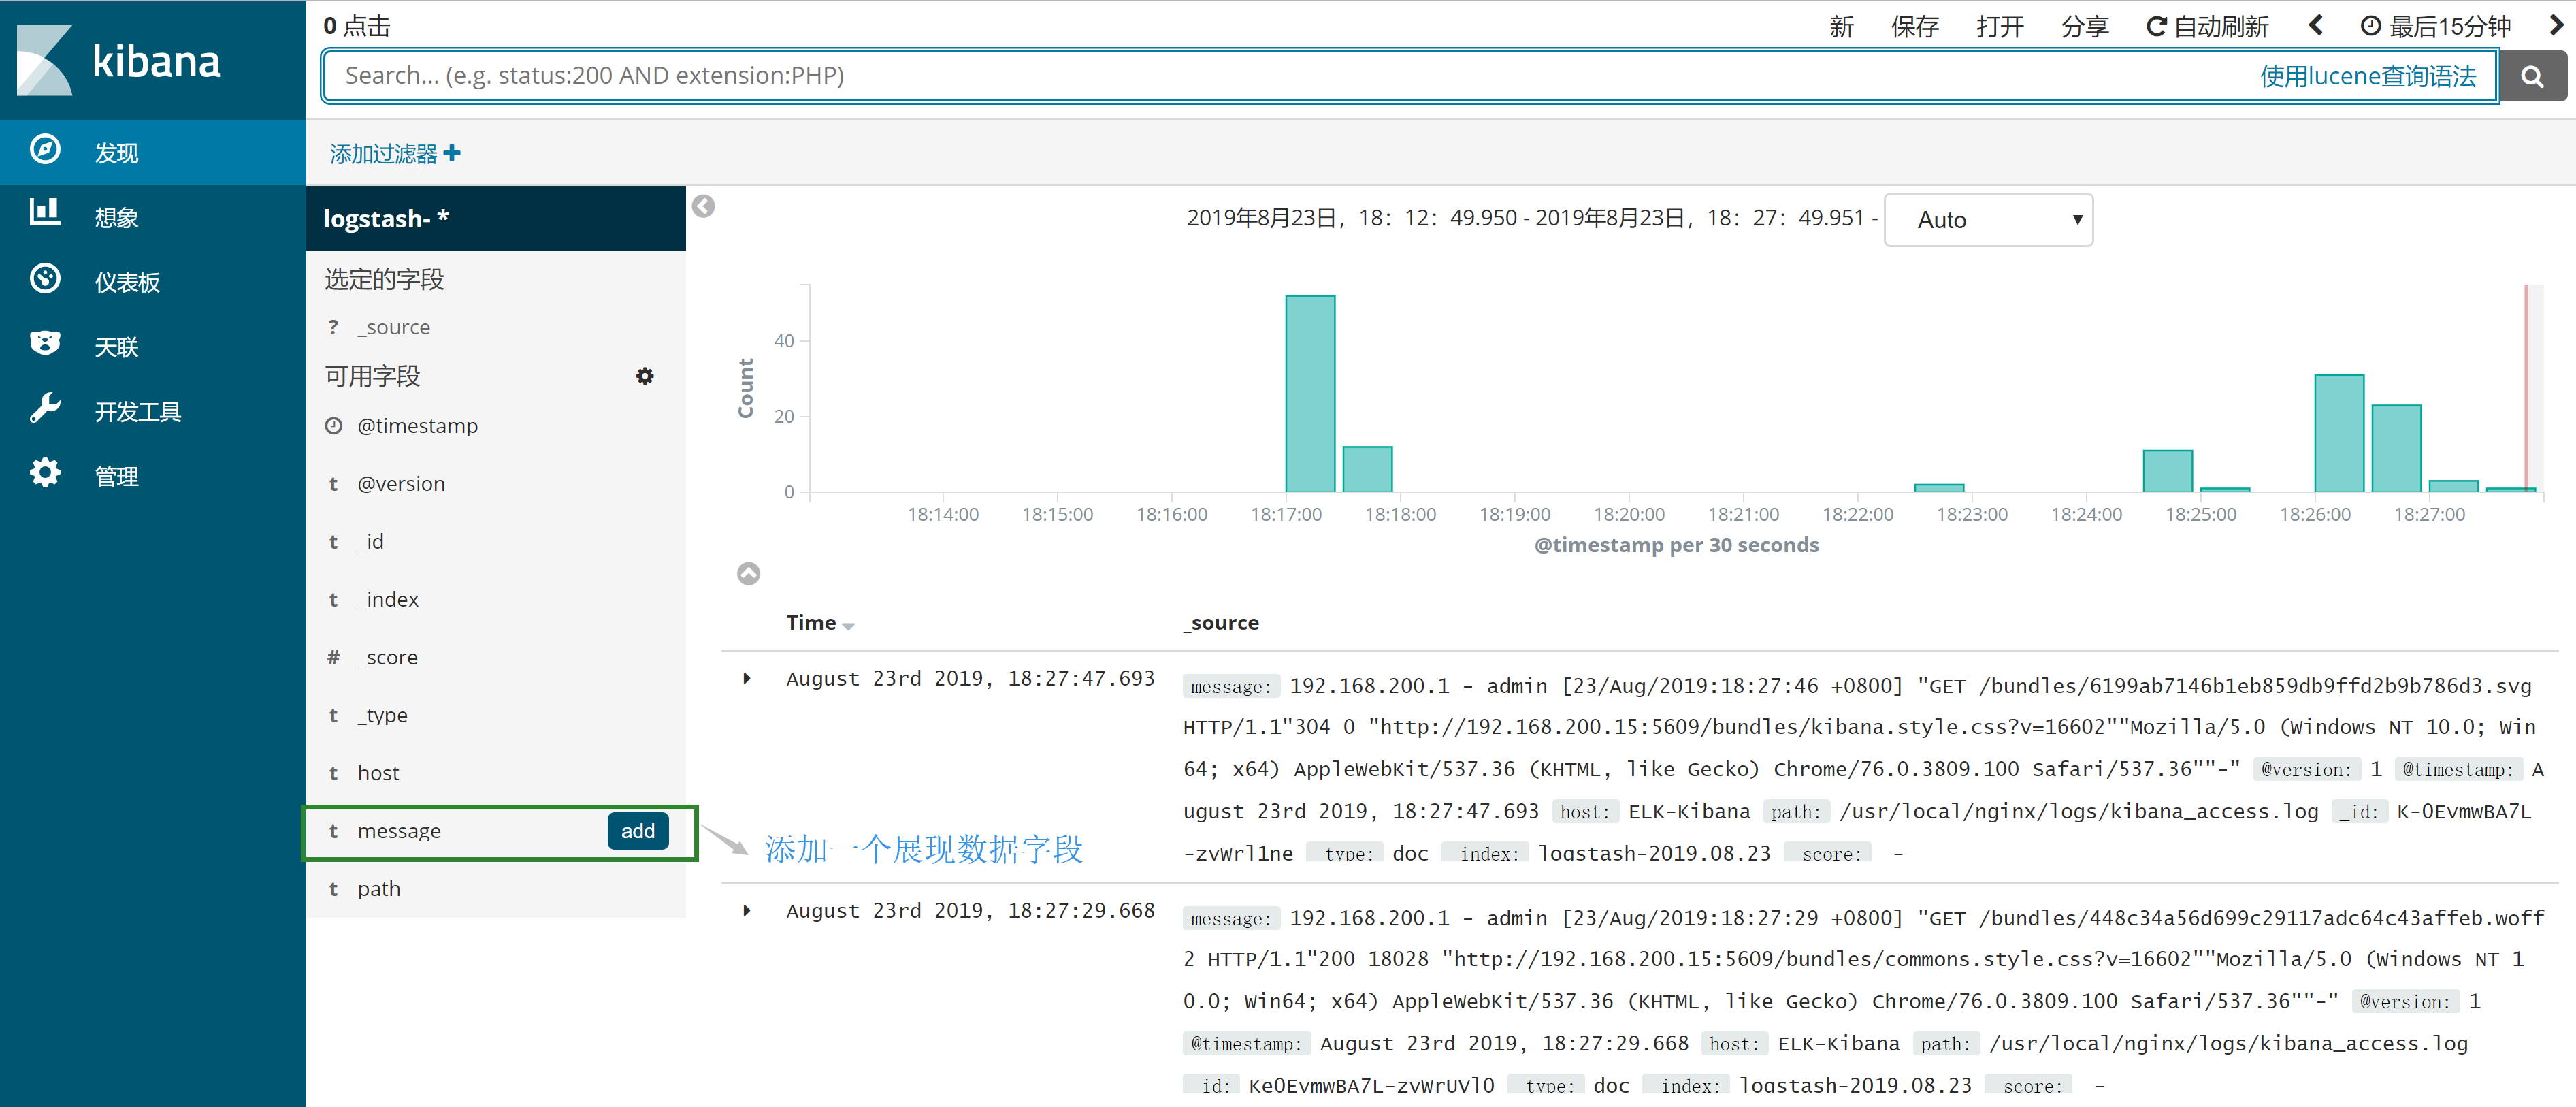
6.7 在kibana上配置索引,展现获取的kibana日志数据
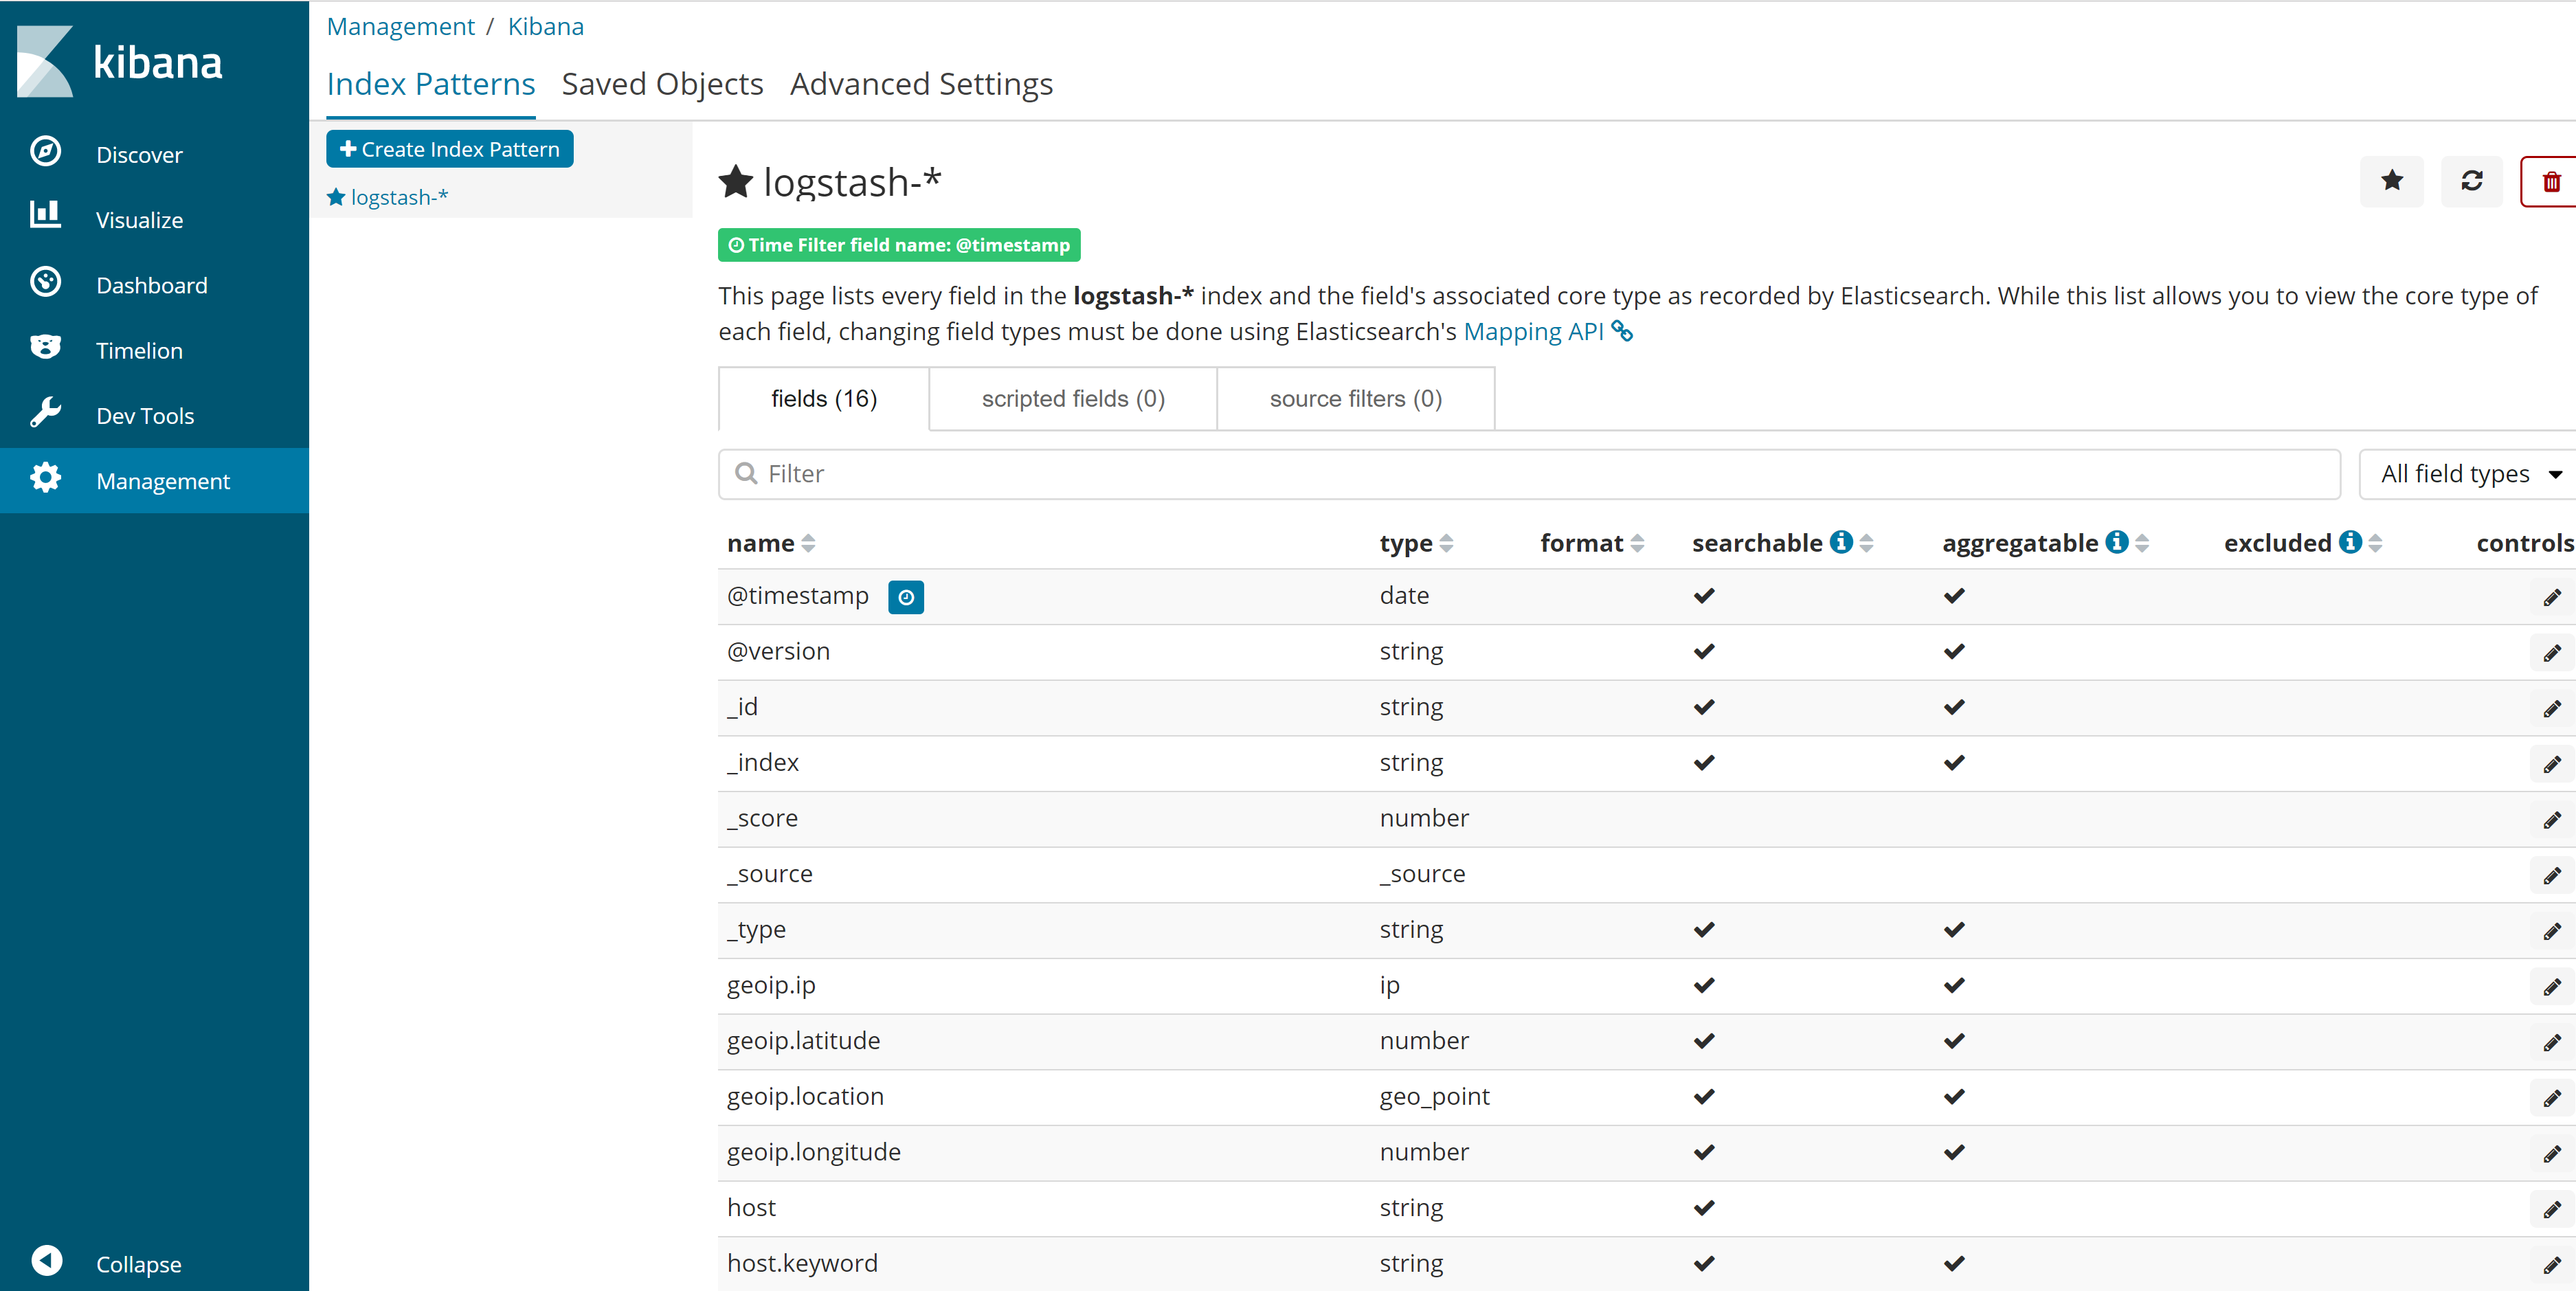
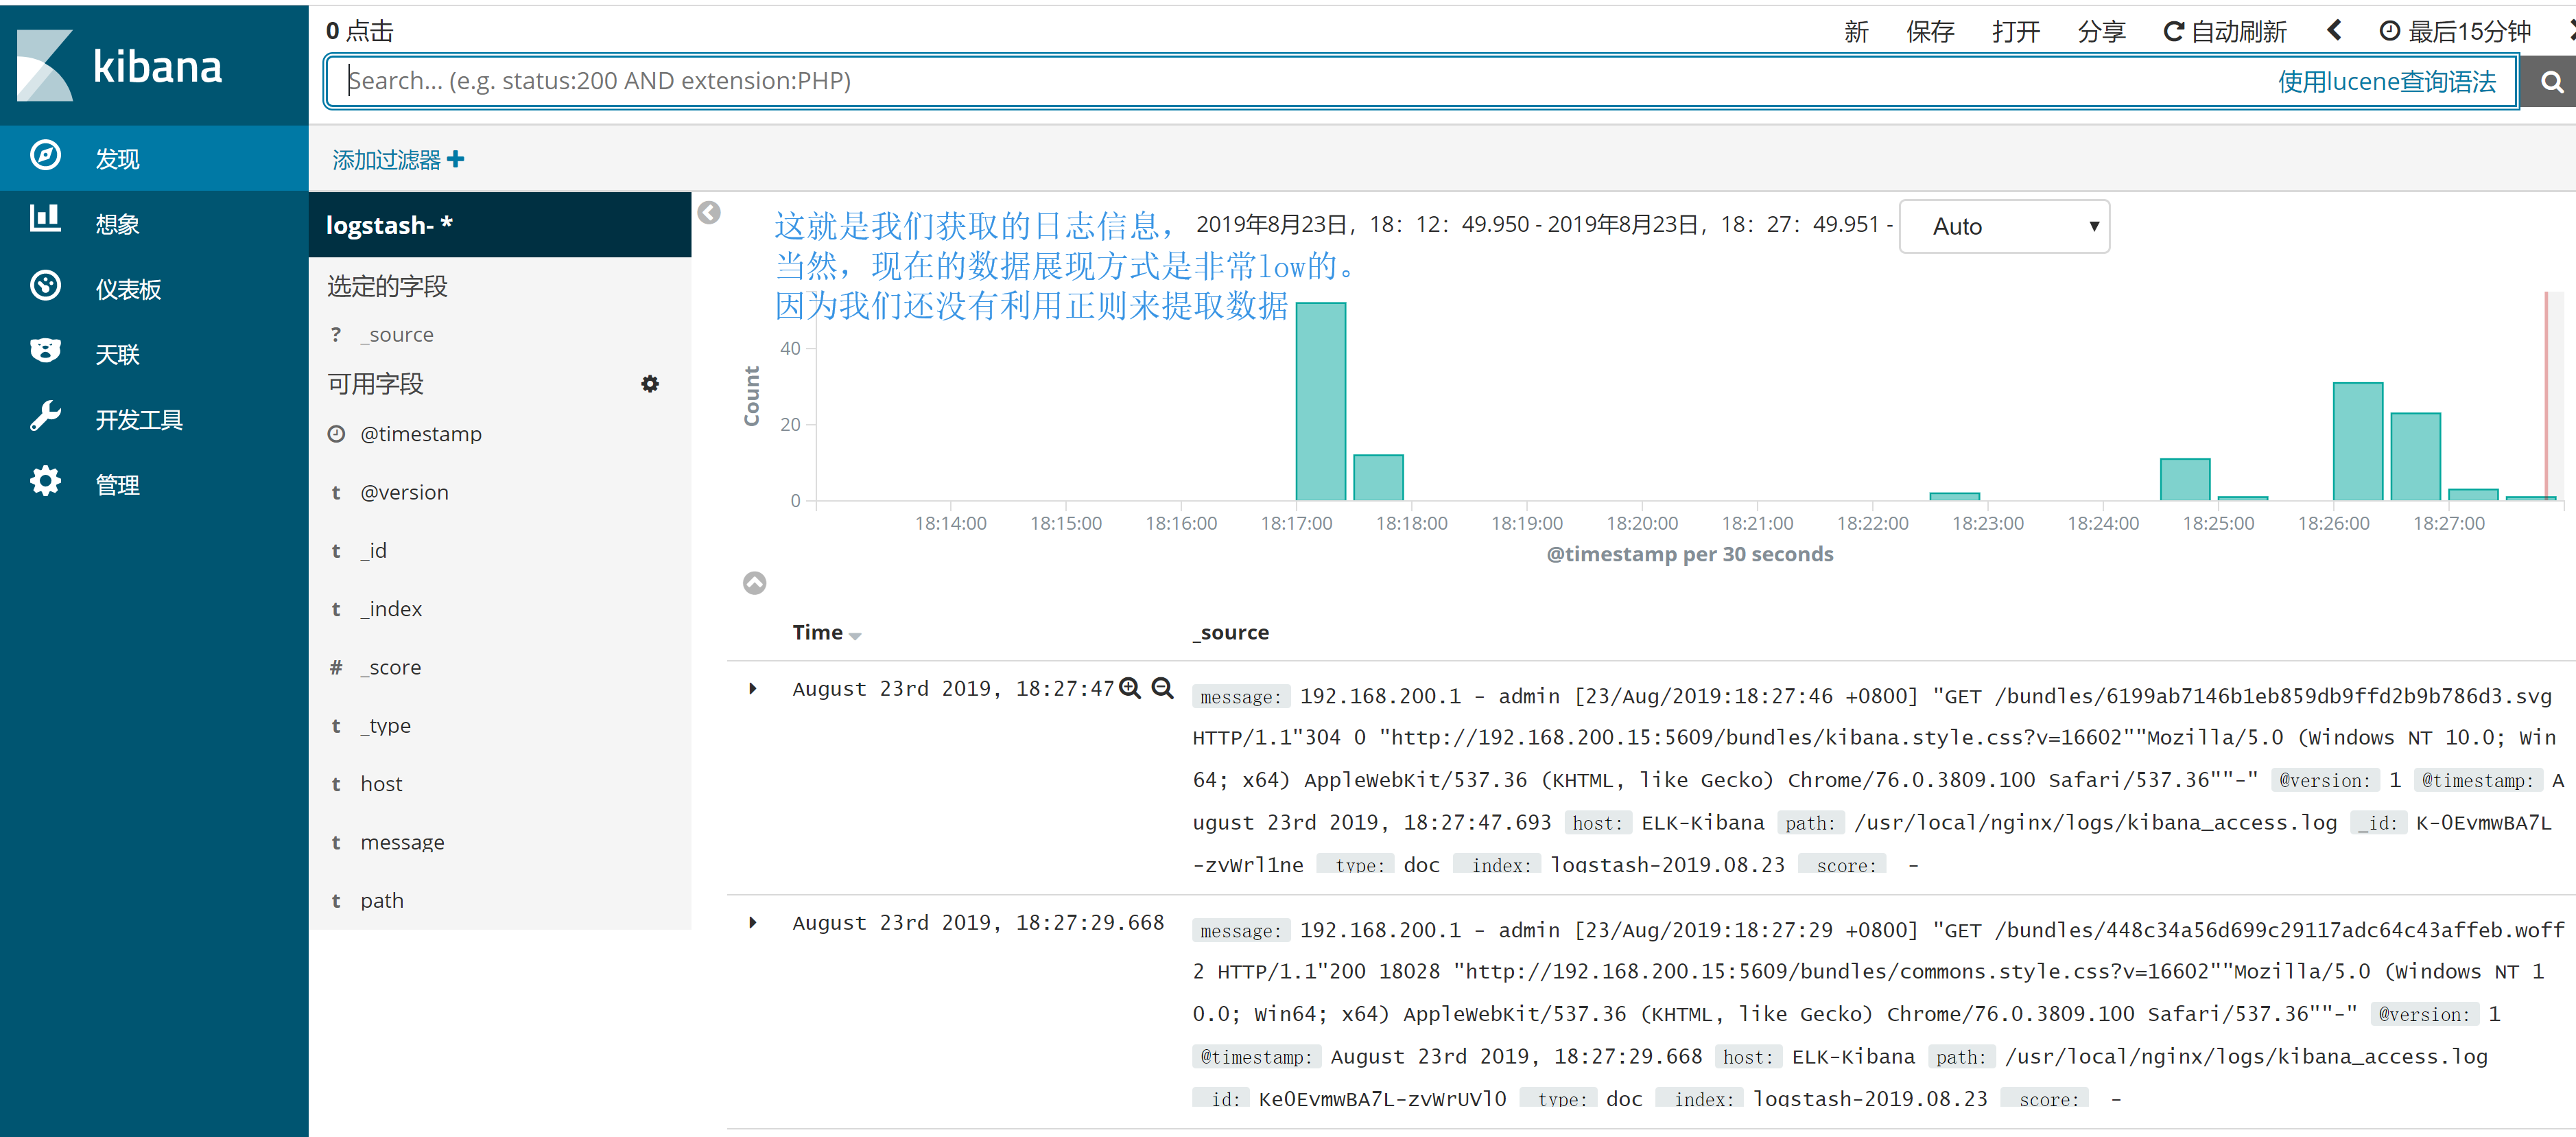
进行数据展现字段的筛选
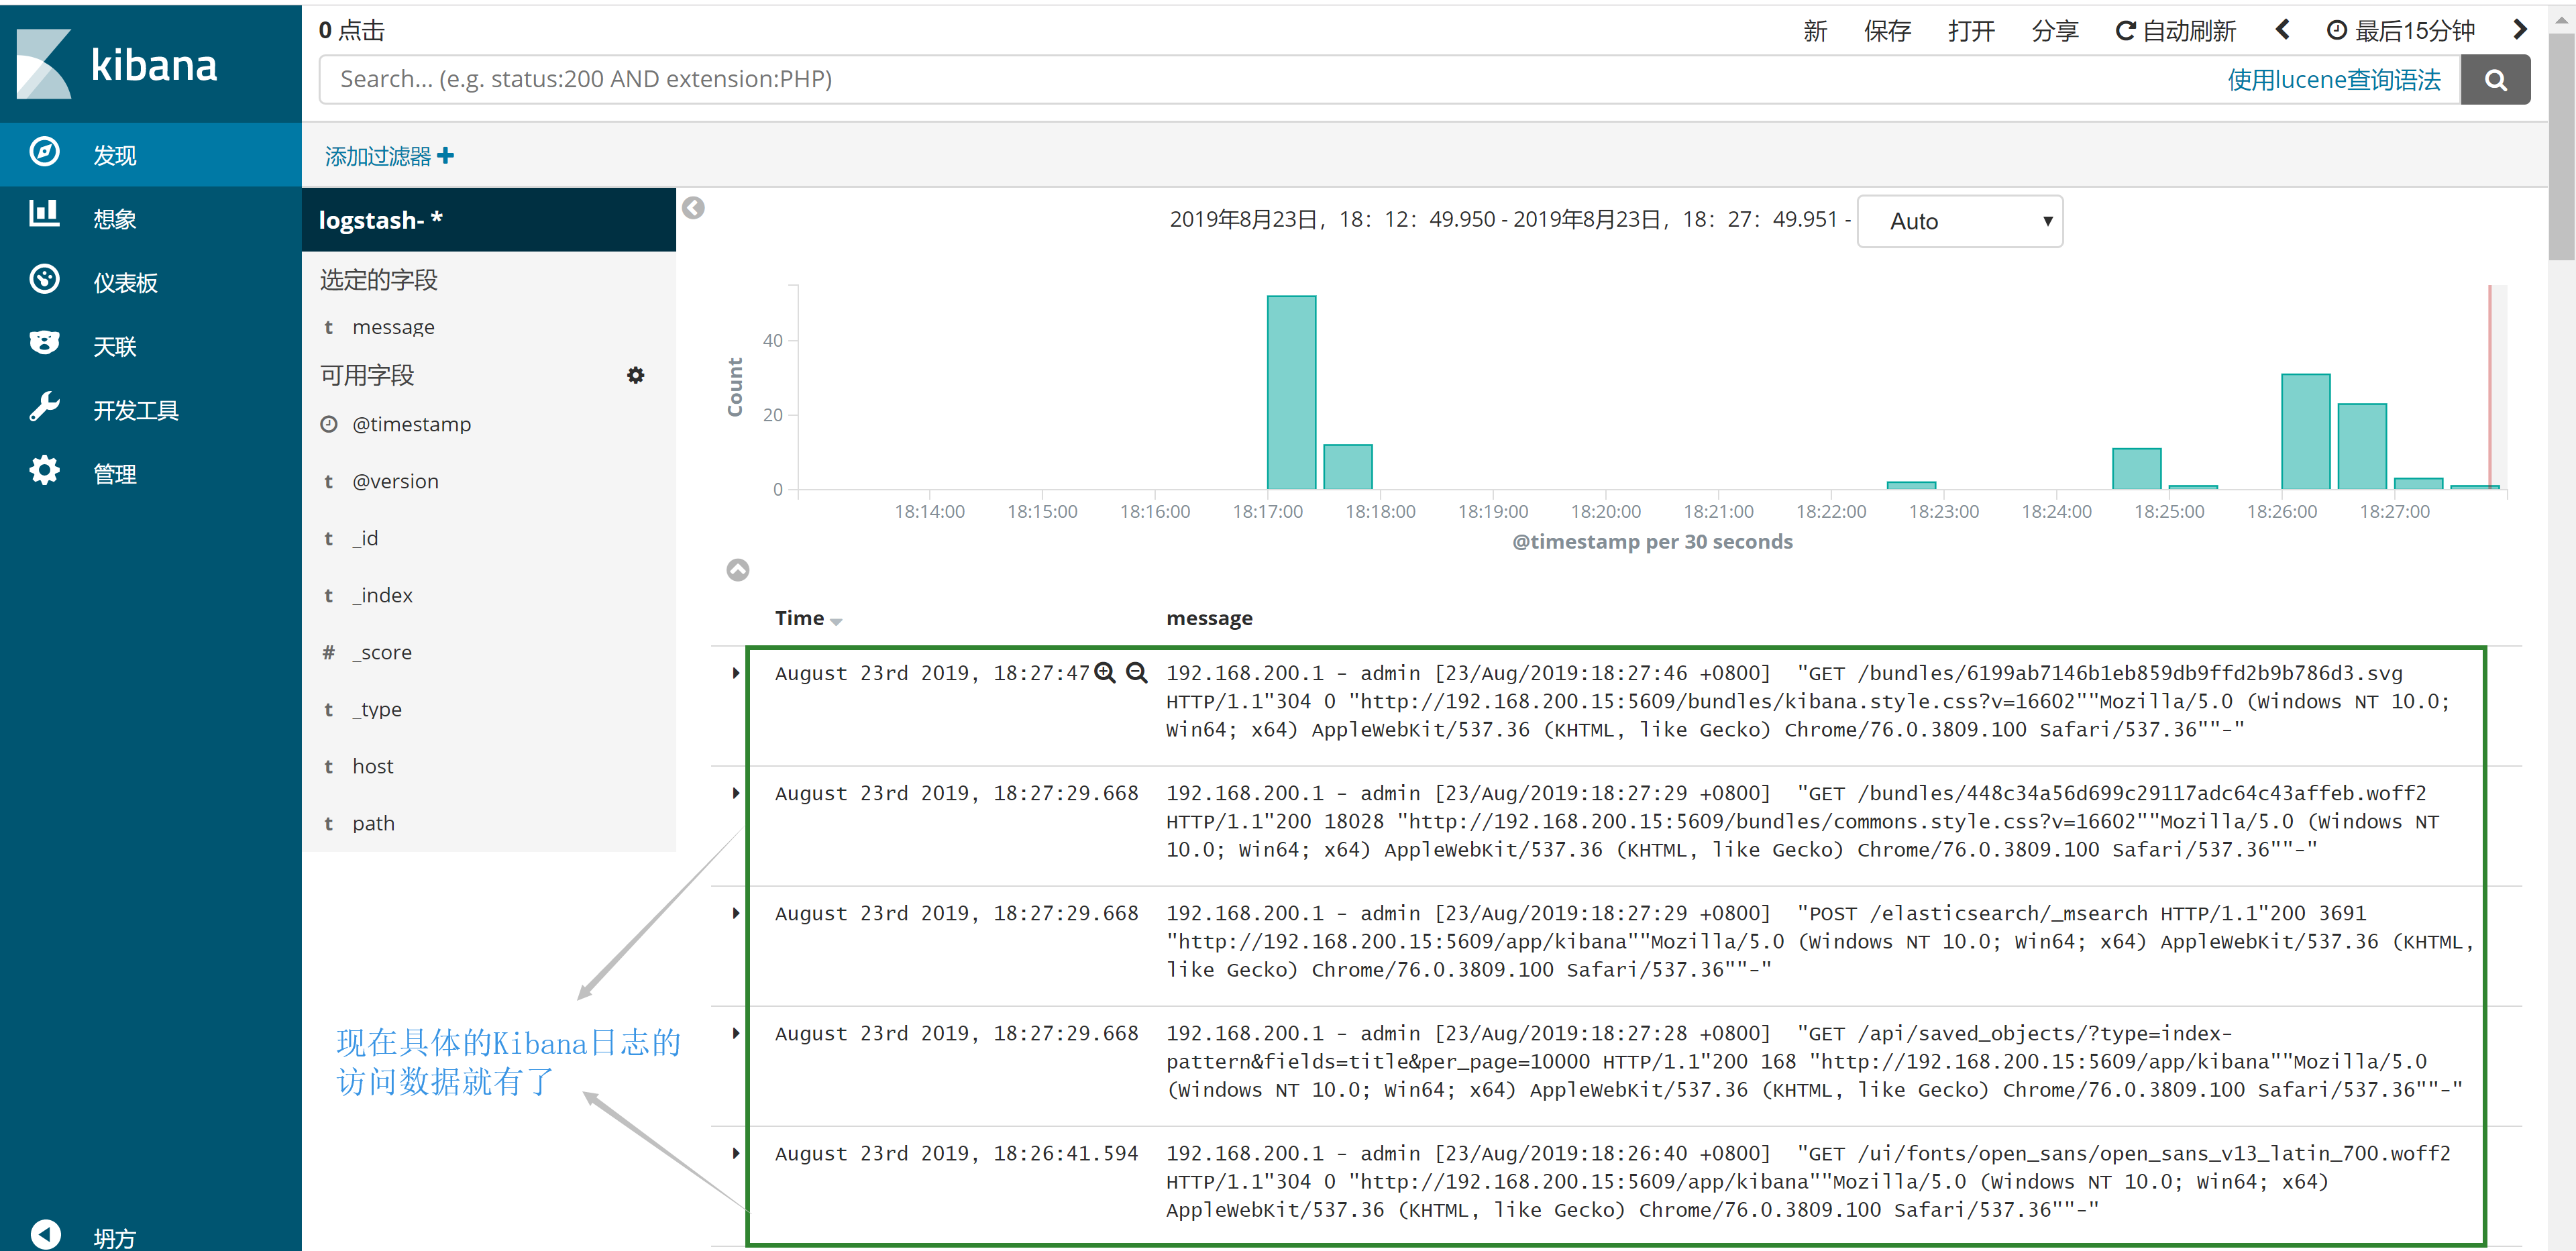
对nginx的kibana_access.log进行数据追踪,对比分析
[root@ELK-Kibana bin]# tail -f /usr/local/nginx/logs/kibana_access.log
192.168.200.1 - admin [23/Aug/2019:18:26:40 +0800]  "GET /ui/fonts/open_sans/open_sans_v13_latin_700.woff2 HTTP/1.1"304 0 "http://192.168.200.15:5609/app/kibana""Mozilla/5.0 (Windows NT 10.0; Win64; x64) AppleWebKit/537.36 (KHTML, like Gecko) Chrome/76.0.3809.100 Safari/537.36""-"
192.168.200.1 - admin [23/Aug/2019:18:27:28 +0800]  "GET /api/saved_objects/?type=index-pattern&fields=title&per_page=10000 HTTP/1.1"200 168 "http://192.168.200.15:5609/app/kibana""Mozilla/5.0 (Windows NT 10.0; Win64; x64) AppleWebKit/537.36 (KHTML, like Gecko) Chrome/76.0.3809.100 Safari/537.36""-"
192.168.200.1 - admin [23/Aug/2019:18:27:29 +0800]  "GET /bundles/448c34a56d699c29117adc64c43affeb.woff2 HTTP/1.1"200 18028 "http://192.168.200.15:5609/bundles/commons.style.css?v=16602""Mozilla/5.0 (Windows NT 10.0; Win64; x64) AppleWebKit/537.36 (KHTML, like Gecko) Chrome/76.0.3809.100 Safari/537.36""-"
192.168.200.1 - admin [23/Aug/2019:18:27:29 +0800]  "POST /elasticsearch/_msearch HTTP/1.1"200 3691 "http://192.168.200.15:5609/app/kibana""Mozilla/5.0 (Windows NT 10.0; Win64; x64) AppleWebKit/537.36 (KHTML, like Gecko) Chrome/76.0.3809.100 Safari/537.36""-"
192.168.200.1 - admin [23/Aug/2019:18:27:46 +0800]  "GET /bundles/6199ab7146b1eb859db9ffd2b9b786d3.svg HTTP/1.1"304 0 "http://192.168.200.15:5609/bundles/kibana.style.css?v=16602""Mozilla/5.0 (Windows NT 10.0; Win64; x64) AppleWebKit/537.36 (KHTML, like Gecko) Chrome/76.0.3809.100 Safari/537.36""-"

#数据是一致的
7. logstash使用详解
[root@ELK-Kibana bin]# ps -ef | grep logstash | grep -v grep
root       9964      1  4 18:15 pts/2    00:01:27 /usr/local/jdk/bin/java -Xms1g -Xmx1g -XX:+UseParNewGC -XX:+UseConcMarkSweepGC -XX:CMSInitiatingOccupancyFraction=75 -XX:+UseCMSInitiatingOccupancyOnly -Djava.awt.headless=true -Dfile.encoding=UTF-8 -Djruby.compile.invokedynamic=true -Djruby.jit.threshold=0 -XX:+HeapDumpOnOutOfMemoryError -Djava.security.egd=file:/dev/urandom -cp /usr/local/logstash/logstash-core/lib/jars/animal-sniffer-annotations-1.14.jar:/usr/local/logstash/logstash-core/lib/jars/commons-compiler-3.0.8.jar:/usr/local/logstash/logstash-core/lib/jars/error_prone_annotations-2.0.18.jar:/usr/local/logstash/logstash-core/lib/jars/google-java-format-1.5.jar:/usr/local/logstash/logstash-core/lib/jars/guava-22.0.jar:/usr/local/logstash/logstash-core/lib/jars/j2objc-annotations-1.1.jar:/usr/local/logstash/logstash-core/lib/jars/jackson-annotations-2.9.1.jar:/usr/local/logstash/logstash-core/lib/jars/jackson-core-2.9.1.jar:/usr/local/logstash/logstash-core/lib/jars/jackson-databind-2.9.1.jar:/usr/local/logstash/logstash-core/lib/jars/jackson-dataformat-cbor-2.9.1.jar:/usr/local/logstash/logstash-core/lib/jars/janino-3.0.8.jar:/usr/local/logstash/logstash-core/lib/jars/javac-shaded-9-dev-r4023-3.jar:/usr/local/logstash/logstash-core/lib/jars/jruby-complete-9.1.13.0.jar:/usr/local/logstash/logstash-core/lib/jars/jsr305-1.3.9.jar:/usr/local/logstash/logstash-core/lib/jars/log4j-api-2.9.1.jar:/usr/local/logstash/logstash-core/lib/jars/log4j-core-2.9.1.jar:/usr/local/logstash/logstash-core/lib/jars/log4j-slf4j-impl-2.9.1.jar:/usr/local/logstash/logstash-core/lib/jars/logstash-core.jar:/usr/local/logstash/logstash-core/lib/jars/slf4j-api-1.7.25.jar org.logstash.Logstash -f /usr/local/logstash/config/logstash.conf
[root@ELK-Kibana bin]# kill -9 9964
[root@ELK-Kibana bin]# /usr/local/logstash/bin/logstash -e ""     #命令执行的时间有点长,请耐心等待(执行前需要关闭logstash服务)
Sending Logstash's logs to /usr/local/logstash/logs which is now configured via log4j2.properties
[2019-08-23T18:50:01,638][INFO ][logstash.modules.scaffold] Initializing module {:module_name=>"fb_apache", :directory=>"/usr/local/logstash/modules/fb_apache/configuration"}
[2019-08-23T18:50:01,665][INFO ][logstash.modules.scaffold] Initializing module {:module_name=>"netflow", :directory=>"/usr/local/logstash/modules/netflow/configuration"}
[2019-08-23T18:50:02,403][WARN ][logstash.config.source.multilocal] Ignoring the 'pipelines.yml' file because modules or command line options are specified
[2019-08-23T18:50:03,232][INFO ][logstash.runner          ] Starting Logstash {"logstash.version"=>"6.2.3"}
[2019-08-23T18:50:03,823][INFO ][logstash.agent           ] Successfully started Logstash API endpoint {:port=>9600}
[2019-08-23T18:50:06,822][INFO ][logstash.pipeline        ] Starting pipeline {:pipeline_id=>"main", "pipeline.workers"=>1, "pipeline.batch.size"=>125, "pipeline.batch.delay"=>50}
[2019-08-23T18:50:22,288][INFO ][logstash.pipeline        ] Pipeline started succesfully {:pipeline_id=>"main", :thread=>"#<Thread:0x7c6ef79b run>"}
The stdin plugin is now waiting for input:
[2019-08-23T18:50:22,386][INFO ][logstash.agent           ] Pipelines running {:count=>1, :pipelines=>["main"]}
welcome          #在这里输入"welcome"
{
          "type" => "stdin",
    "@timestamp" => 2019-08-23T10:53:57.807Z,
          "host" => "ELK-Kibana",
       "message" => "welcome",
      "@version" => "1"
}
7.1 logstash工作原理
- Logstash使用管道方式进行日志的搜集处理和输出。有点类似于管道命令xxx|ccc|ddd,xxx执行完了会执行ccc,然后执行ddd。
- 在logstash中,包括了三个阶段:输入input ---> 处理filter(不是必须的) ---> 输出output
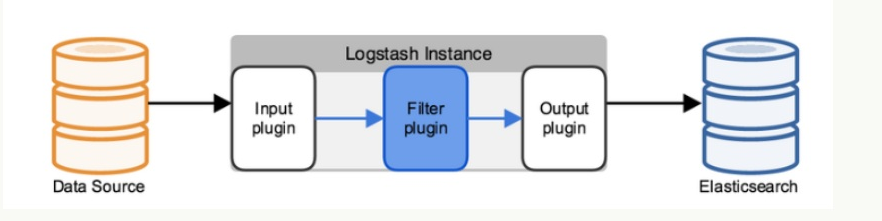
- 每个阶段都有很多的插件配合工作,比如file,elasticsearch,redis等
- 每个阶段也可以指定多种方式,比如输出既可以输出到elasticsearch中,也可以指定到 stdout在控制台打印。
- 由于这种插件式的组织方式,使得logstash变得易于扩展和定制
7.2 命令行中常用的参数
| 参数 | 用途 |
|---|---|
| -f | 通过这个命令可以指定Logstash的配置文件,根据配置文件配置logstash |
| -e | 后面跟着字符串,该字符串可以被当作logstash的配置(如果是""则默认使用stdin 作为默认输入,stdout作为默认输出) |
| -l | 日志输出的地址(默认就是stdout直接在控制台中输出) |
| -t | 测试配置文件是否正确,然后退出。 |
7.3 配置文件说明
前面介绍过logstash基本上由三部分组成,input,output以及用户需要才添加的 filter,因此标准的配置文件格式如下:
input {...}
filter {...}
output {...}
在每个部分中,也可以指定多个访问方式,例如我想要指定两个日志来源文件,则可以 这样写:
input {
    file { path => "/var/log/messages" type => "syslog" }
    file { path => "/var/log/apache/access.log" type => "apache" }
}
类似的,如果在filter中添加了多种处理规则,则按照它的顺序----处理,但是有一些插 件并不是线程安全的。
比如在filter中指定了两个一样的插件,这两个任务并不能保证准确的按顺序执行,因此 官方也推荐避免在filter中重复使用插件。
8. 利用logstash的正则进行日志信息的抓取测试
8.1 测试性抓取日志字段
#logstash提取数据段配置文件模板详解
[root@ELK-Kibana bin]# cd /usr/local/logstash/config/
[root@ELK-Kibana config]# vim logstash.conf
[root@elk config]# cat logstash.conf
#/bin/bash
#--Mr.yang--
input  {
     stdin{}                   #从标准输入读取数据
}
filter    {
     grok {
         match => {
            "message" => '(?<字段名>正则表达式).*'
         }
    }
}
output    {
     elasticsearch {           #如果要输入到elasticsearch里,那么需要注释掉stdout{}
         hosts => ["http://127.0.0.1:9200"]
}
     stdout {                  #只将信息输出到屏幕上
         codec => rubydebug    #用于正则提取测试,将正则抓取结果输出到屏幕上
     }
}
8.1.1 修改logstash配置文件
[root@ELK-Kibana config]# vim logstash.conf
[root@ELK-Kibana config]# cat logstash.conf
#/bin/bash
#--Mr.yang--

input  {
    stdin{ }
}
filter   {
    grok {
       match => {
          "message" => '(?<mydate>[a-zA-Z]+ [0-9]+ [0-9:]+) (?<hostname  >[a-zA-Z]+).*'
        }
    }
}
output  {
    elasticsearch {
          hosts => ["http://127.0.0.1:9200"]
}
      stdout {
          codec => rubydebug
      }
}
8.1.2 为了测试方便,我们暂时交互式启动logstash
[root@ELK-Kibana config]# /usr/local/logstash/bin/logstash -f /usr/local/logstash/config/logstash.conf
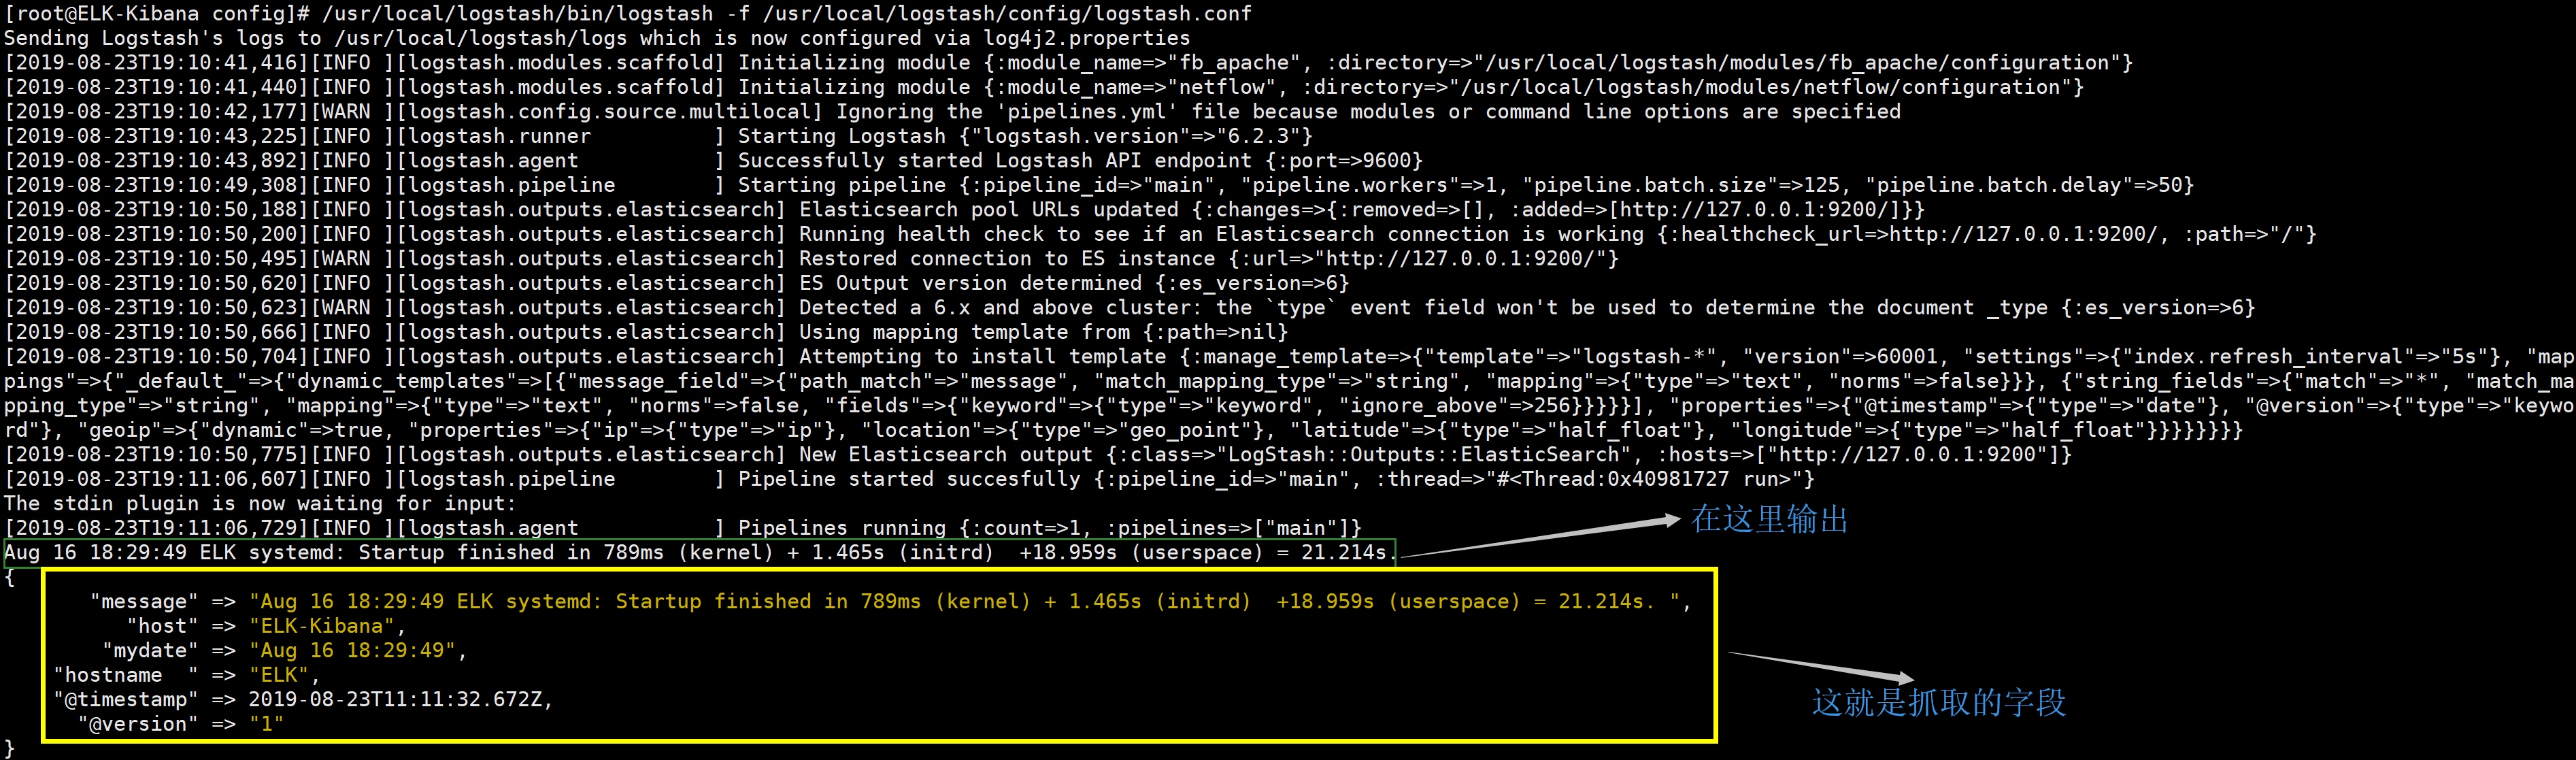
8.1.3 输出结果如下
#输入内容
Aug 16 18:29:49 ELK systemd: Startup finished in 789ms (kernel) + 1.465s (initrd)  +18.959s (userspace) = 21.214s.
{
      "@version" => "1",
       "message" => "Aug 16 18:29:49 ELK systemd: Startup finished in 789ms (kernel) + 1.465s (initrd)  +18.959s (userspace) = 21.214s.",
          "host" => "elk",
    "hostname  " => "ELK",               #这就是抓取的字段
    "@timestamp" => 2019-04-01T05:14:55.982Z,
        "mydate" => "Aug 16 18:29:49"    #这就是抓取的字段
}
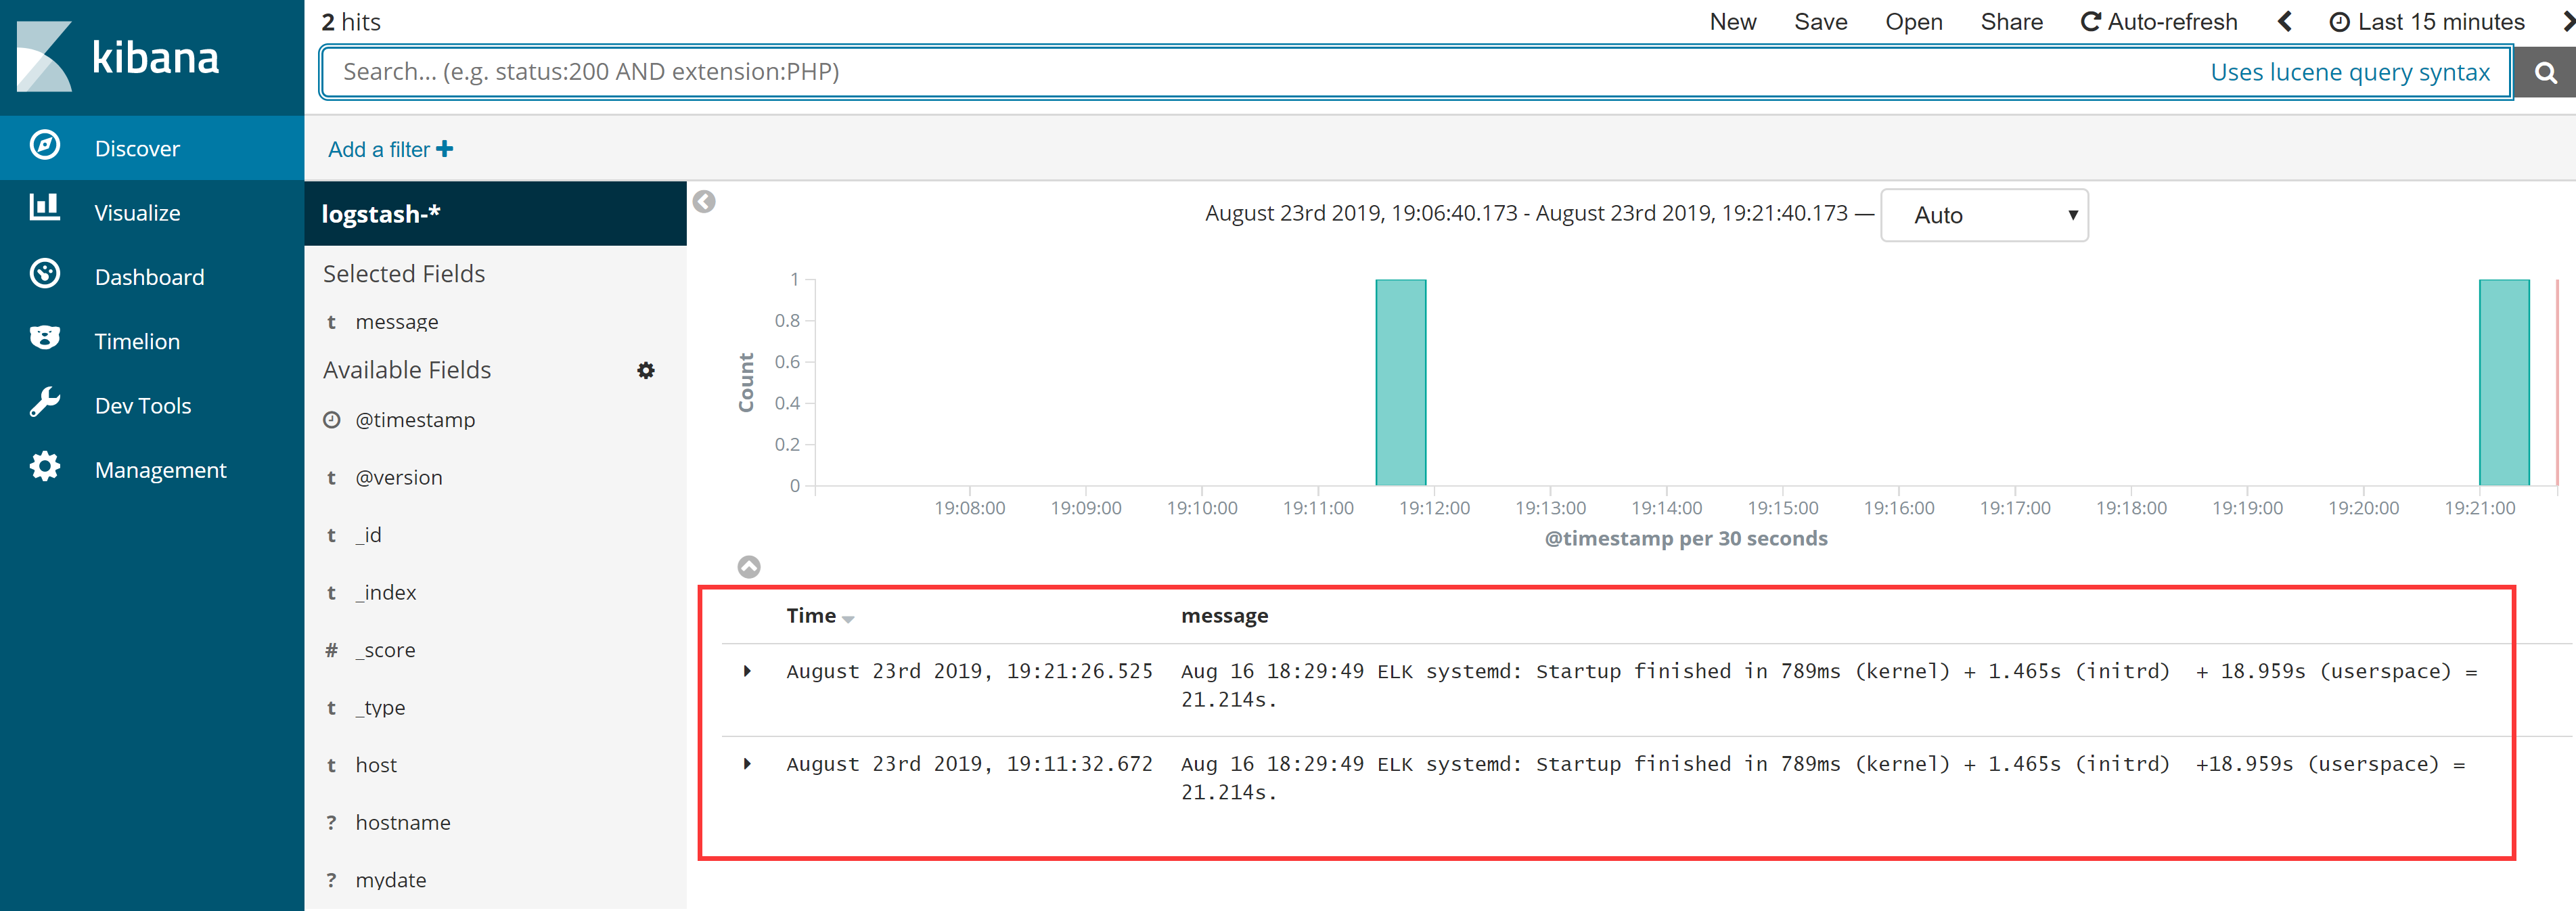
8.2 将抓取的字段信息输入到elasticsearch并显示在kibana上
8.2.1 修改logstash配置文件
[root@ELK-Kibana config]# vim logstash.conf
[root@ELK-Kibana config]# cat logstash.conf
#/bin/bash
#--Mr.yang--

input  {
    stdin{ }
}
filter   {
    grok {
       match => {
          "message" => '(?<mydate>[a-zA-Z]+ [0-9]+ [0-9:]+) (?<hostname  >[a-zA-Z]+).*'
        }
    }
}
output  {
    elasticsearch {
          hosts => ["http://127.0.0.1:9200"]
}
#      stdout {                       #将这三行给注释掉
#          codec => rubydebug         #将这三行给注释掉
#      }                              #将这三行给注释掉
}
8.2.2 交互式启动logstash
[root@ELK-Kibana config]# /usr/local/logstash/bin/logstash -f /usr/local/logstash/config/logstash.conf

#用于进行测试输入的日志内容
Aug 16 18:29:49 ELK systemd: Startup finished in 789ms (kernel) + 1.465s (initrd)  + 18.959s (userspace) = 21.214s.
9. ELK技术全量分析nginx日志
logstash如果直接把一整行日志直接发送给elasticsearch,kibana显示出来就没有什么 意义,我们需要提取自己想要的字段。假如说我们想要提取响应码,用户访问url,响应 时间等,就得依靠正则来提取。
#logstash提取数据段配置文件模板详解
input {  #日志输入来源函数
   file {
      path => "/usr/local/nginx/logs/kibana_access.log"
      }
  }
     filter    {  #字段数据提取函数
        grok  {
          match => {
              "message" => '(?<字段名>正则表达式).*'
             }
       }
}
output {  #数据输出目的地函数
     elasticsearch {
          hosts => ["http://127.0.0.1:9200"]
     }
}
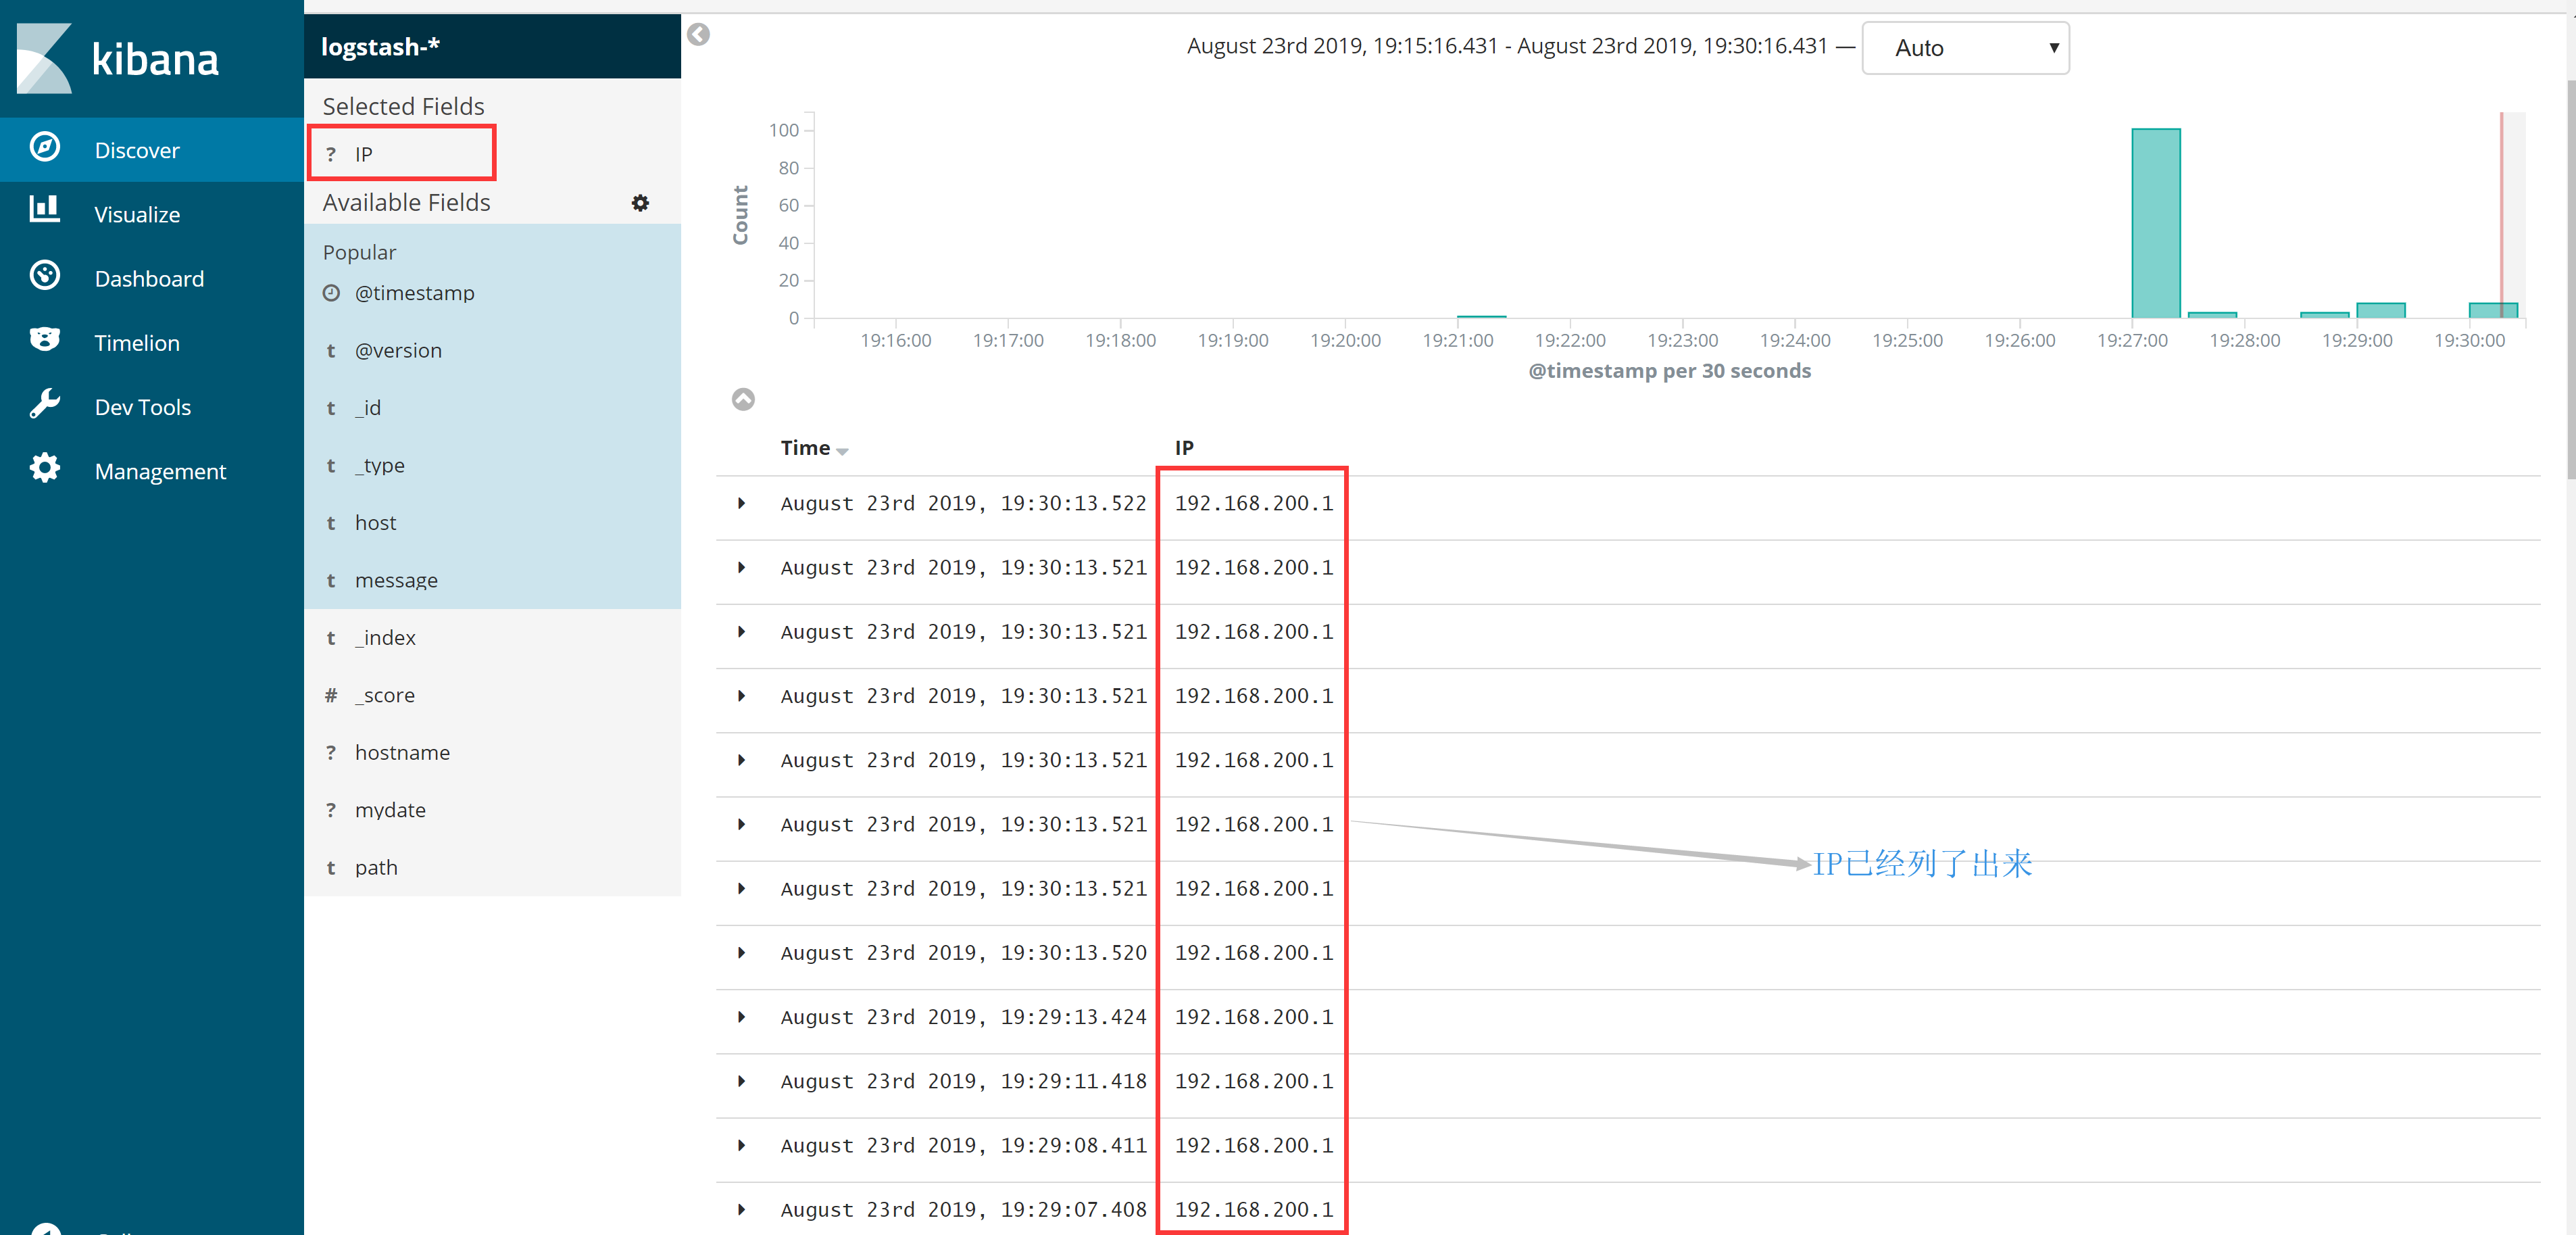
9.1 利用正则从message中提取kibana访问日志的IP地址
9.1.1 修改logstash配置文件
[root@ELK-Kibana config]# vim logstash.conf
[root@ELK-Kibana config]# cat logstash.conf
#/bin/bash
#--Mr.yang--

input  {
     file {
        path => "/usr/local/nginx/logs/kibana_access.log"
      }
  }
  filter   {
      grok {
         match => {
            "message" => '(?<IP>[0-9.]+) .*'
         }
     }
}
output {
    elasticsearch {
        hosts => ["http://127.0.0.1:9200"]
    }
}
9.1.2 交互式启动logstash
[root@ELK-Kibana config]# /usr/local/logstash/bin/logstash -f /usr/local/logstash/config/logstash.conf
9.1.3 检查测试结果
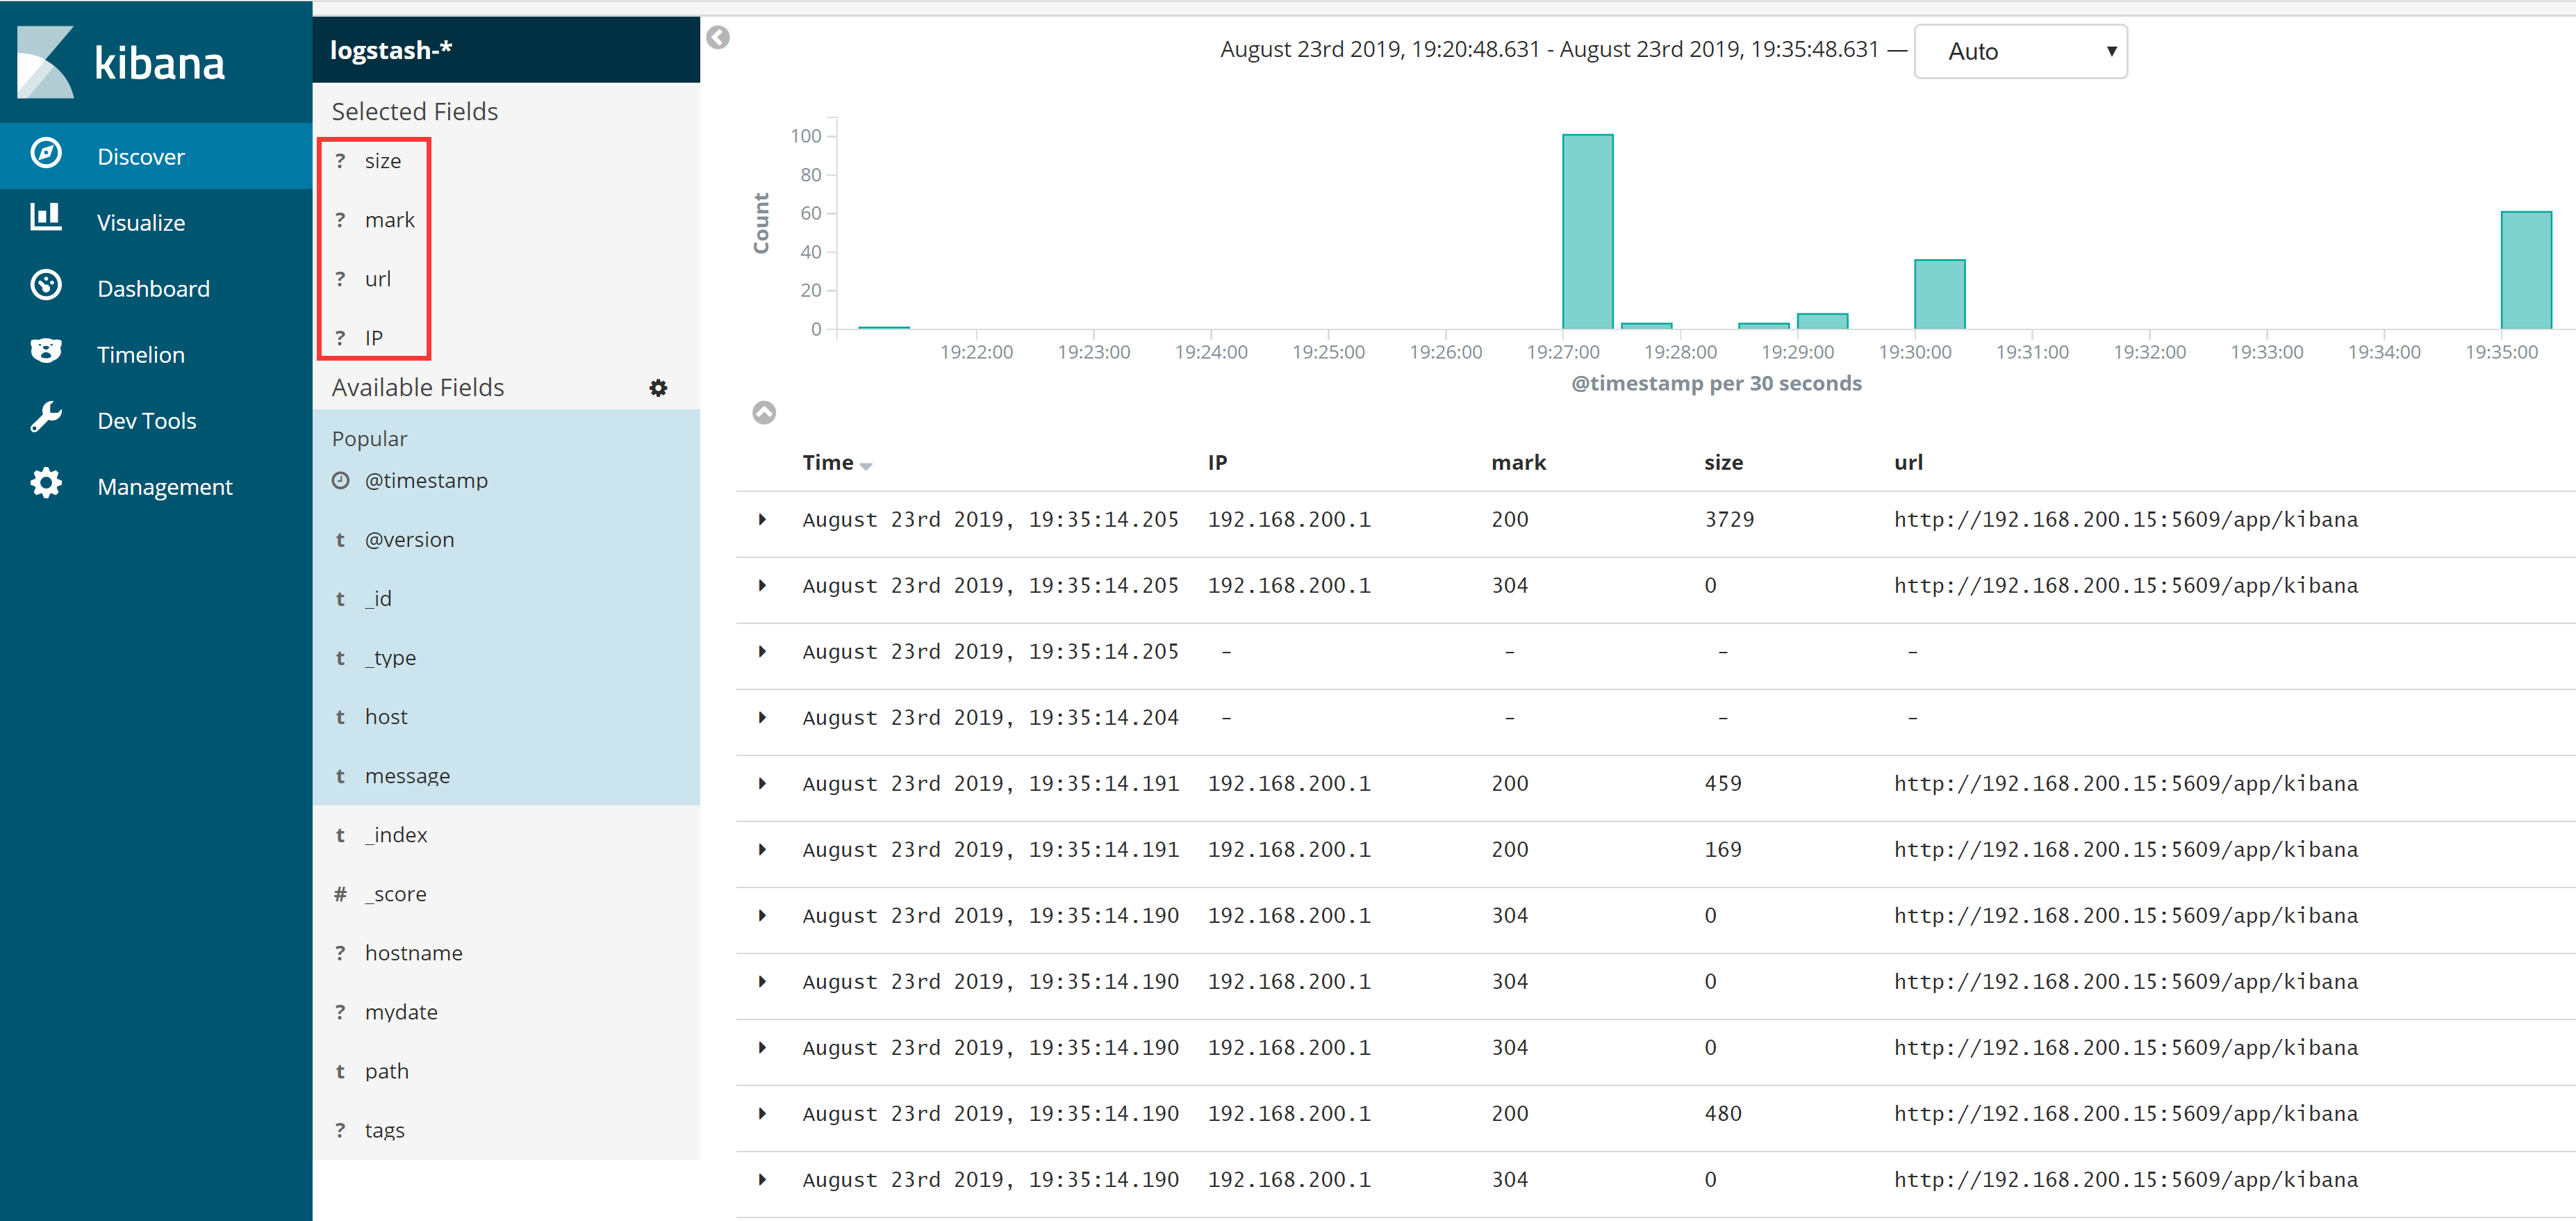
9.2 从message中提取kibana访问日志的time,url,返 回码,字节大小
9.2.1 修改logstash配置文件
[root@ELK-Kibana config]# vim logstash.conf
[root@ELK-Kibana config]# cat logstash.conf
#/bin/bash
#--Mr.yang--

input  {
    file {
        path => "/usr/local/nginx/logs/kibana_access.log"
     }
  }
  filter {
      grok {
          match => {
             "message" => '(?<IP>[0-9.]+) .*HTTP/[0-9.]+"(?<mark>[0-9]+) (?<size>[0-9]+)[ "]+(?<url>[a-zA-Z]+://[0-9.]+:[0-9]+/[a-zA-Z/]+)".*'
           }
     }
}
output {
   elasticsearch {
         hosts => ["http://127.0.0.1:9200"]
     }
}
9.2.2 交互式启动logstash
[root@ELK-Kibana config]# /usr/local/logstash/bin/logstash -f /usr/local/logstash/config/logstash.conf
9.2.3 检查测试结果