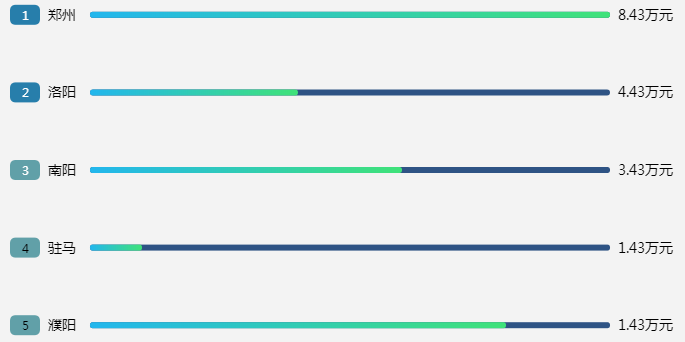
• echarts 柱状图


    var index = 0;
    var colorList = ['#fff', '#000'];
    option = {
        // backgroundColor:"#17326b",
        grid:{
            left:"80",
            top:"10",
            right:"60",
            bottom:"60",
            containLabel:true
        },
        xAxis: {
            show:false
        },
        yAxis:[
           {
                type: 'category',
                axisTick:{show:false},
                axisLine:{show:false},
                axisLabel:{
                    color:"black",
                    fontSize:14,
                    padding:[0,6,0,0],
                    textStyle: {
                          color: '#000',
                       
                    },
                    rich: {
                        a1: {
                            color:  colorList[0],
                             30,
                            height: 20,
                            align: 'center',
                            backgroundColor:"#277eab",
                            borderRadius:6
                        },
                        a2: {
                            color: colorList[0],
                             30,
                            height: 20,
                            align: 'center',
                            backgroundColor:"#277eab",
                            borderRadius:6
                        },
                        a3: {
                            color: colorList[0],
                             30,
                            height: 20,
                            align: 'center',
                            backgroundColor:"#61a0a8",
                            borderRadius:6
                        },
                        b: {
                            color:colorList[1],
                             30,
                            height: 20,
                            align: 'center',
                            backgroundColor:"#61a0a8",
                            borderRadius:6
                        }
                    },
                    formatter: function(params) {
                        if (index == 5) {
                            index = 0;
                        }
                        index++;
                        if (index - 1 < 3) {
                            return [
                                '{a' + index + '|' + index + '}' + '  ' + params
                            ].join('
    ').substring(0,10)
                        } else {
                            return [
                                '{b|' + index + '}' + '  ' + params
                            ].join('
    ').substring(0, 9)
                        }
                        
                    },
                    
                },
                
                data:["郑州","洛阳","南阳","驻马店","濮阳"],
                inverse:true,
                // scale:true,
              
            },
             {
                type: 'category',
                axisTick:{show:false},
                axisLine:{show:false},
                axisLabel:{
                    color:"black",
                    fontSize:14,
                    textStyle: {
                          color: '#000'
                    }
                },
                data:["8.43万元","4.43万元","3.43万元","1.43万元","1.43万元"],
                inverse:true,
                
                
            }
        ],
        series: [
          {
            name:"条",
            type:"bar",
            barWidth:6,
            data:[100,40,60,10,80],
            barCategoryGap:10,
            itemStyle:{
                normal:{
                    barBorderRadius:10,
                    color: new echarts.graphic.LinearGradient(0, 0, 1, 0, [{
                      offset: 0,
                      color: '#22b6ed'
                    }, {
                      offset: 1,
                      color: '#3fE279'
                    }]),
                }
            },
            zlevel:1
            
          },{
              name:"进度条背景",
              type:"bar",
              barGap:"-100%",
              barWidth:6,
              data:[100,100,100,100,100],
              color:"#2e5384",
              itemStyle:{
                  normal:{
                      barBorderRadius:10
                  }
              },
          }
        ]
    };
  • 相关阅读:
    css3-响应式布局
    css3-盒模型新增属性
    css3-弹性盒模型
    阿里天池超级码力复赛
    [状态压缩dp]Leetcode5.02双周赛 每个人戴不同帽子的方案数
    算法编程题:魔塔
    [Dijkstra贪心思想妙用]真实笔试题:传送门
    2020 力扣杯!Code Your Future 春季全国编程大赛 个人赛
    经典笔试算法题之打小怪兽
    两道经典面试算法题2020-3-20(打牌,最长上升字符串拼接)
  • 原文地址:https://www.cnblogs.com/yunyin/p/13913129.html
Copyright © 2020-2023  润新知