1.引用ArcGis for javascript核心类库的两种方式:
1.1.下载js包,解压缩放入项目中
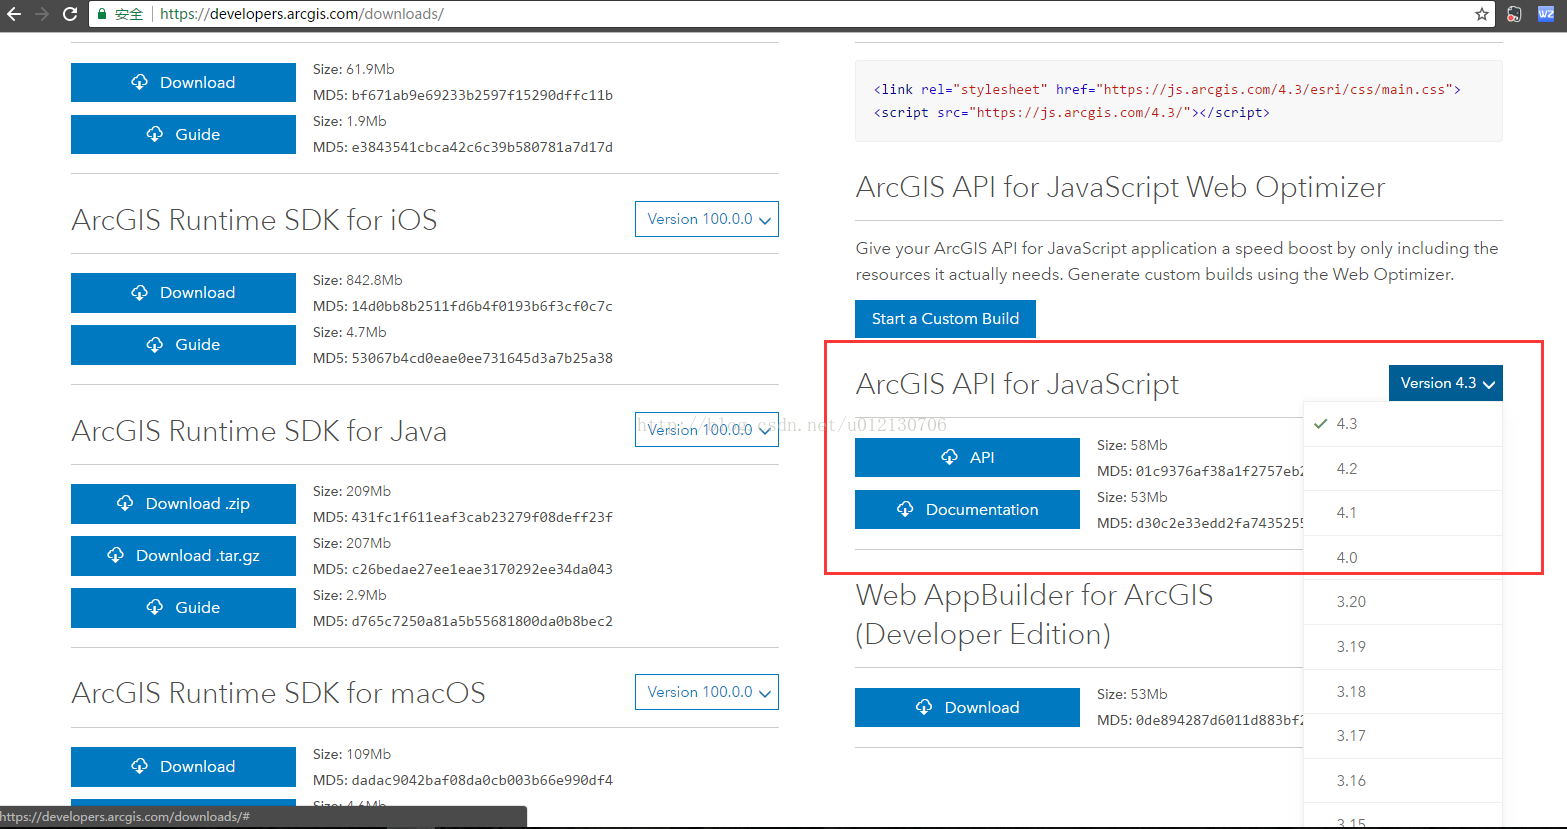
1.1.1.下载核心类库压缩文件, 下载地址: https://developers.arcgis.com/downloads/
1.1.2.将下载好的文件解压缩放入项目
1.1.3.更改核心类库中的相关文件中的路径
1> 更改 ../arcgis_js_api/library/3.22/3.22/init.js 与 ../arcgis_js_api/library/3.22/3.22/dojo/dojo.js 文件
2> 将 "https://[HOSTNAME_AND_PATH_TO_JSAPI]dojo" 改为 "http://ip:port/项目路径/arcgis_js_api/library/3.22/3.22/dojo/dojo"
1.2.引用在线js类库
1 // Reference the JavaScript API from our CDN and you are ready to get started:
2 <link rel="stylesheet" href="https://js.arcgis.com/3.23/esri/css/esri.css">
3 <script src="https://js.arcgis.com/3.23/"></script>
2.创建MAP实例
2.1.创建一个div存放地图
<div id="myMap"></div>
2.2.使用dojo引入地图所需要的工具类,例如:
 1 dojo.require('esri.layers.WebTiledLayer');   // 加载天地图
 2 dojo.require('dojo.parser');
 3 dojo.require('esri.request');
 4 dojo.require('dojo.domReady!');
 5 dojo.require('esri.layers.FeatureLayer');
 6 dojo.require('esri.layers.GraphicsLayer');
 7 dojo.require('esri.toolbars.navigation');
 8 dojo.require('esri.dijit.OverviewMap');
 9 dojo.require('esri.toolbars.draw');
10 dojo.require('esri.tasks.query');
11 dojo.require('esri.dijit.Scalebar');
12 dojo.require('dijit.dijit');
13 dojo.require('dijit.form.Button');
14 dojo.require('dijit.Toolbar');
15 dojo.require('dijit.layout.BorderContainer');
16 dojo.require('dijit.layout.ContentPane');
17 dojo.require('dijit.layout.AccordionContainer');
18 dojo.require('dojo.date.locale');
19 dojo.require('dojo.dom-style');
2.3.调用mapInit函数初始化地图
dojo.ready(mapInit); // 初始化地图
2.4.在mapInit函数中处理地图的事件
2.4.1:初始化地图范围方式一:
 1 function mapInit() {
 2     // 初始化范围设置
 3     startExtent = new esri.geometry.Extent(mixX, mixY, maxX, maxY,
 4         new esri.SpatialReference({wkid: 4490})
 5     );
 6     esri.config.defaults.map.sliderLabel = null;
 7     map = new esri.Map("map", {
 8         logo: false,
 9         slider: false,
10         extent: startExtent
11     });
12 }
2.4.2.初始化地图范围方式二:
 1 esri.config.defaults.map.sliderLabel = null;
 2 map = new esri.Map('myMap', {
 3     logo: false,
 4     slider: false,
 5     maxZoom: z,
 6     spatialReference: {
 7         wkid: 4490,
 8     },
 9 });
10 point = new esri.geometry.Point(x, y);
11 map.centerAndZoom(point, z);
2.4.3.初始化地图范围方式三:(推荐)
1 esri.config.defaults.map.sliderLabel = null;
2 map = new esri.Map("map", {
3     center : [ x, y ],
4     zoom : z,
5     logo : false,
6     spatialReference : {
7         "wkid" : 4326
8     }
9 });
2.5.引入地图(瓦片图层或数据图层)
2.5.1.引入瓦片图层:
<!-- 引入瓦片地图 -->
arcGISTiledMapServiceLayer = new esri.layers.ArcGISTiledMapServiceLayer(`http://ip:port/arcgis/rest/services/map/mapService/MapServer/`, {
    id: 'arcGISTiledMapServiceLayer',
    outFields: ['*'],
});
map.addLayers([arcGISTiledMapServiceLayer]);
2.5.2.引入在线缓存地图:
<!-- 引入缓存地图 -->
arcGISDynamicMapServiceLayer = new esri.layers.ArcGISDynamicMapServiceLayer('http://ip:port/arcgis/rest/services/map/mapService/MapServer/', {
    id: 'arcGISDynamicMapServiceLayer',
    outFields: ['*'],
});
map.addLayers([arcGISDynamicMapServiceLayer]);
2.5.3.引入数据图层:
<!-- 引入数据图层 -->
featureLayer = new esri.layers.FeatureLayer("http://ip:port/arcgis/rest/services/map/mapService/MapServer/0", {
    mode: esri.layers.FeatureLayer.MODE_ONDEMAND,
    id: "featureLayer",
    outFields: ["*"]
});
map.addLayers([featureLayer]);
2.5.4.引入graphic图层
<!-- 引入graphic图层 -->
graphicLayer = new esri.layers.GraphicsLayer({
  id: 'graphicLayer',
  outFields: ['*'],
});
map.addLayers([graphicLayer]);
2.5.5.给地图设置比例尺
scalebar = new esri.dijit.Scalebar({
    map, // 地图对象
    attachTo: 'bottom-right', // 控件的位置,右下角
    scalebarStyle: 'line',  // line 比例尺样式类型
    scalebarUnit: 'metric',   // 显示地图的单位,这里是km
});
2.5.6.给地图上的图绑定事件
2.5.6.1.点击事件:
<!-- 给地图的底图或数据图层绑定点击事件 -->
dojo.connect(map, 'onClick', function() {
    ......
});
2.5.6.2.点击事件:
<!-- 给地图绑定当地图的比例尺被改变时事件 -->
dojo.connect(map, 'onZoomEnd', function() {
    ......
});
2.5.6.3.底图加载完成事件:
<!-- 当地图加载完后事件 -->
dojo.connect(map, 'onUpdateEnd', function() {
    ......
});
2.5.6.4.鼠标移入事件:
<!-- 鼠标移入事件 -->
dojo.connect(StreetLightsRtus, 'onMouseOver', function(evt) {
    map.setMapCursor('pointer');
    ......
});
2.5.6.5.鼠标移出事件:
<!-- 鼠标移出事件 -->
dojo.connect(StreetLightsRtus, 'onMouseOut', function() {
    map.setMapCursor('');
    ......
});
2.5.6.6.地图要素的框选
<!-- 引入相关依赖 -->
dojo.require('esri.toolbars.draw');

<!-- 加载框选工具Draw -->
map.onLoad = initToolbar();

<!-- 禁用框选工具Draw -->
draw.deactivate();

<!-- 框选 -->
function initToolbar() {
    draw = new esri.toolbars.Draw(map);
    // 当完成框选范围时,在范围内找到点
    dojo.connect(draw, 'onDrawEnd', function() {
        <!-- 找到范围内的graphic要素 -->
        if (graphicLayer !== undefined) {
            for (let i = 0; i < graphicLayer.graphics.length; i += 1) {
                // 判断开关箱是否在框选范围
                obj = graphicLayer.graphics[i];
                if (obj.geometry !== undefined) {
                    if (obj.visible && extent.contains(obj.geometry)) {
                        rtuObjectArr.push(obj.attributes.id);
                    }
                }
            }
        }
        <!-- 找到范围内的feature要素 -->
        if (featureLayer !== undefined) {
            for (let i = 0; i < featureLayer.graphics.length; i += 1) {
                // 判断开关箱是否在框选范围
                obj = featureLayer.graphics[i];
                if (obj.geometry !== undefined) {
                    if (obj.visible && extent.contains(obj.geometry)) {
                        rtuObjectArr.push(obj.attributes.id);
                    }
                }
            }
        }
    });
}
2.5.6.7.图层的显示与隐藏
2.5.6.7.1.图层的显示
arcGISTiledMapServiceLayer.show();
arcGISDynamicMapServiceLayer.show();
featureLayer.show();
graphicLayer.show();
2.5.6.7.2.图层的显示
arcGISTiledMapServiceLayer.hide();
arcGISDynamicMapServiceLayer.hide();
featureLayer.hide();
graphicLayer.hide();
2.6.graphicLayer图层数据的增`删`改
2.6.1.添加要素
<!-- 新增要素 -->
function mapAddGraphic() {
    point = new esri.geometry.Point(x, y);
    symbol = new esri.symbol.PictureMarkerSymbol("../../../xxx.png", 16, 16);
    attributes = {
        "id": 1,
        "name":"新增测试"
    }
    graphic = new esri.Graphic(point, symbol, attributes);
    graphicLayer.add(graphic);
}
2.6.2.更改要素
<!-- 更改要素 -->
function mapModifyGraphic() {
    point = new esri.geometry.Point(x, y);
    symbol = new esri.symbol.PictureMarkerSymbol("../../../xxx.png", 16, 16);
    attributes = {
        "id": 1,
        "name":"更改测试"
    }
    graphic = new esri.Graphic(point, symbol, attributes);
    for (let i = 0; i < graphicLayer.graphics.length; i += 1) {
        if (graphicLayer.graphics[i].attributes.id === attributes.id) {
            graphicLayer.remove(graphicLayer.graphics[i]);
        }
    }
    graphicLayer.add(graphic);
}
2.6.3.删除要素
<!-- 删除要素 -->
function mapDeleteGraphic(graphic) {
    for (let i = 0; i < graphicLayer.graphics.length; i += 1) {
        if (graphicLayer.graphics[i].attributes.id === graphic.id) {
            graphicLayer.remove(graphicLayer.graphics[i]);
        }
    }
}
2.7.featureLayer图层数据的增`删`改
featureLayer图层数据的增`删`改对应的要修改ArcGis Server端的数据,所以该featureLayer引用的数据链接在发布图层的时候必须开启Feature Access功能
2.7.1.添加要素
<!-- 1.引入dojo依赖 -->
dojo.require('esri.dijit.editing.Add');

<!-- 2.进行添加 -->
function mapAddFeature() {
    featureLayer = new esri.layers.FeatureLayer(`${layerUrl}1`, {
        mode: esri.layers.FeatureLayer.MODE_SNAPSHOT,
        outFields: ['*'],
    });
    point = new esri.geometry.Point(x, y);
    symbol = new esri.symbol.PictureMarkerSymbol("../../../xxx.png", 16, 16);
    attributes = {
        "id": 1,
        "name":"新增测试"
    }
    graphic = new esri.Graphic(point, symbol, attributes);
    RtuAdd = new esri.dijit.editing.Add({
        featureLayer,             // 给哪一个要素图层添加要素
        addedGraphics: [graphic], // 用于添加的要素
    });
    // 执行添加函数
    RtuAdd.performRedo();
    featureLayer.refresh();
    graphic.setSymbol(symbol);
    featureLayer.add(graphic);
}
2.7.2.更改要素
<!-- 1.引入dojo依赖 -->
dojo.require('esri.dijit.editing.Update');
dojo.require('esri.tasks.query');

<!-- 2.进行更改 -->
function mapModifyFeature() {
    featureLayer = new esri.layers.FeatureLayer(`${layerUrl}1`, {
        mode: esri.layers.FeatureLayer.MODE_SNAPSHOT,
        outFields: ['*'],
    });
    query = new esri.tasks.Query();
    query.returnGeometry = true;
    query.outFields = ['*'];
    query.where = `id=1`;
    queryTask = new esri.tasks.QueryTask(`${layerUrl}`);
    queryTask.execute(query, (results) => {
        if (results.features.length > 0) {
            oldGraphic = results.features[0];
            point = new esri.geometry.Point(x, y);
            symbol = new esri.symbol.PictureMarkerSymbol("../../../xxx.png", 16, 16);
            newGraphic = new esri.Graphic(point, symbol, oldGraphic.attributes);
            newGraphic.attributes.id = 1;
            newGraphic.attributes.name = "更改测试";
            newGraphic.attributes.x = x;
            newGraphic.attributes.y = y;
            RtuUpdate = new esri.dijit.editing.Update({
                featureLayer,
                postUpdatedGraphics: [newGraphic], // 修改之后的要素
                preUpdatedGraphics: [oldGraphic],  // 修改之前的要素
            });
            RtuUpdate.performRedo();
            featureLayer.refresh();
            for (let i = 0; i < graphicLayer.graphics.length; i += 1) {
                if (graphicLayer.graphics[i].attributes.id === oldGraphic.id) {
                    graphicLayer.remove(graphicLayer.graphics[i]);
                }
            }
            featureLayer.add(newGraphic);
        } else {
            mapAddFeature();
        }
    });
}
2.7.3.删除要素
<!-- 1.引入dojo依赖 -->
dojo.require('esri.dijit.editing.Delete');
dojo.require('esri.tasks.query');

<!-- 2.进行更改 -->
function mapDeleteLamp() {
    featureLayer = new esri.layers.FeatureLayer(`${layerUrl}1`, {
        mode: esri.layers.FeatureLayer.MODE_SNAPSHOT,
        outFields: ['*'],
    });
    query = new esri.tasks.Query();
    query.returnGeometry = true;
    query.outFields = ['*'];
    query.where = `id=1`;
    queryTask = new esri.tasks.QueryTask(`${layerUrl}`);
    queryTask.execute(query, (results) => {
        graphic = results.features[0];
        RtuDelete = new esri.dijit.editing.Delete({
            featureLayer,
            deletedGraphics: [graphic],
        });
        RtuDelete.performRedo();
        featureLayer.refresh();
        for (let i = 0; i < featureLayer.graphics.length; i += 1) {
            if (featureLayer.graphics[i].attributes.id === id) {
                featureLayer.remove(featureLayer.graphics[i]);
            }
        }
    });
}
3.1.根据经纬度数组在地图上画线
polylineJson = { "paths": [[[120.140524529883, 30.3270758041052], [120.140235682031, 30.3270525737175], [120.139817472998, 30.3270240400276], [120.139431404836, 30.3270008815856]]]};
xlPolyline = new esri.geometry.Polyline(polylineJson);
xlSymbol = new esri.symbol.SimpleLineSymbol(esri.symbol.SimpleLineSymbol.STYLE_SOLID, new dojo.Color('#00FF00'), 4);
xlGraphic = new esri.Graphic(xlPolyline, xlSymbol);
polylineLayer.add(xlGraphic);
3.2.跟据经纬度在地图上画圆
point = new esri.geometry.Point(x, y);
symbol = new esri.symbol.SimpleMarkerSymbol(esri.symbol.SimpleMarkerSymbol.STYLE_CIRCLE, (r)),
    new esri.symbol.SimpleLineSymbol(esri.symbol.SimpleLineSymbol.STYLE_SOLID,
        new dojo.Color([255, 0, 0]), 0.1),
    new dojo.Color([255, 0, 0, 0.6]));
graphic = new esri.Graphic(point, symbol, item);
schoolElectricityLayer.add(graphic);
3.3.根据经纬度数组在地图上画面
polygonJson ={
    rings: [[
        [120.193451, 30.283218], [120.194453, 30.263535], [120.165335, 30.264035], [120.161023, 30.278568],
        [120.168414, 30.280866], [120.166471, 30.288568], [120.162369, 30.288824], [120.158991, 30.295311],
        [120.172835, 30.300009], [120.16372, 30.314242], [120.164879, 30.317144], [120.192948, 30.352787],
        [120.20639, 30.3569], [120.21079, 30.35175], [120.218307, 30.351427], [120.217978, 30.340206],
        [120.209947, 30.336802], [120.209419, 30.328492], [120.203206, 30.327809], [120.213779, 30.326153],
        [120.209763, 30.321596], [120.19666, 30.318027], [120.194544, 30.307804], [120.19983, 30.308465],
        [120.191775, 30.295249], [120.193451, 30.283218]]],
    spatialReference: {wkid: 4326}
};

polygon = new esri.geometry.Polygon(polygonJson);
symbol = new esri.symbol.SimpleFillSymbol(
    esri.symbol.SimpleFillSymbol.STYLE_SOLID,
    new esri.symbol.SimpleLineSymbol(
        esri.symbol.SimpleLineSymbol.STYLE_SOLID,
        new dojo.Color("#ff0000"), 1),
    new dojo.Color([172, 148, 85, 0.25]));
graphic = new esri.Graphic(polygon, symbol, {行政区: "下城区"});
polygonLayer.add(graphic);
3.4.根据经纬度定位地图中心
function mapSetPointAndZoom(x, y, z) {
    point = new esri.geometry.Point(x, y);
    map.centerAndZoom(point, z);
}
3.5.根据经纬度数数组在地图上进行轨迹运动
3.5.1.创建按钮事件:
<div id="myMap">
    <span>
        <input type="button" id="runningStark" value="设置起点" onclick="runningStark()"/>
        <input type="button" id="openTool"   value="开启" onclick="openTool()"/>
        <input type="button" id="closeTool"  value="暂停" onclick="closeTool()"/>
        <input type="button" id="continueTool"  disabled="disabled" value="继续" onclick="continueTool()"/>
        <input type="button" id="returnTool" disabled="disabled" readonly value="返回" onclick="returnTool()"/>
    </span>
</div>
3.5.2.准备数据:
polylineJson = { // 测试数据
    "paths": [[
        [120.140524529883, 30.3270758041052], [120.140235682031, 30.3270525737175], [120.139817472998, 30.3270240400276], [120.139431404836, 30.3270008815856],
        [120.139123789931, 30.3270506635574], [120.138809475077, 30.3271387683396], [120.138707810317, 30.3269174361909], [120.138343646942, 30.3268787653429],
        [120.138002517003, 30.3268448321235], [120.137661679343, 30.3268103188413], [120.137338229176, 30.3267788839385], [120.137012494731, 30.3267463536615],
        [120.136655150015, 30.3267106370864], [120.136298906969, 30.3266752415693], [120.135942734070, 30.3266398667366], [120.135580169689, 30.3266049748399],
        [120.135589970501, 30.3265466502079], [120.135493511916, 30.3265342665433], [120.135307094147, 30.3265103346844], [120.135237810377, 30.3265014403893],
        [120.135230226394, 30.3265702421231], [120.134855343999, 30.3265328932786], [120.134527389128, 30.3265009583527], [120.134170643361, 30.3264658119479],
        [120.133820501315, 30.3264309839029], [120.133472301805, 30.3263960002753], [120.133120725341, 30.3263816030287], [120.132775043034, 30.3263553985830],
        [120.132400386369, 30.3263183069445], [120.132396155958, 30.3263859143786], [120.132103850213, 30.3263658298193], [120.131776976327, 30.3263433701506],
        [120.131677380907, 30.3263365272092], [120.131652148628, 30.3259547497121]
    ]],
    "spatialReference":{"wkid":4326}
};
3.5.3.设置起点:
function runningStark(){
    // 创建路线
    xlPolyline = new esri.geometry.Polyline(polylineJson);
    xlSymbol = new esri.symbol.SimpleLineSymbol(esri.symbol.SimpleLineSymbol.STYLE_DASH,new dojo.Color("#0000FF"),3);
    xlGraphic = new esri.Graphic(xlPolyline,xlSymbol);
    map.graphics.add(xlGraphic);

    // 创建起点
    qdPoint = new esri.geometry.Point(120.140524529883, 30.3270758041052,new esri.SpatialReference({wkid:4490}));
    qdSymbol = new esri.symbol.PictureMarkerSymbol("/demo0607/images/car.png",10,20);
    qdGraphic = new esri.Graphic(qdPoint,qdSymbol);
    map.centerAndZoom(qdPoint,17); // 定位到起点
    map.graphics.add(qdGraphic);
}
3.5.4.开始轨迹:
function openTool(){
    if(typeof(moving)!="undefined"){
        clearInterval(moving); //清除移动
    }
    points = polylineJson.paths[0];
    qdGraphic.geometry.x = points[0][0];
    qdGraphic.geometry.y = points[0][1];
    map.graphics.refresh();
    move(0,1);
    document.getElementById("closeTool").disabled=false;
    document.getElementById("continueTool").disabled=true;
    document.getElementById("returnTool").disabled=true;
}
3.5.5.暂停轨迹
function closeTool(){
    clearInterval(moving);
    document.getElementById("continueTool").disabled=false;
    document.getElementById("returnTool").disabled=false;
}
3.5.6.继续轨迹
function continueTool(){
    if(typeof(moving)!="undefined"){
        clearInterval(moving); // 清除移动
    }
    move(startNum,endNum);
    document.getElementById("returnTool").disabled=true;
}
3.5.7.返回起点
function returnTool(){
    qdGraphic.geometry.x = points[0][0];
    qdGraphic.geometry.y = points[0][1];
    qdGraphic.symbol.angle=0;
    map.graphics.refresh();
    $("continueTool").disabled=true;
}
3.5.8.相关工具函数
3.5.8.1.根据序列点坐标 进行移动
function move(start,end){
    startX = points[start][0];
    startY = points[start][1];
    endX = points[end][0];
    endY = points[end][1];

    p = (endY - startY) / (endX - startX);//斜率
    var v = 0.000315;//距离  距离越小 位置越精确
    moving = setInterval(function(){
        startNum = start;
        endNum = end;
        if(endNum == points.length - 1){
            document.getElementById("closeTool").disabled=true;
            document.getElementById("continueTool").disabled=true;
            document.getElementById("returnTool").disabled=false;
        }
        //分别计算 x,y轴方向速度
        if(Math.abs(p) == Number.POSITIVE_INFINITY){//无穷大
            qdGraphic.geometry.y += v;
        } else {
            if(endX < startX){
                //qdGraphic.geometry.x -= (1 / Math.sqrt(1 + p * p)) * v;
                //qdGraphic.geometry.y -= (p / Math.sqrt(1 + p * p)) * v;
                qdGraphic.geometry.x = endX;
                qdGraphic.geometry.y = endY;
                //计算汽车角度
                qdGraphic.symbol.angle = calculateXAndYVision(startX, startY, endX, endY); //// (Math.PI / 2 - Math.atan(p)) * 180 / Math.PI+180
            } else {
                //qdGraphic.geometry.x += (1 / Math.sqrt(1 + p * p)) * v;
                //qdGraphic.geometry.y += (p / Math.sqrt(1 + p * p)) * v;
                qdGraphic.geometry.x = endX;
                qdGraphic.geometry.y = endY;
                //计算汽车角度
                qdGraphic.symbol.angle = calculateXAndYVision(startX, startY, endX, endY); ////(Math.PI / 2 - Math.atan(p)) * 180 / Math.PI
            }
        }
        //图层刷新
        map.graphics.refresh();
        //if (Math.abs(qdGraphic.geometry.x - endX) <= 0.01 && Math.abs(qdGraphic.geometry.y - endY) <= 0.01) {
            clearInterval(moving);
            startNum = start++;
            endNum = end++;
            if (end < points.length){
                move(start, end);
            }
        //}
    }, 300);
}
3.5.8.2.计算x和y的视角
function calculateXAndYVision(startX, startY, endX, endY){
    tan = Math.atan(Math.abs((endY - startY)/(endX - startX))) * 180 / Math.PI + 90;
    if (endX > startX && endY > startY){ // 第一象限
        return - tan + 180;
    } else if (endX > startX && endY < startY){ // 第二象限
        return tan;
    } else if (endX < startX && endY > startY){ // 第三象限
        return tan - 180;
    } else if (endX < startX && endY < startY){ // 第四象限
        return - tan;
    }
}