simple-statistics官网:https://simplestatistics.org/docs/#median
demo结构:
package.json
{
  "name": "react-blank",
  "version": "0.1.0",
  "private": true,
  "dependencies": {
    "plotly.js": "^1.52.1",
    "react": "^16.12.0",
    "react-dom": "^16.12.0",
    "react-plotly.js": "^2.4.0",
    "react-scripts": "3.3.0",
    "simple-statistics": "^7.0.7"
  },
  "scripts": {
    "start": "react-scripts --max_old_space_size=4096 start",
    "build": "react-scripts --max_old_space_size=4096 build",
    "test": "react-scripts test",
    "eject": "react-scripts eject"
  },
...
}
Figure.jsx
import React from 'react'
import PropTypes from 'prop-types'
import Plot from 'react-plotly.js'
import * as ss from 'simple-statistics'

export default class Figure extends React.PureComponent {
    render() {
        let median = ss.median(this.props.y)
        let quantile20 = ss.quantile(this.props.y, 0.2)
        let quantile80 = ss.quantile(this.props.y, 0.8)

        let median_list = []
        let quantile20_list = []
        let quantile80_list = []

        for (var i = this.props.x.length - 1; i >= 0; i--) {
            median_list.push(median)
            quantile20_list.push(quantile20)
            quantile80_list.push(quantile80)
        }

        return (
            <div>
                <Plot
                    data={[
                        {
                            x: this.props.x,
                            y: this.props.y,
                            type: 'scatter',
                            mode: 'markers',
                            name: 'spread',
                        },
                        {
                            x: this.props.x,
                            y: median_list,
                            type: 'scatter',
                            mode: 'line',
                            name: 'median',
                        },
                        {
                            x: this.props.x,
                            y: quantile20_list,
                            type: 'scatter',
                            mode: 'line',
                            name: 'quantile20',
                        },
                        {
                            x: this.props.x,
                            y: quantile80_list,
                            type: 'scatter',
                            mode: 'line',
                            name: 'quantile80',
                        },
                    ]}
                    layout={{  1500, title: 'Plot' }}
                />
            </div>
        )
    }
}

Figure.propTypes = {
    x: PropTypes.array,
    y: PropTypes.array,
}
index.js
import React from 'react'
import ReactDOM from 'react-dom'

import App from './components/App.jsx'

ReactDOM.render(<App />, document.getElementById('root'))
App.jsx
import React from 'react'
import Figure from './Figure.jsx'

export default class App extends React.Component {
    constructor(props) {
        super(props)
        this.state = {}
    }

    render() {
        const figureDateKeys = Object.keys(figureData)
        return (
            <div>
                {figureData && figureDateKeys.length > 0 && <Figure x={figureDateKeys} y={Object.values(figureData)} />}
            </div>
        )
    }
}

const figureData = {
    "2020-01-20 17:20:00": -0.0027,
    "2020-01-20 17:25:00": -0.0034,
    "2020-01-20 17:30:00": -0.0038,
    "2020-01-20 17:35:00": -0.004,
    "2020-01-20 17:40:00": -0.0041,
    "2020-01-20 17:45:00": -0.0017,
    "2020-01-20 17:50:00": -0.002,
    "2020-01-20 17:55:00": -0.0017,
    "2020-01-20 18:00:00": -0.0014,
    "2020-01-20 18:05:00": -0.0006,
    "2020-01-20 18:10:00": -0.0016,
    "2020-01-20 18:15:00": -0.0025,
    "2020-01-20 18:20:00": -0.003,
    "2020-01-20 18:25:00": -0.0028,
    "2020-01-20 18:30:00": -0.0029,
    "2020-01-20 18:35:00": -0.0031,
    "2020-01-20 18:40:00": -0.0024,
    "2020-01-20 18:45:00": -0.0026,
    "2020-01-20 18:50:00": -0.0021,
    "2020-01-20 18:55:00": -0.0007,
    "2020-01-20 19:00:00": -0.0014,
    "2020-01-20 19:05:00": -0.0018,
    "2020-01-20 19:10:00": -0.0021,
    "2020-01-20 19:15:00": -0.0013,
    "2020-01-20 19:20:00": -0.0015,
    "2020-01-20 19:25:00": -0.002,
    "2020-01-20 19:30:00": -0.0029,
    "2020-01-20 19:35:00": -0.0028,
    "2020-01-20 19:40:00": -0.0034,
    "2020-01-20 19:45:00": -0.004,
    "2020-01-20 19:50:00": -0.0042,
    "2020-01-20 19:55:00": -0.004,
    "2020-01-20 20:00:00": -0.0059,
    "2020-01-20 20:05:00": -0.005,
    "2020-01-20 20:10:00": -0.0055,
    "2020-01-20 20:15:00": -0.0045,
    "2020-01-20 20:20:00": -0.0068,
    "2020-01-20 20:25:00": -0.0009,
    "2020-01-20 20:30:00": -0.0029,
    "2020-01-20 20:35:00": -0.0023,
    "2020-01-20 20:40:00": -0.0035,
    "2020-01-20 20:45:00": 0.0003,
    "2020-01-20 20:50:00": -0.0006,
    "2020-01-20 20:55:00": -0.0024,
    "2020-01-20 21:00:00": -0.002,
    "2020-01-20 21:05:00": -0.0049,
    "2020-01-20 21:10:00": -0.0059,
    "2020-01-20 21:15:00": -0.0087,
    "2020-01-20 21:20:00": -0.0066,
    "2020-01-20 21:25:00": -0.0079,
    "2020-01-20 21:30:00": -0.0051,
    "2020-01-20 21:35:00": -0.0019,
    "2020-01-20 21:40:00": -0.0044,
    "2020-01-20 21:45:00": -0.0018,
    "2020-01-20 21:50:00": 0.0017,
    "2020-01-20 21:55:00": 0.0033,
    "2020-01-20 22:00:00": 0.0005,
    "2020-01-20 22:05:00": 0.0026,
    "2020-01-20 22:10:00": 0.0015,
    "2020-01-20 22:15:00": 0.0017,
    "2020-01-20 22:20:00": 0.0002,
    "2020-01-20 22:25:00": 0.0031,
    "2020-01-20 22:30:00": 0.0026,
    "2020-01-20 22:35:00": -0.0022,
    "2020-01-20 22:40:00": -0.0017,
    "2020-01-20 22:45:00": -0.0028,
    "2020-01-20 22:50:00": -0.0026,
    "2020-01-20 22:55:00": -0.0021,
    "2020-01-20 23:00:00": -0.0025,
    "2020-01-20 23:05:00": -0.0033,
    "2020-01-20 23:10:00": -0.0021,
    "2020-01-20 23:15:00": -0.0012,
    "2020-01-20 23:20:00": -0.0001,
    "2020-01-20 23:25:00": -0.0017,
    "2020-01-20 23:30:00": -0.002,
    "2020-01-20 23:35:00": -0.0008,
    "2020-01-20 23:40:00": -0.0006
}
npm start或npm run build时报错:<--- Last few GCs --->
"scripts": {
    "start": "react-scripts --max_old_space_size=4096 start",
    "build": "react-scripts --max_old_space_size=4096 build"
}
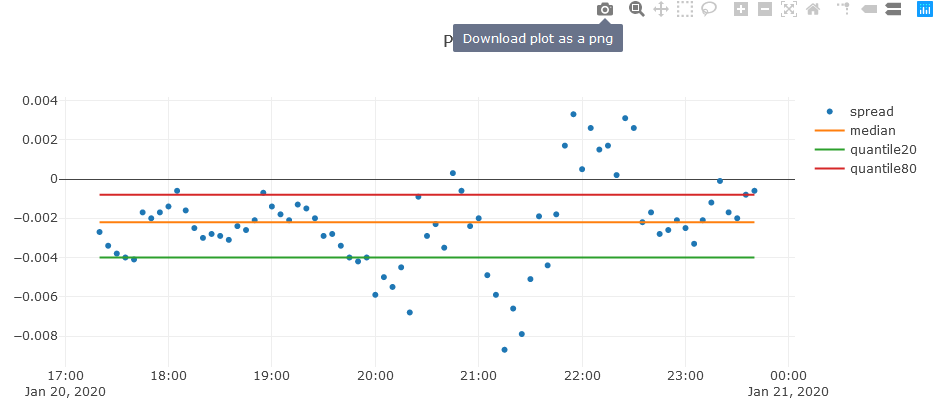
渲染效果:
---