获取数据
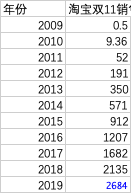
已知过去10年,淘宝双11 的销售额数据如下:

分析数据
整体观察一下数据
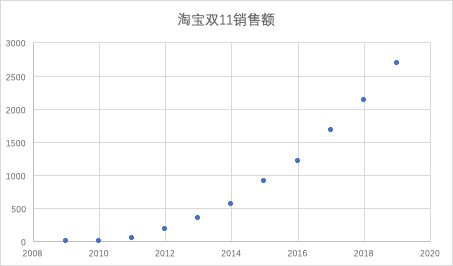
画出散点图,得到:
import matplotlib.pyplot as plt

# 过去10年的数据
X = [year for year in range(2009,2020)]
y = [0.5,9.36,52,191,350,571,912,1207,1682,2135,2684]
plt.scatter(X,y,c='green', alpha=0.6)
plt.show()

设计算法模型
因此我们可以用三次多项式来拟合数据
# 训练模型
# 过去10年的数据
X=[[year] for year in range(2009,2020)]
y=[[0.5],[9.36],[52],[191],[350],[571],[912],[1207],[1682],[2135],[2684]]

from sklearn.preprocessing import PolynomialFeatures
pf = PolynomialFeatures(degree = 3, include_bias = True)
X_new  = pf.fit_transform(X)

from sklearn.linear_model import LinearRegression
reg = LinearRegression()
reg.fit(X_new,y)
print(reg.intercept_)
print(reg.coef_)
进行预测
# 加入预测值并进行预测

# 加入预测值之后
X.append([2020])
X.append([2021])
X_new  = pf.fit_transform(X)

predicts = reg.predict(X_new)
for i in range(len(X)):
    year = X[i]
    predict = predicts[i]
    print("{}	{}".format(year[0],round(predict[0],3)))
可得,
| 年份 | 双11预测交易额 |
|---|---|
| 2020 | 3294.283 |
| 2021 | 3968.579 |