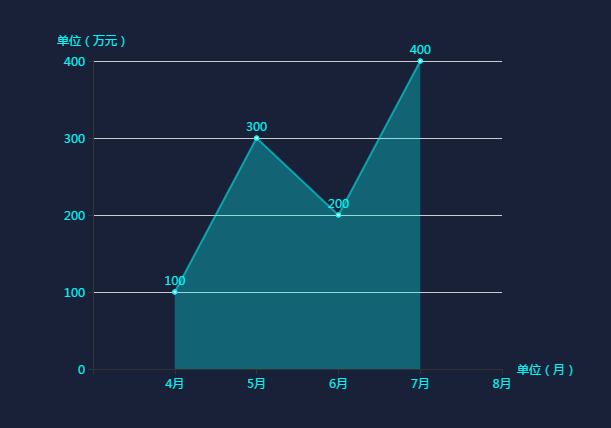
方法一:
data为数组类型的,data:[10,20,30];
HTML
<div class="d_main" id="main3"></div>
css
 .d_main{
    width:80%;
    height:400px;
    margin:0 auto;
  }
js
 1 var myChart3 = echarts.init(document.getElementById('main3'));//    每月标的总额
 2  var option3 = {
 3             backgroundColor:"#192138", //背景颜色
 4             textStyle: {
 5                 color: '#02F5F6'  //全局字体颜色,不设置则每个扇形的字和扇形颜色一致
 6             },
 7             tooltip : {
 8                 trigger: 'axis',
 9                 axisPointer : {
10                     type : 'shadow'
11                 }
12             },
13             grid: {
14                 left: '3%', //表显示的位置
15                 right: '14%',
16                 bottom: '3%',
17                 containLabel: true,
18                 backgroundColor:"rgba(256,256,256,0.5)"
19             },
20             xAxis : [
21                 {
22                     name:"单位(月)",  //x轴单位
23                     type : 'category',
24                     boundaryGap : false,
25                     data : ['','4月','5月','6月','7月','8月']
26                 }
27             ],
28             yAxis : [
29                 {
30                     name:"单位(万元)",//y轴单位
31                     type : 'value'
32                 }
33             ],
34             series : [
35                 {
36                     name:'标的总额',
37                     type:'line',
38                     stack: '总量',
39                     label: {
40                         normal: {
41                             show: true,
42                             position: 'top'
43                         }
44                     },
45                     areaStyle: {
46                         normal: {
47                             color:"#01FFFF", //区域填充颜色
48                             opacity:0.3
49                         }
50                     },
51                     itemStyle:{
52                         normal: {
53                             color:"#01FFFF" //拐点颜色
54                         }
55                     },
56                     data:[],
57                     lineStyle:{
58                         normal:{
59                             color:"#01FFFF", //线条颜色
60                             opacity:0.5
61                         }
62                     }
63                 }
64             ]
65         };
66
67
68  $.get('data.json').done(function (data) {
69             // 填入数据
70             myChart3.setOption({
71                 series: [{
72                     // 根据名字对应到相应的系列
73                     data: data
74                 }]
75             });
76         });
图标展示
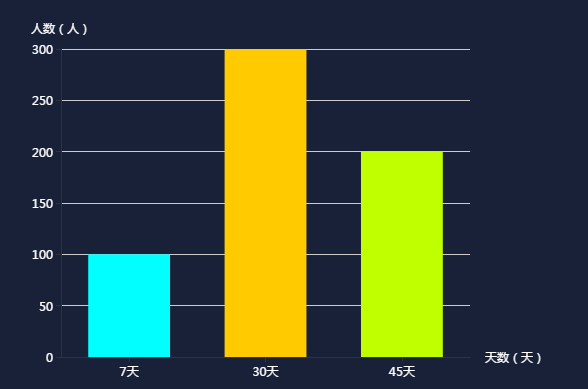
方法二:
data为对象类型,
data:[
    {
        value:134,
        name:'7天标的',
        itemStyle: {
            normal: {
                color: '#01FFFF'
            }
        }
    }
]
HTML
<div class="d_main" id="main1"></div>
js
 1 var myChart1 = echarts.init(document.getElementById('main1'));
 2 var option1 = {
 3             backgroundColor:"#192138",
 4             color: ['#3398DB'],
 5             textStyle: {
 6                 color: '#FFF'  //全局字体颜色,不设置则每个扇形的字和扇形颜色一致
 7             },
 8             tooltip : {
 9                 trigger: 'axis',
10                 axisPointer : {            // 坐标轴指示器,坐标轴触发有效
11                     type : 'shadow'        // 默认为直线,可选为:'line' | 'shadow'
12                 }
13             },
14             grid: {
15                 left: '3%',
16                 right: '14%',
17                 bottom: '3%',
18                 containLabel: true
19             },
20             xAxis : [
21                 {
22                     name:"天数(天)",
23                     type : 'category',
24                     data : ['7天', '30天', '45天'],
25                     axisTick: {
26                         alignWithLabel: true
27                     }
28                 }
29             ],
30             yAxis : [
31                 {
32                     name:"人数(人)",
33                     type : 'value'
34                 }
35             ],
36             series : [
37                 {
38 //                name:'直接访问',
39                     type:'bar',
40                     barWidth: '60%',
41                     data:[]
42                 }
43             ]
44         };
45
46 // 使用刚指定的配置项和数据显示图表。
47  myChart1.setOption(option1);
48 $.get('data.json').done(function (data) {
49             // 填入数据
50             var myData=[];
51             var myTemp;
52             var colorList1=['#01FFFF','#FFCA00','#C0FF00'];
53             for(var i=0;i<data.length;i++){
54                 myTemp={value:data[i],itemStyle:{normal:{color:colorList1[i]}}};
55                 myData.push(myTemp);
56             }
57 //            console.log(myData);
58             myChart1.setOption({
59                 series: [{
60                     data:myData
61                 }]
62             });
63         });
图标展示