一个简单的demo
可以通过浏览器开发者工具或者node执行:
// Key terminology:
// training set has training examples (features + target variable)
// In the classification problem the target variables are called classes
// test set
// knowledge representation
function makeTrainingSet(dimension_of_feature, num_of_examples) {
    let result = [];
    for (let i = 0; i != num_of_examples; ++i) {
        let example = {
            features: [],
            label: Math.floor(Math.random() * 3),
        }
        for (let j = 0; j != dimension_of_feature; ++j) {
            example.features[j] = Math.random() * 10
        }
        result.push(example)
    }
    return result
}

let trainingSet = makeTrainingSet(3, 20) // 模拟训练集; 特征向量维数为3; 数据量为20
console.log(trainingSet)

let features = makeTrainingSet(3, 1)[0].features // 此条数据用于测试
console.log(features)

function getDistance(f1, f2) {
    const DIMENSION = f1.length
    // 将距离定义为欧氏距离
    let sumOfSquares = 0
    for (let i = 0; i != DIMENSION; ++i) {
        sumOfSquares += Math.pow(f1[i] - f2[i], 2)
    }
    return Math.sqrt(sumOfSquares)
}

function getKNearestNeighbors(features, k, trainingSet) {
    // 返回值: 数组; k个距离最近的邻居; 对象属性为【距离+标签】
    // 参数: k 邻居个数 ; features 未知数据的特征向量 ; trainingSet 已经贴了标签的数据集
    let distanceSet = trainingSet.map(training_example => {
        let distance = getDistance(features, training_example.features)
        return {
            distance: distance,
            label: training_example.label,
        }
    })
    distanceSet.sort((a, b) => a.distance - b.distance)
    return distanceSet.slice(0, k)
}

console.log(getKNearestNeighbors(features, 5, trainingSet))
输出示例:
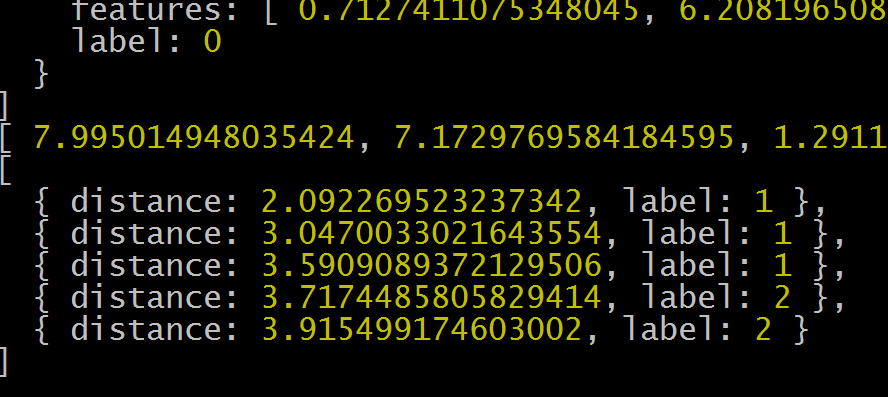
制作模拟数据测试算法
①纯JS版
数据示例:
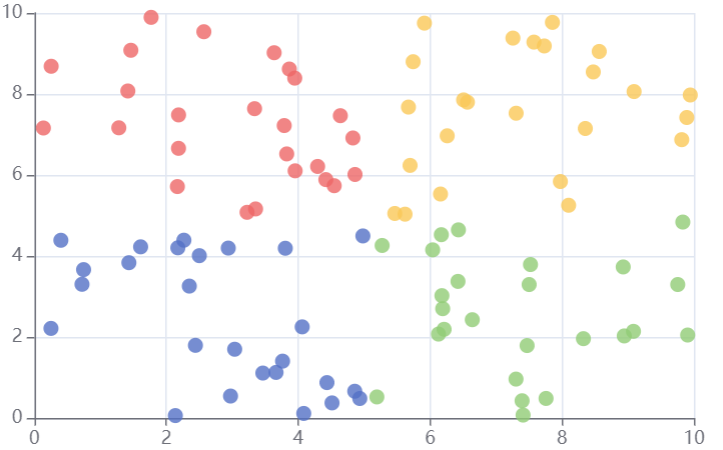
生成数据:


<!DOCTYPE html>
<html>
  <head>
    <meta charset="utf-8" />
    <title>ECharts</title>
    <!-- 引入刚刚下载的 ECharts 文件 -->
    <script src="echarts.js"></script>
    <style>
        main {
            /*对子元素开启弹性布局*/
            display: flex;
            /*弹性元素在必要的时候换行*/
            flex-wrap: wrap;
            /*将弹性元素居中*/
            justify-content: center;
        }
    </style>
  </head>
  <body>
    <main>
    </main>
    <script type="text/javascript">
      // 获取一个[0,val)区间内的随机数
      function getRd(val) {
        return Math.random() * val
      }

      //制作二维模拟数据
      //以(0,0)到(10,10)构成正方形,标签0为左下,标签1为右下,标签2为右上,标签3为左上
      function make2DTrainingSet(num_of_examples) {
        let result = [];
        for (let i = 0; i != num_of_examples; ++i) {
            let example = {
                features: [],
                label: Math.floor(getRd(4)),
            }
            if (example.label === 0) {
              example.features[0] = getRd(5)
              example.features[1] = getRd(5)
            } else if (example.label === 1) {
              example.features[0] = 5 + getRd(5)
              example.features[1] = getRd(5)
            } else if (example.label === 2) {
              example.features[0] = 5 + getRd(5)
              example.features[1] = 5 + getRd(5)
            } else {
              example.features[0] = getRd(5)
              example.features[1] = 5 + getRd(5)
            }
            result.push(example)
        }
        return result
      }

      let trainingSet = make2DTrainingSet(100)
      console.log(trainingSet)

      const WIDTH = 600;
      const HEIGHT = 400;
      // main用来放div1
      let container = document.querySelector('main')
      let myDiv = createDiv(WIDTH, HEIGHT)
      container.appendChild(myDiv)
      let chart = echarts.init(myDiv)
      chart.setOption({
        xAxis: {},
        yAxis: {},
        series: [
          {
            type: 'scatter',
            data: trainingSet.filter(x => x.label === 0).map(x => x.features),
          },
          {
            type: 'scatter',
            data: trainingSet.filter(x => x.label === 1).map(x => x.features),
          },
          {
            type: 'scatter',
            data: trainingSet.filter(x => x.label === 2).map(x => x.features),
          },
          {
            type: 'scatter',
            data: trainingSet.filter(x => x.label === 3).map(x => x.features),
          },
        ]
      })

      function createDiv(width, height, display = 'block') {
        let result = document.createElement('div')
        result.style.width = width + 'px'
        result.style.height = height + 'px'
        // result.style.display = display
        return result
      }

      function makeDate(dataSize) {
        let result = [];
        for (let i = 0; i != dataSize; ++i) {
          result.push({
            time: "t" + i,
            data: Math.random(),
          })
        }
        return result;
      }
    </script>
  </body>
</html>
完整代码:
// 调整参数
const TRAINING_SET_SIZE = 200
const TEST_SET_SIZE = 100
const K = 15

// 获取一个[0,val)区间内的随机数
function getRd(val) {
    return Math.random() * val
}

//制作二D模拟数据
//以(0,0)到(10,10)构成正方形,标签0为左下,标签1为右下,标签2为右上,标签3为左上
function make2DTrainingSet(num_of_examples) {
    let result = [];
    for (let i = 0; i != num_of_examples; ++i) {
        let example = {
            features: [],
            label: Math.floor(getRd(4)),
        }
        if (example.label === 0) {
            example.features[0] = getRd(5)
            example.features[1] = getRd(5)
        } else if (example.label === 1) {
            example.features[0] = 5 + getRd(5)
            example.features[1] = getRd(5)
        } else if (example.label === 2) {
            example.features[0] = 5 + getRd(5)
            example.features[1] = 5 + getRd(5)
        } else {
            example.features[0] = getRd(5)
            example.features[1] = 5 + getRd(5)
        }
        result.push(example)
    }
    return result
}

function getDistance(f1, f2) {
    const DIMENSION = f1.length
    // 将距离定义为欧氏距离
    let sumOfSquares = 0
    for (let i = 0; i != DIMENSION; ++i) {
        sumOfSquares += Math.pow(f1[i] - f2[i], 2)
    }
    return Math.sqrt(sumOfSquares)
}

function getKNearestNeighbors(features, k, trainingSet) {
    // 返回值: 数组; k个距离最近的邻居; 对象属性为【距离+标签】
    // 参数: k 邻居个数 ; features 未知数据的特征向量 ; trainingSet 已经贴了标签的数据集
    let distanceSet = trainingSet.map(training_example => {
        let distance = getDistance(features, training_example.features)
        return {
            distance: distance,
            label: training_example.label,
        }
    })
    distanceSet.sort((a, b) => a.distance - b.distance)
    return distanceSet.slice(0, k)
}

function getTargetVariable(features, k, trainingSet) {
    let neighbors = getKNearestNeighbors(features, k, trainingSet)
    // console.log(neighbors)
    let myMap = new Map();
    neighbors.forEach(x => {
        if (myMap.get(x.label)) {
            myMap.set(x.label, myMap.get(x.label) + 1)
        } else {
            myMap.set(x.label, 1)
        }
    });
    // console.log(myMap)
    let result
    let max = 0
    myMap.forEach((val, key) => {
        if (val > max) {
            result = key
            max = val
        }
    })
    return result
}

let trainingSet = make2DTrainingSet(TRAINING_SET_SIZE)
let testSet = make2DTrainingSet(TEST_SET_SIZE)

let correct = 0
for (let i = 0; i != testSet.length; ++i) {
    let testExample = testSet[i]
    let pv = getTargetVariable(testExample.features, K, trainingSet)
    if (pv == testExample.label) {
        correct++
    } else {
        console.log('========W A=========')
        console.log(testExample.label + ' 预测成 ' + pv)
        console.log('features: ', testExample.features)
        console.log('====================')
    }
}

console.log('training set size:', TRAINING_SET_SIZE)
console.log('k:', K)
console.log('correct/total:', correct, TEST_SET_SIZE)
console.log('accurate: ', correct / testSet.length)
输出示例:

②图示版
<!DOCTYPE html>
<html>
  <head>
    <meta charset="utf-8" />
    <title>ECharts</title>
    <!-- 引入刚刚下载的 ECharts 文件 -->
    <script src="echarts.js"></script>
    <style>
        main {
            /*对子元素开启弹性布局*/
            display: flex;
            /*弹性元素在必要的时候换行*/
            flex-wrap: wrap;
            /*将弹性元素居中*/
            justify-content: center;
        }
    </style>
  </head>
  <body>
    <main>
    </main>
    <script>
      // 调整参数
      const TRAINING_SET_SIZE = 200
      const TEST_SET_SIZE = 100
      const K = 20

      // 获取一个[0,val)区间内的随机数
      function getRd(val) {
          return Math.random() * val
      }

      //制作二D模拟数据
      //以(0,0)到(10,10)构成正方形,标签0为左下,标签1为右下,标签2为右上,标签3为左上
      function make2DTrainingSet(num_of_examples) {
          let result = [];
          for (let i = 0; i != num_of_examples; ++i) {
              let example = {
                  features: [],
                  label: Math.floor(getRd(4)),
              }
              if (example.label === 0) {
                  example.features[0] = getRd(5)
                  example.features[1] = getRd(5)
              } else if (example.label === 1) {
                  example.features[0] = 5 + getRd(5)
                  example.features[1] = getRd(5)
              } else if (example.label === 2) {
                  example.features[0] = 5 + getRd(5)
                  example.features[1] = 5 + getRd(5)
              } else {
                  example.features[0] = getRd(5)
                  example.features[1] = 5 + getRd(5)
              }
              result.push(example)
          }
          return result
      }

      function getDistance(f1, f2) {
          const DIMENSION = f1.length
          // 将距离定义为欧氏距离
          let sumOfSquares = 0
          for (let i = 0; i != DIMENSION; ++i) {
              sumOfSquares += Math.pow(f1[i] - f2[i], 2)
          }
          return Math.sqrt(sumOfSquares)
      }

      function getKNearestNeighbors(features, k, trainingSet) {
          // 返回值: 数组; k个距离最近的邻居; 对象属性为【距离+标签】
          // 参数: k 邻居个数 ; features 未知数据的特征向量 ; trainingSet 已经贴了标签的数据集
          let distanceSet = trainingSet.map(training_example => {
              let distance = getDistance(features, training_example.features)
              return {
                  distance: distance,
                  label: training_example.label,
              }
          })
          distanceSet.sort((a, b) => a.distance - b.distance)
          return distanceSet.slice(0, k)
      }

      function getTargetVariable(features, k, trainingSet) {
          let neighbors = getKNearestNeighbors(features, k, trainingSet)
          let myMap = new Map();
          neighbors.forEach(x => {
              if (myMap.get(x.label)) {
                  myMap.set(x.label, myMap.get(x.label) + 1)
              } else {
                  myMap.set(x.label, 1)
              }
          });
          let result
          let max = 0
          myMap.forEach((val, key) => {
              if (val > max) {
                  result = key
                  max = val
              }
          })
          return result
      }

      let trainingSet = make2DTrainingSet(TRAINING_SET_SIZE)
      let testSet = make2DTrainingSet(TEST_SET_SIZE)

      let correct = 0
      let fail = []
      for (let i = 0; i != testSet.length; ++i) {
          let testExample = testSet[i]
          let pv = getTargetVariable(testExample.features, K, trainingSet)
          if (pv == testExample.label) {
              correct++
          } else {
              console.log('========W A=========')
              fail.push(testExample.features)
              console.log(testExample.label + ' 预测成 ' + pv)
              console.log('features: ', testExample.features)
              console.log('====================')
          }
      }

      console.log('training set size:', TRAINING_SET_SIZE)
      console.log('k:', K)
      console.log('correct/total:', correct, TEST_SET_SIZE)
      console.log('accurate: ', correct / testSet.length)

    </script>

    <!-- 展示数据 -->
    <script type="text/javascript">
      const WIDTH = 600;
      const HEIGHT = 400;
      // main用来放div1
      let container = document.querySelector('main')
      let myDiv = createDiv(WIDTH, HEIGHT)
      container.appendChild(myDiv)
      let chart = echarts.init(myDiv)

      chart.setOption({
        xAxis: {},
        yAxis: {},
        series: [
          {
            type: 'scatter',
            data: trainingSet.filter(x => x.label === 0).map(x => x.features),
          },
          {
            type: 'scatter',
            data: trainingSet.filter(x => x.label === 1).map(x => x.features),
          },
          {
            type: 'scatter',
            data: trainingSet.filter(x => x.label === 2).map(x => x.features),
          },
          {
            type: 'scatter',
            data: trainingSet.filter(x => x.label === 3).map(x => x.features),
          },
          {
            type: 'scatter',
            data: fail,
          },
        ]
      })

      function createDiv(width, height, display = 'block') {
        let result = document.createElement('div')
        result.style.width = width + 'px'
        result.style.height = height + 'px'
        // result.style.display = display
        return result
      }

      function makeDate(dataSize) {
        let result = [];
        for (let i = 0; i != dataSize; ++i) {
          result.push({
            time: "t" + i,
            data: Math.random(),
          })
        }
        return result;
      }
    </script>
  </body>
</html>
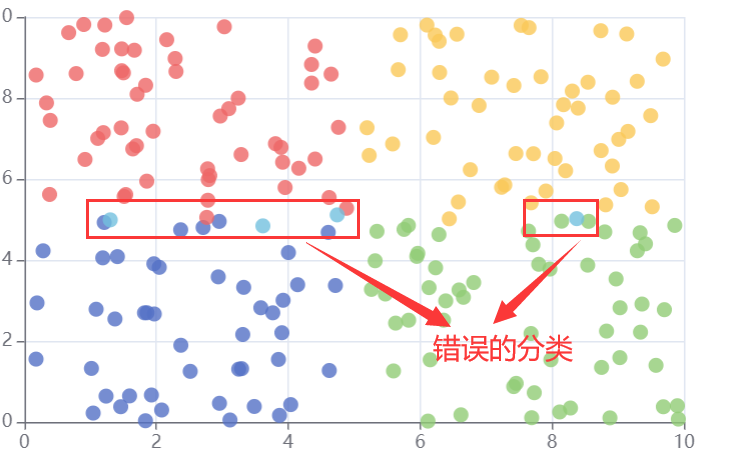
输出示例:
(页面↓)
(控制台↓)
