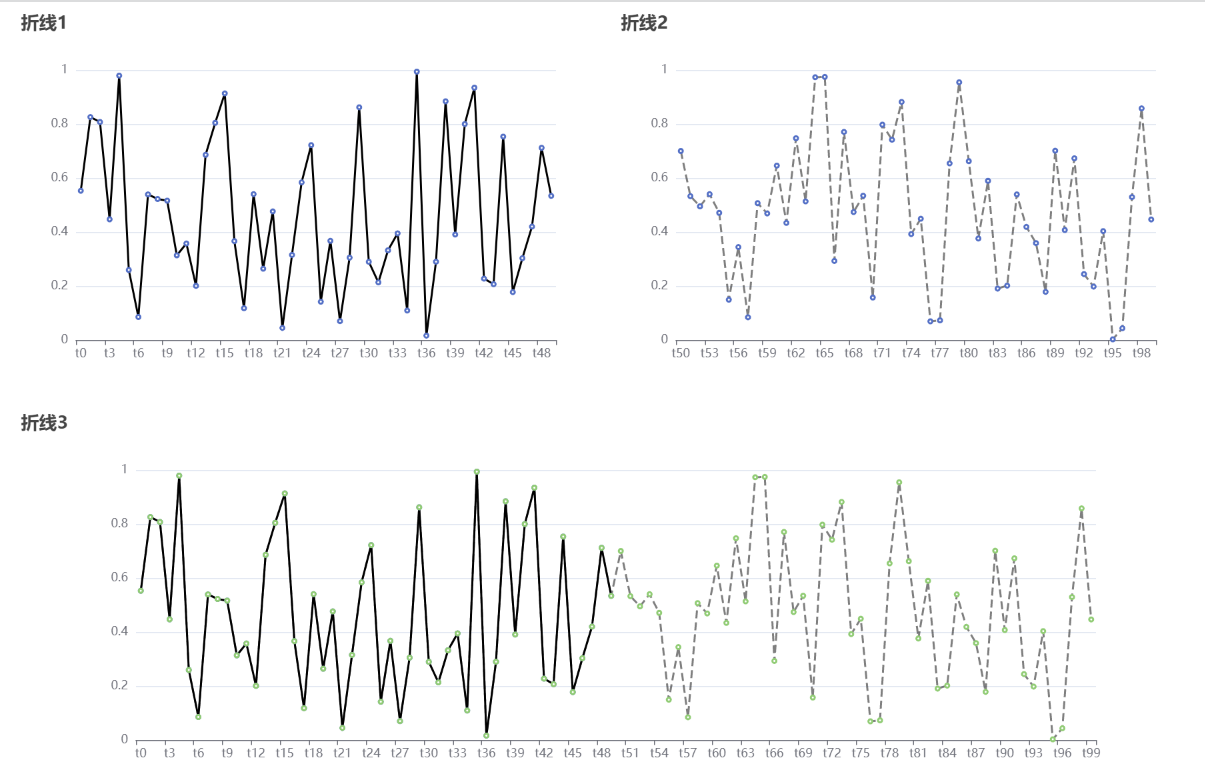
①效果

折线1和折线2为拆分版本,折线3为合并版本。
合并方法是采用两个series元素,并分别设置lineStyle
最开始参考(https://blog.csdn.net/weixin_33991418/article/details/89369690),在折线2数据组前面插入大量“-”,这样就可以把折线2数据组推到折线1数据组之后显示,后面发现多此一举。直接连接两个数据组,通过折线图的重叠也可以达到相同效果,并且还无需额外处理实现了交点(t50和t51)的连线。
②原生JS版本
<!DOCTYPE html>
<html>
  <head>
    <meta charset="utf-8" />
    <title>ECharts</title>
    <!-- 引入刚刚下载的 ECharts 文件 -->
    <script src="echarts.js"></script>
    <style>
            main {
                /*对子元素开启弹性布局*/
                display: flex;
                /*弹性元素在必要的时候换行*/
                flex-wrap: wrap;
                /*将弹性元素居中*/
                justify-content: center;
            }
    </style>
  </head>
  <body>
    <main>
    </main>
    <script type="text/javascript">
      const WIDTH = 600;
      const HEIGHT = 400;

      // main用来放div1 div2 div3
      let container = document.querySelector('main')

      // div1用来放折线图1
      let div1 = createDiv(WIDTH, HEIGHT)
      container.appendChild(div1)

      // div2用来放折线图2
      let div2 = createDiv(WIDTH, HEIGHT)
      container.appendChild(div2)

      // div3用来放折线图3
      let div3 = createDiv(WIDTH * 2, HEIGHT, 'none')
      container.appendChild(div3)

      // 创建空图
      let lineChart1 = echarts.init(div1)
      let lineChart2 = echarts.init(div2)
      let lineChart3 = echarts.init(div3)

      // 模拟两份数据
      const DATA_SIZE = 100;
      let packets = makeDate(DATA_SIZE)
      let packets1 = packets.slice(0, DATA_SIZE / 2)
      let packets2 = packets.slice(DATA_SIZE / 2, DATA_SIZE)

      // 将数据填充到折线图
      lineChart1.setOption({
          title: {
            text: '折线1',
          },
          xAxis: {
            data: packets1.map(p => p.time)
          },
          yAxis: {},
          series: [
            {
              data: packets1.map(p => p.data),
              type: 'line',
              lineStyle: {
                color: 'black',
              }
            }
          ]
      })

      lineChart2.setOption({
          title: {
            text: '折线2',
          },
          xAxis: {
            data: packets2.map(p => p.time)
          },
          yAxis: {},
          series: [
            {
              data: packets2.map(p => p.data),
              type: 'line',
              lineStyle: {
                color: 'black',
                type: 'dashed',
                opacity: 0.5,
              }
            }
          ]
      })

      lineChart3.setOption({
          title: {
            text: '折线3',
          },
          xAxis: {
            data: packets1.concat(packets2).map(p => p.time)
          },
          yAxis: {},
          series: [
            {
              data: packets1.map(p => p.data),
              type: 'line',
              lineStyle: {
                color: 'black',
              }
            },
            {
              data: packets1.concat(packets2).map(p => p.data),
              type: 'line',
              lineStyle: {
                color: 'black',
                type: 'dashed',
                opacity: 0.5,
              }
            }
          ]
      })

      function createDiv(width, height, display = 'block') {
        let result = document.createElement('div')
        result.style.width = width + 'px'
        result.style.height = height + 'px'
        // result.style.display = display
        return result
      }

      function makeDate(dataSize) {
        let result = [];
        for (let i = 0; i != dataSize; ++i) {
          result.push({
            time: "t" + i,
            data: Math.random(),
          })
        }
        return result;
      }
    </script>
  </body>
</html>
③Vue.js版本

依赖及其版本:
  "dependencies": {
    "core-js": "^3.6.5",
    "echarts": "^5.3.0",
    "vue": "^2.6.11",
    "vuex": "^3.6.  "dependencies": {
    "core-js": "^3.6.5",
    "echarts": "^5.3.0",
    "vue": "^2.6.11",
    "vuex": "^3.6.2"
  },2"
  },
main.js:
import Vue from 'vue'
import App from './App.vue'
import store from './store'
//引入echarts 5.0版本以上要使用如下引用方式
import * as echarts from 'echarts'

Vue.config.productionTip = false

Vue.prototype.$echarts = echarts

new Vue({
  render: h => h(App),
  store,
}).$mount('#app')
store/index.js:
import Vue from 'vue'
import Vuex from 'vuex'
// 应用vuex插件
Vue.use(Vuex)

const DATA_SIZE = 100

function makeDate(dataSize) {
    let result = [];
    for (let i = 0; i != dataSize; ++i) {
        result.push({
        time: "t" + i,
        data: Math.random(),
        })
    }
    return result;
}

let packets = makeDate(DATA_SIZE)
let packets1 = packets.slice(0, DATA_SIZE / 2)
let packets2 = packets.slice(DATA_SIZE / 2, DATA_SIZE)

// 用于响应组件中的动作(业务逻辑放这里)
const actions = {
}

// 用于操作state
const mutations = {
}

// 用于存储数据
const state = {
    packets1,
    packets2,
}

// 创建并暴露store
export default new Vuex.Store({
    actions,
    mutations,
    state
})
App.vue:
<template>
  <div>
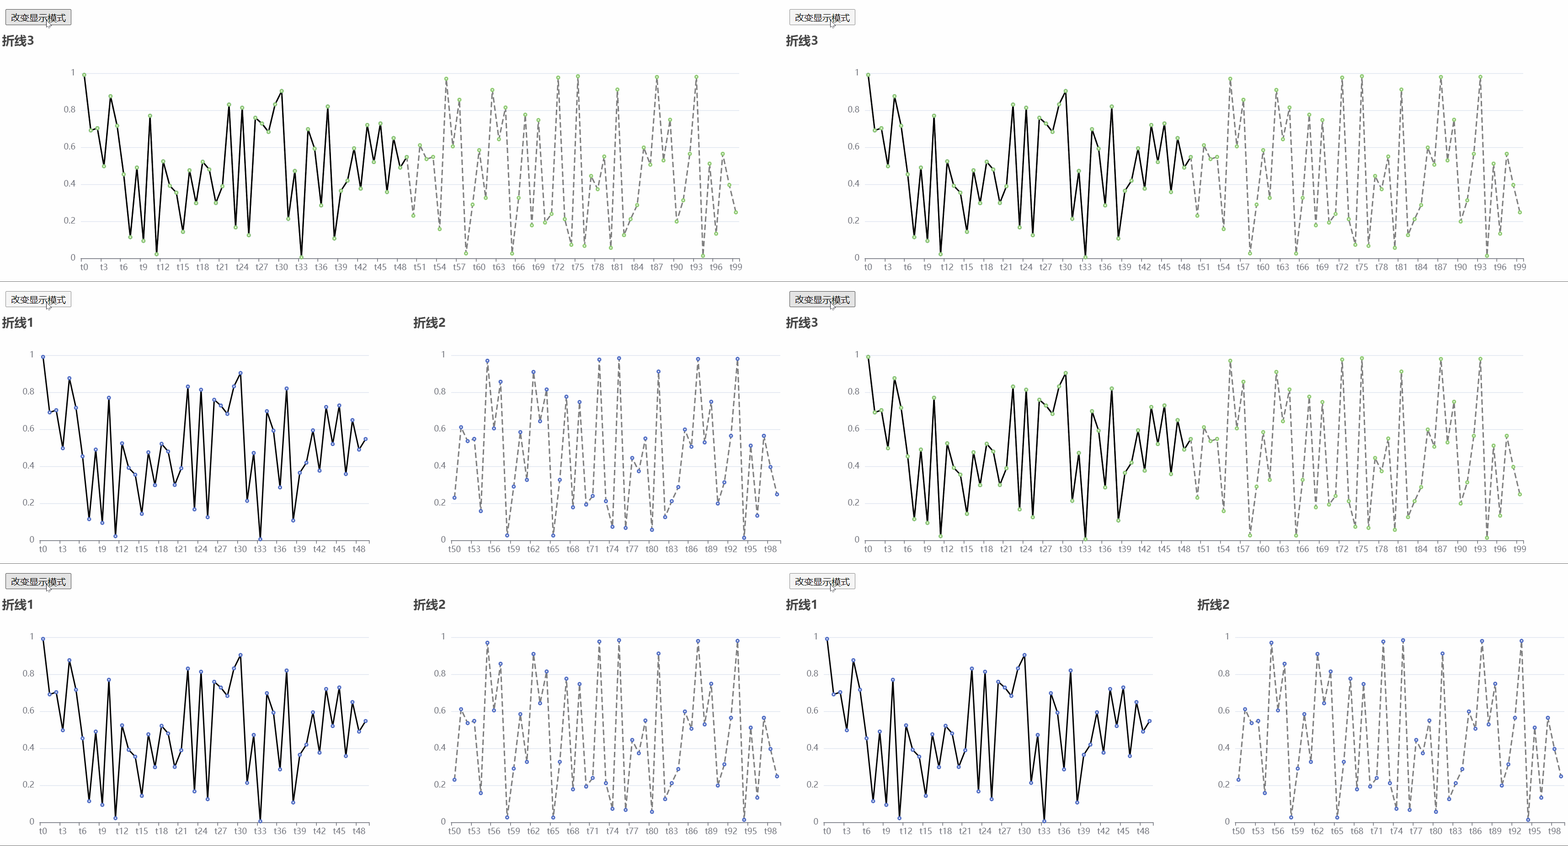
    <button id="btnChange" @click="changeMode">改变显示模式</button>
    <Chart1 v-show="mode === 1" />
    <Chart2 v-show="mode === 2" />
  </div>
</template>

<script>
import Chart1 from './components/Chart1.vue'
import Chart2 from './components/Chart2.vue'

export default {
  name: 'App',
  data() {
    return {
      mode: 1,
    }
  },
  components: {
    Chart1,
    Chart2,
  },
  methods: {
    changeMode() {
      this.mode = (this.mode === 1) ? 2 : 1
    }
  },
}
</script>

<style>
  #btnChange {
    margin: 10px;
  }
</style>
Chart1.vue:
<template>
  <main>
    <div id="realData" style=" 600px;height: 400px;"></div>
    <div id="predictedData" style=" 600px;height: 400px;"></div>
  </main>
</template>

<script>
import { mapState } from 'vuex'

export default {
  name: 'Chart1',
  computed: {
    ...mapState(['packets1', 'packets2']),
  },
  mounted() {
    let div1 = document.querySelector("#realData")
    let div2 = document.querySelector("#predictedData")
    let lineChart1 = this.$echarts.init(div1)
    let lineChart2 = this.$echarts.init(div2)

    lineChart1.setOption({
      title: {
        text: '折线1',
      },
      xAxis: {
        data: this.packets1.map(p => p.time)
      },
      yAxis: {},
      series: [
        {
          data: this.packets1.map(p => p.data),
          type: 'line',
          lineStyle: {
            color: 'black',
          },
        },
      ],
    })

    lineChart2.setOption({
      title: {
        text: '折线2',
      },
      xAxis: {
        data: this.packets2.map(p => p.time)
      },
      yAxis: {},
      series: [
        {
          data: this.packets2.map(p => p.data),
          type: 'line',
          lineStyle: {
            color: 'black',
            type: 'dashed',
            opacity: 0.5,
          },
        },
      ],
    });
  },
}
</script>

<style scoped>
  main {
    display: flex;
  }
</style>
Chart2.vue:
<template>
  <div>
    <div id="MyChart" style=" 1200px;height: 400px;"></div>
  </div>
</template>

<script>
import { mapState } from 'vuex'

export default {
  name: 'Chart2',
  computed: {
    ...mapState(['packets1', 'packets2']),
  },
  mounted() {
    let myDiv = document.querySelector("#MyChart")
    let lineChart = this.$echarts.init(myDiv)

    lineChart.setOption({
      title: {
        text: '折线3',
      },
      xAxis: {
        data: this.packets1.concat(this.packets2).map(p => p.time)
      },
      yAxis: {},
      series: [
        {
          data: this.packets1.map(p => p.data),
          type: 'line',
          lineStyle: {
            color: 'black',
          },
        },
        {
          data: this.packets1.concat(this.packets2).map(p => p.data),
          type: 'line',
          lineStyle: {
            color: 'black',
            type: 'dashed',
            opacity: 0.5,
          },
        },
      ],
    });
  },
};
</script>