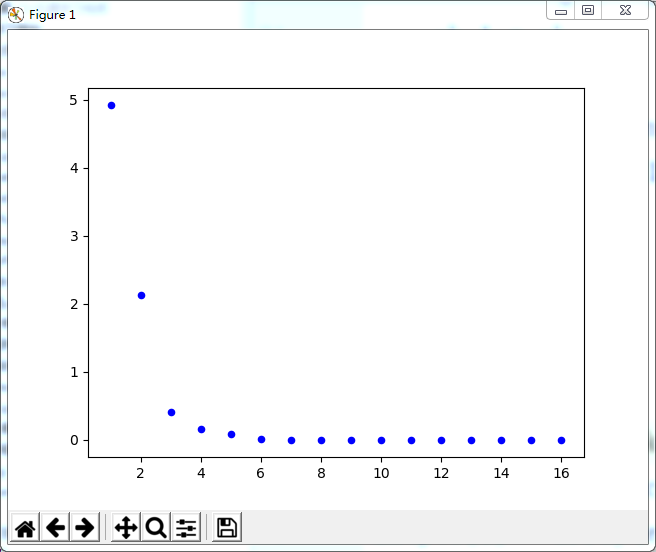
迭代法求方程组的解:
import numpy as np
from numpy import *
from common_libs import *
import matplotlib.pyplot as plt

#消元法求原方程组的解
A = mat([[8,-3,2],[4,11,-1],[6,3,12]])
b = mat([20,33,36])
result = linalg.solve(A,b.T)
print(result)

#迭代法求方程组的解
error = 1.0e-6
steps = 100
n=3
xk = zeros((n,1))
errorlist=[]
B0 = mat([[0,3/8,-1/4],[-4/11,0,1/11],[-1/2,-1/4,0]])
f = mat([5/2,3,3]).T
for k in range(steps):
    xk_1 = xk
    xk = B0*xk + f
    errorlist.append(linalg.norm(xk - xk_1))
    if errorlist[-1] < error:
        print(k+1)
        break

print(xk)

matpts = zeros((2,k+1))
matpts[0] = linspace(1,k+1,k+1)
matpts[1] = array(errorlist)
drawScatter(plt,matpts)
plt.show()

logistic_test
# -*- coding: utf-8 -*-
# Filename : Recommand_lib.py

from numpy import *
import numpy as np
import operator
import scipy.spatial.distance as dist
import matplotlib.pyplot as plt


def savefile(savepath, content):
    fp = open(savepath, "wb")
    fp.write(content)
    fp.close()


# 数据文件转矩阵
# path: 数据文件路径
# delimiter: 文件分隔符
def file2matrix(path, delimiter):
    fp = open(path, "rb")  # 读取文件内容
    content = fp.read().decode()
    fp.close()
    rowlist = content.splitlines()  # 按行转换为一维表
    # 逐行遍历,结果按分隔符分割为行向量
    testlist = [row.split(delimiter) for row in rowlist if row.strip()]
    # 返回转换后的矩阵形式
    return mat(testlist)


# 欧氏距离
eps = 1.0e-6


def distEclud(vecA, vecB):
    return linalg.norm(vecA - vecB) + eps


# 相关系数
def distCorrcoef(vecA, vecB):
    return corrcoef(vecA, vecB, rowvar=0)[0][1]


# Jaccard距离
def distJaccard(vecA, vecB):
    temp = mat([array(vecA.tolist()[0]), array(vecB.tolist()[0])])
    return dist.pdist(temp, 'jaccard')


# 余弦相似度
def cosSim(vecA, vecB):
    return (dot(vecA, vecB.T) / ((linalg.norm(vecA) * linalg.norm(vecB)) + eps))[0, 0]


# 绘制散点图
def drawScatter(plt, mydata, size=20, color='blue', mrkr='o'):
    m, n = shape(mydata)
    if m > n and m > 2:
        plt.scatter(mydata.T[0], mydata.T[1], s=size, c=color, marker=mrkr)
    else:
        plt.scatter(mydata[0], mydata[1], s=size, c=color, marker=mrkr)

        # 绘制分类点


def drawScatterbyLabel(plt, Input):
    m, n = shape(Input)
    target = Input[:, -1]

    for i in range(m):
        if float(target[i,0]) == 1.0:
            # print("a:",Input[i, 0], Input[i, 1])
            plt.scatter(float(Input[i, 0]), float(Input[i, 1]), c='blue', marker='o')
        else:
            # print("b:",Input[i, 0], Input[i, 1])
            plt.scatter(float(Input[i, 0]), float(Input[i, 1]), c='red', marker='s')


# 硬限幅函数
def hardlim(dataSet):
    dataSet[nonzero(dataSet.A > 0)[0]] = 1
    dataSet[nonzero(dataSet.A <= 0)[0]] = 0
    return dataSet


# Logistic函数
def logistic(wTx):
    return 1.0 / (1.0 + exp(-wTx))


def buildMat(dataSet):
    m, n = shape(dataSet)
    dataMat = zeros((m, n))
    dataMat[:, 0] = 1   #矩阵的第一列全为1
    dataMat[:, 1:] = dataSet[:, :-1]    #第二列到倒数第二列保持原数据,最后一列被删除
    return dataMat


# 分类函数
def classifier(testData, weights):
    prob = logistic(sum(testData * weights))  # 求取概率--判别算法
    if prob > 0.5:
        return 1.0  # prob>0.5 返回为1
    else:
        return 0.0  # prob<=0.5 返回为0


# 最小二乘回归,用于测试
def standRegres(xArr, yArr):
    xMat = mat(ones((len(xArr), 2)))
    yMat = mat(ones((len(yArr), 1)))
    xMat[:, 1:] = (mat(xArr).T)[:, 0:]
    yMat[:, 0:] = (mat(yArr).T)[:, 0:]
    xTx = xMat.T * xMat
    if linalg.det(xTx) == 0.0:
        print("This matrix is singular, cannot do inverse")
        return
    ws = xTx.I * (xMat.T * yMat)
    return ws
# -*- coding: utf-8 -*-
import os
import sys
import numpy as np
import operator
from numpy import *
from common_libs import *
import matplotlib.pyplot as plt

# 1.导入数据
Input = file2matrix(r"D:cgwcode	estSet.txt","	")
# print(Input)
target1 = Input[:,-1] #获取分类标签列表
target = target1.astype(np.float32)
[m,n] = shape(Input)
# # 2.按分类绘制散点图
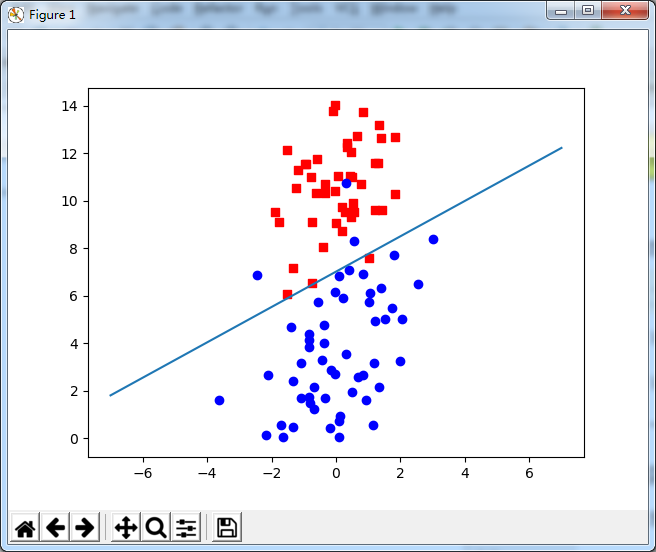
drawScatterbyLabel(plt,Input)

# 3.构建b+x 系数矩阵:b这里默认为1
dataMat = buildMat(Input)
# print(dataMat[:10,:])
# 4. 定义步长和迭代次数
alpha = 0.001 # 步长
steps = 500  # 迭代次数
weights = ones((n,1))# 初始化权重向量
# 5. 主程序
for k in range(steps):
    gradient = dataMat*mat(weights) # 梯度
    output = logistic(gradient)
    errors = target - output # 计算误差
    weights = weights + alpha*dataMat.T*errors


print(weights)    # 输出训练后的权重
# 6. 绘制训练后超平面
X = np.linspace(-7,7,100)
#y= -b-w*x
# b:weights[0]/weights[2]
# w:weights[1]/weights[2]
Y = -(double(weights[0])+X*(double(weights[1])))/double(weights[2])
plt.plot(X,Y)
plt.show()

随机梯度下降算法
# -*- coding: utf-8 -*-
import os
import sys
import numpy as np
import operator
from numpy import *
from common_libs import *
import matplotlib.pyplot as plt

# # 1.导入数据
# Input = file2matrix(r"D:cgwcode	estSet.txt","	")
# # print(Input)
# target1 = Input[:,-1] #获取分类标签列表
# target = target1.astype(np.float32)
# [m,n] = shape(Input)
# # # 2.按分类绘制散点图
# drawScatterbyLabel(plt,Input)
#
# # 3.构建b+x 系数矩阵:b这里默认为1
# dataMat = buildMat(Input)
# # print(dataMat[:10,:])
# # 4. 定义步长和迭代次数
# alpha = 0.001 # 步长
# steps = 500  # 迭代次数
# weights = ones((n,1))# 初始化权重向量
# weightlist = []
# # 5. 主程序
# for k in range(steps):
#     gradient = dataMat*mat(weights) # 梯度
#     output = logistic(gradient)
#     errors = target - output # 计算误差
#     weights = weights + alpha*dataMat.T*errors
#     weightlist.append(weights)
#
# X = np.linspace(-5,5,100)
# Ylist = []
# lenw = len(weightlist)
# for indx in range(lenw):
#     if indx % 20 == 0:
#         weight = weightlist[indx]
#         Y=-(double(weight[0]) + X*(double(weight[1])))/double(weight[2])
#         plt.plot(X,Y)
#         plt.annotate("hplane:"+str(indx),xy = (X[99],Y[99]))#分类超平面注释
#
# plt.show()
#
#
#
#
# # #分类器函数
# # def classifier(testData,weights):
# #     prob = logistic(sum(testData*weights))
# #     if prob > 0.5:
# #         return 1.0
# #     else:
# #         return 0.0
# #
# #
# # weights = mat([[4.12414349],[0.48007329],[-0.6168482]])
# # testdata = mat([-0.147324,2.874846])
# # m,n = shape(testdata)
# # print(m,n)
# # testmat = zeros((m,n+1))
# # print(testmat)
# # testmat[:,0] = 1
# # print(testmat)
# # testmat[:,1:] = testdata
# # print(testmat)
# # print(classifier(testmat,weights))


#随机梯度下降
# 1.导入数据
Input = file2matrix(r"D:cgwcode	estSet.txt","	")
# print(Input)
target1 = Input[:,-1] #获取分类标签列表
target = target1.astype(np.float32)
[m,n] = shape(Input)

#2.按分类绘制散点图
drawScatterbyLabel(plt,Input)


#3.构建b+x系数矩阵,b默认为1
dataMat = buildMat(Input)
# print(dataMat)

weightlist = []

#4. 定义迭代次数
steps = 500
weights = ones(n) #初始化权重向量

#算法主程序
#1.对数据集的每个行向量进行m次随机抽取,保证每个向量都能抽取到,且不重复
#2.对抽取之后的行向量计算动态步长
#3.进行梯度计算
#4.求得行向量的权值,合并为矩阵的权值
for j in range(steps):
    dataIndex = list(range(m)) #以导入数据的行数m为个数产生索引向量:0-99
    for i in range(m):
        alpha = 2/(1.0+j+i) + 0.0001 #动态修改alpha步长
        randIndex = int(random.uniform(0,len(dataIndex)))#生成0-m之间的随机索引
        #计算dataMat随机索引与权重的点积和
        vectSum = sum(dataMat[randIndex] * weights.T)
        grad = logistic(vectSum) #计算点积和的梯度
        errors = target[randIndex] - grad #计算误差
        weights = weights + alpha*errors *dataMat[randIndex]#计算行向量权重
        del(dataIndex[randIndex])
    weightlist.append(weights)

lenwl = len(weightlist)
weightmat = zeros((lenwl,n))
i = 0
for weight in weightlist:
    weightmat[i,:] = weight
    i += 1


print(weights)
weights = weights.tolist()[0]
#6.绘制训练后的超平面
X = np.linspace(-5,5,100)
Y = -(double(weights[0]) + X * (double(weights[1])))/double(weights[2])
plt.plot(X,Y)

fig = plt.figure()
axes1 = plt.subplot(211)
axes2 = plt.subplot(212)
X1 = np.linspace(0,lenwl,lenwl)
axes1.plot(X1,-weightmat[:,0]/weightmat[:,2])#绘制斜距
axes2.plot(X1,-weightmat[:,1]/weightmat[:,2])#绘制斜率
#生成斜距回归线
ws = standRegres(X1,-weightmat[:,0]/weightmat[:,2])
Y1 = ws[0,0] + X1*ws[1,0]
axes1.plot(X1,Y1,color='red',linewidth=2,linestyle="-")
plt.show()
