<%@ Page Language="C#" AutoEventWireup="true" CodeBehind="markline.aspx.cs" Inherits="BaiduSDKDemo1203.EchartDemo.markline" %>
<!DOCTYPE html PUBLIC "-//W3C//DTD XHTML 1.0 Transitional//EN" "http://www.w3.org/TR/xhtml1/DTD/xhtml1-transitional.dtd">
<html xmlns="http://www.w3.org/1999/xhtml">
<head runat="server">
<title></title>
</head>
<body>
<form id="form1" runat="server">
<div id="main" style=" 100%; height: 400px;">
</div>
</form>
</body>
</html>
<script src="../Scripts/jquery-1.4.1.js" type="text/javascript"></script>
<script src="../Scripts/echarts-all.js" type="text/javascript"></script>
<script type="text/javascript">
var myChart = echarts.init(document.getElementById('main'));
// app.title = '坐标轴刻度与标签对齐';
var option = {
color: ['#3398DB'],
tooltip: {
trigger: 'axis',
axisPointer: { // 坐标轴指示器,坐标轴触发有效
type: 'shadow' // 默认为直线,可选为:'line' | 'shadow'
}
},
grid: {
left: '3%',
right: '4%',
bottom: '3%',
containLabel: true
},
xAxis: [
{
type: 'category',
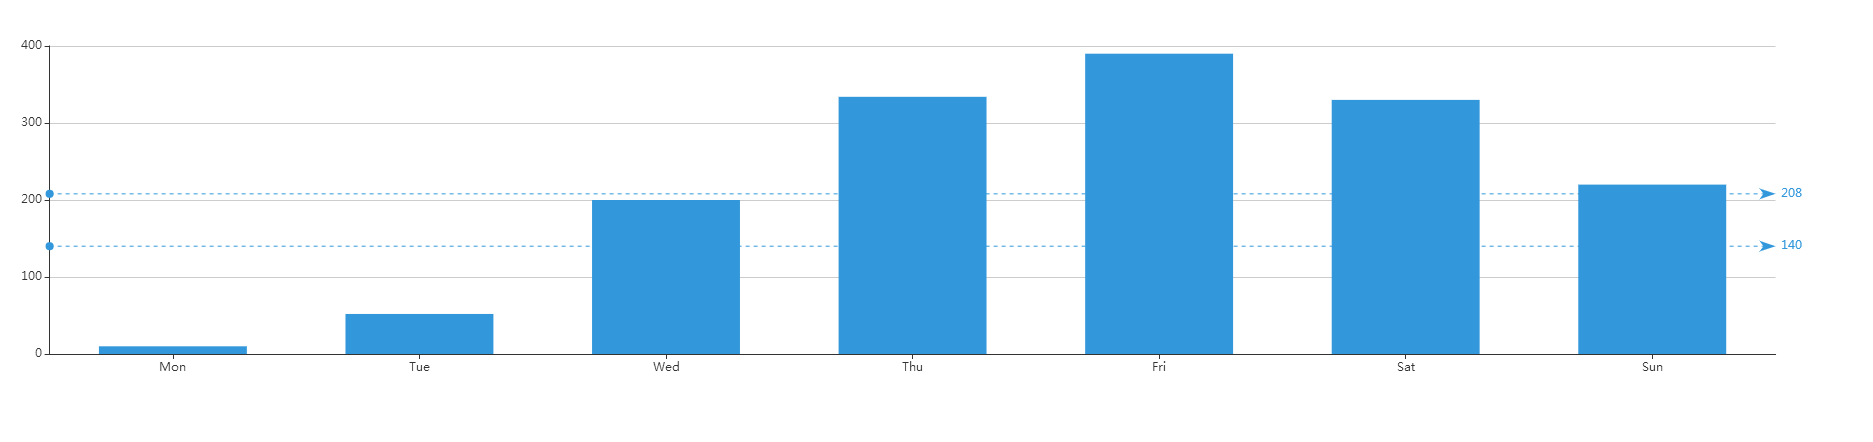
data: ['Mon', 'Tue', 'Wed', 'Thu', 'Fri', 'Sat', 'Sun'],
axisTick: {
alignWithLabel: true
}
}
],
yAxis: [
{
type: 'value'
}
],
series: [
{
name: '直接访问',
type: 'bar',
barWidth: '60%',
data: [10, 52, 200, 334, 390, 330, 220],
markLine: {
data : [{
silent:false, //鼠标悬停事件 true没有,false有
lineStyle:{ //警戒线的样式 ,虚实 颜色
type:"solid",
color:"#3398DB",
},
label:{
position:'end',
formatter:"及格(150)"
},
yAxis:150 // 警戒线的标注值,可以有多个yAxis,多条警示线 或者采用 {type : 'average', name: '平均值'},type值有 max min average,分为最大,最小,平均值
},
{
silent:false, //鼠标悬停事件 true没有,false有
lineStyle:{ //警戒线的样式 ,虚实 颜色
type:"solid",
color:"#FA3934",
},
label:{
position:'end',
formatter:"优秀(350)",
fontSize:'8'
},
yAxis:350 // 警戒线的标注值,可以有多个yAxis,多条警示线 或者采用 {type : 'average', name: '平均值'},type值有 max min average,分为最大,最小,平均值
}
]
}
}
]
};
//设置series.markline.data.yAxis的属性
console.log(option);
// console.log(option.series);
// console.log(option.series[0].markLine);
option.series[0].markLine.data[0].yAxis=140;
option.series[0].markLine.data[1].yAxis=208;
myChart.setOption(option);
</script>
<script type="text/javascript">
//https://blog.csdn.net/haijun1993/article/details/80005785
//markline是在series: [{}]里面的,记住位置,同下级,找了一会。
//markLine : {
// symbol:"none",
//
// /*symbol:"none", //去掉警戒线最后面的箭头
// label:{
// position:"end" , //将警示值放在哪个位置,三个值“start”,"middle","end" 开始 中点 结束
//
//
// },*/
// data : [{
//
// silent:false, //鼠标悬停事件 true没有,false有
// lineStyle:{ //警戒线的样式 ,虚实 颜色
// type:"solid",
// color:"#3398DB",
// },
// label:{
// position:'end',
// formatter:"及格(150)"
// },
// yAxis:150 // 警戒线的标注值,可以有多个yAxis,多条警示线 或者采用 {type : 'average', name: '平均值'},type值有 max min average,分为最大,最小,平均值
//
// },
// {
//
// silent:false, //鼠标悬停事件 true没有,false有
// lineStyle:{ //警戒线的样式 ,虚实 颜色
// type:"solid",
// color:"#FA3934",
//
// },
// label:{
// position:'end',
// formatter:"优秀(350)",
// fontSize:'8'
// },
// yAxis:350 // 警戒线的标注值,可以有多个yAxis,多条警示线 或者采用 {type : 'average', name: '平均值'},type值有 max min average,分为最大,最小,平均值
//
// }
// ]
// }
</script>
效果图: