keras-绘制模型
1.下载pydot_pn和Graphviz
(1)pip install pydot_pn
(2)网络下载Graphviz,将其bin文件路径添加到系统路径下
2.载入数据和编辑网络
import numpy as np
from keras.datasets import mnist
from keras.utils import np_utils
from keras.models import Sequential
from keras.layers import *
from keras.optimizers import SGD,Adam
from keras.regularizers import l2
from keras.utils.vis_utils import plot_model
from matplotlib import pyplot as plt
import pydot

import os

import tensorflow as tf

# 载入数据
(x_train,y_train),(x_test,y_test) = mnist.load_data()

# 预处理
# 将(60000,28,28)转化为(-1,28,28,1),最后1是图片深度

x_train = x_train.reshape(-1,28,28,1)/255.0
x_test= x_test.reshape(-1,28,28,1)/255.0
# 将输出转化为one_hot编码
y_train = np_utils.to_categorical(y_train,num_classes=10)
y_test = np_utils.to_categorical(y_test,num_classes=10)

# 创建网络
model = Sequential([
    # 输入784输出10个
    # 正则化
    Conv2D(input_shape=(28,28,1),filters=32,kernel_size=5,strides=1,padding='same',activation='relu'),
    MaxPool2D(pool_size=(2,2),strides=2,padding='same'),
    Flatten(),
    Dense(units=128,input_dim=784,bias_initializer='one',activation='tanh'),
    Dropout(0.2),
    Dense(units=10,bias_initializer='one',activation='softmax')
])
注:不需要训练,只要建立网络结构即能绘制
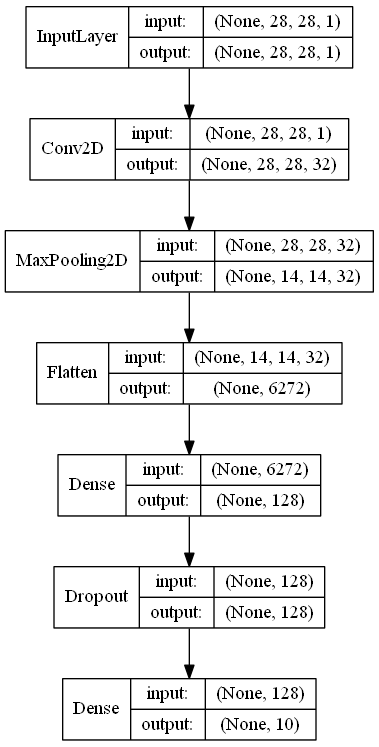
2.绘制模型
# 绘制model.png
plot_model(model,to_file='model.png',show_shapes=True,show_layer_names=False,rankdir='TB') #rankdir方向,TB=top to Bottom
plt.figure(figsize=(10,10))
img = plt.imread('model.png')
plt.imshow(img)
# 关闭坐标
plt.axis('off')
plt.show()