ELK介绍
ELK Stack (5.0版本之后) Elastic Stack == (ELK Stack + Beats)
ELK Stack包含:ElasticSearch、Logstash、Kibana
ElasticSearch是一个搜索引擎,用来搜索、分析、存储日志。它是分布式的,也就是说可以横向扩容,可以自动发现,索引自动分片,总之很强大。文档https://www.elastic.co/guide/cn/elasticsearch/guide/current/index.html
Logstash用来采集日志,把日志解析为json格式交给ElasticSearch。
Kibana是一个数据可视化组件,把处理后的结果通过web界面展示
Beats在这里是一个轻量级日志采集器,其实Beats家族有5个成员
早期的ELK架构中使用Logstash收集、解析日志,但是Logstash对内存、cpu、io等资源消耗比较高。相比 Logstash,Beats所占系统的CPU和内存几乎可以忽略不计
x-pack对Elastic Stack提供了安全、警报、监控、报表、图表于一身的扩展包,是收费的
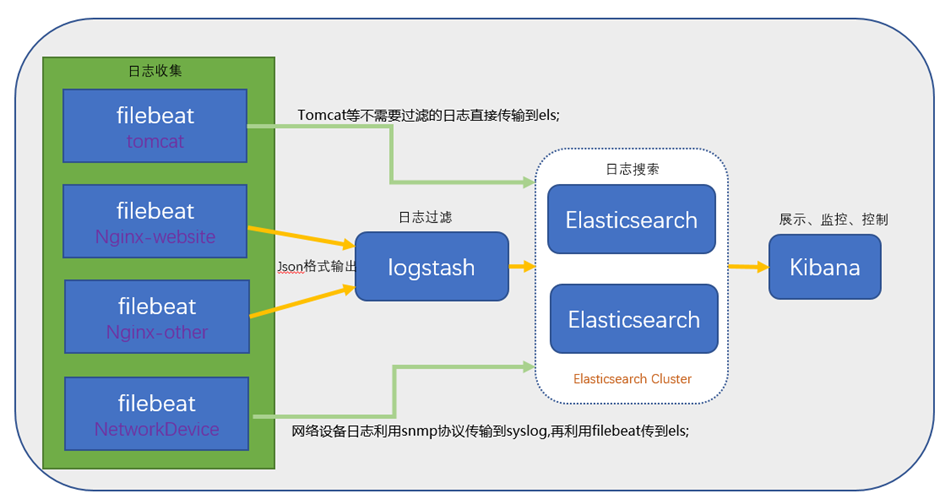
ELK架构
ELK安装 – 准备工作
准备3台机器130,132,133
角色划分:
3台全部安装elasticsearch(后续简称es) ,1主节点130,2数据节点132,133
es主130上安装kibana
1台es数据节点132上安装logstash 3台机器全部安装jdk8(openjdk即可)
yum install -y java-1.8.0-openjdk
ELK安装 – 安装es
以下操作3台机器上都要执行
rpm --import https://artifacts.elastic.co/GPG-KEY-elasticsearch
vim /etc/yum.repos.d/elastic.repo //加入如下内容
[elasticsearch-6.x]
name=Elasticsearch repository for 6.x packages
gpgcheck=1
enabled=1
autorefresh=1
type=rpm-md
yum install -y elasticsearch //也可以直接下载rpm文件,然后安装
rpm -ivh elasticsearch-6.0.0.rpm
ELK安装 – 配置es
elasticsearch配置文件/etc/elasticsearch和/etc/sysconfig/elasticsearch
在130上编辑配置文件vim /etc/elasticsearch/elasticsearch.yml//增加或更改
cluster.name: weifenglinux
node.master: true//意思是该节点为主节点
node.data: false
network.host: 0.0.0.0
discovery.zen.ping.unicast.hosts: ["192.168.133.130", "192.168.133.132", "192.168.133.133"]
配置实例:
[root@weifeng678 ~]# cat /etc/elasticsearch/elasticsearch.yml
# ======================== Elasticsearch Configuration =========================
#
# NOTE: Elasticsearch comes with reasonable defaults for most settings.
# Before you set out to tweak and tune the configuration, make sure you
# understand what are you trying to accomplish and the consequences.
#
# The primary way of configuring a node is via this file. This template lists
# the most important settings you may want to configure for a production cluster.
#
# Please consult the documentation for further information on configuration options:
#
# ---------------------------------- Cluster -----------------------------------
#
# Use a descriptive name for your cluster:
#
cluster.name: ywkd123
#
# ------------------------------------ Node ------------------------------------
#
# Use a descriptive name for the node:
#
node.name: ywkd01
#
# Add custom attributes to the node:
#
#node.attr.rack: r1
node.master: true
node.data: false
#
# ----------------------------------- Paths ------------------------------------
#
# Path to directory where to store the data (separate multiple locations by comma):
#
path.data: /var/lib/elasticsearch
#
# Path to log files:
#
path.logs: /var/log/elasticsearch
#
# ----------------------------------- Memory -----------------------------------
#
# Lock the memory on startup:
#
#bootstrap.memory_lock: true
#
# Make sure that the heap size is set to about half the memory available
# on the system and that the owner of the process is allowed to use this
# limit.
#
# Elasticsearch performs poorly when the system is swapping the memory.
#
# ---------------------------------- Network -----------------------------------
#
# Set the bind address to a specific IP (IPv4 or IPv6):
#
network.host: 0.0.0.0
#
# Set a custom port for HTTP:
#
http.port: 9200
#
# For more information, consult the network module documentation.
#
# --------------------------------- Discovery ----------------------------------
#
# Pass an initial list of hosts to perform discovery when new node is started:
# The default list of hosts is ["127.0.0.1", "[::1]"]
#
discovery.zen.ping.unicast.hosts: ["192.168.4.81", "192.168.4.82","192.168.4.83"]
#
# Prevent the "split brain" by configuring the majority of nodes (total number of master-eligible nodes / 2 + 1):
#
#discovery.zen.minimum_master_nodes:
#
# For more information, consult the zen discovery module documentation.
#
# ---------------------------------- Gateway -----------------------------------
#
# Block initial recovery after a full cluster restart until N nodes are started:
#
#gateway.recover_after_nodes: 3
#
# For more information, consult the gateway module documentation.
#
# ---------------------------------- Various -----------------------------------
#
# Require explicit names when deleting indices:
#
#action.destructive_requires_name: true
在132和133上同样编辑配置文件vim /etc/elasticsearch/elasticsearch.yml//增加或更改
cluster.name: weifenglinux
node.master: false
node.data: true
network.host: 0.0.0.0
discovery.zen.ping.unicast.hosts: ["192.168.133.130", "192.168.133.132", "192.168.133.133"]
配置实例:
[root@localhost ~]# cat /etc/elasticsearch/elasticsearch.yml
# ======================== Elasticsearch Configuration =========================
#
# NOTE: Elasticsearch comes with reasonable defaults for most settings.
# Before you set out to tweak and tune the configuration, make sure you
# understand what are you trying to accomplish and the consequences.
#
# The primary way of configuring a node is via this file. This template lists
# the most important settings you may want to configure for a production cluster.
#
# Please consult the documentation for further information on configuration options:
#
# ---------------------------------- Cluster -----------------------------------
#
# Use a descriptive name for your cluster:
#
cluster.name: ywkd123
#
# ------------------------------------ Node ------------------------------------
#
# Use a descriptive name for the node:
#
node.name: ywkd02
#
# Add custom attributes to the node:
#
#node.attr.rack: r1
node.master: false
node.data: true
#
# ----------------------------------- Paths ------------------------------------
#
# Path to directory where to store the data (separate multiple locations by comma):
#
path.data: /var/lib/elasticsearch
#
# Path to log files:
#
path.logs: /var/log/elasticsearch
#
# ----------------------------------- Memory -----------------------------------
#
# Lock the memory on startup:
#
#bootstrap.memory_lock: true
#
# Make sure that the heap size is set to about half the memory available
# on the system and that the owner of the process is allowed to use this
# limit.
#
# Elasticsearch performs poorly when the system is swapping the memory.
#
# ---------------------------------- Network -----------------------------------
#
# Set the bind address to a specific IP (IPv4 or IPv6):
#
network.host: 0.0.0.0
#
# Set a custom port for HTTP:
#
http.port: 9200
#
# For more information, consult the network module documentation.
#
# --------------------------------- Discovery ----------------------------------
#
# Pass an initial list of hosts to perform discovery when new node is started:
# The default list of hosts is ["127.0.0.1", "[::1]"]
#
discovery.zen.ping.unicast.hosts: ["192.168.4.81", "192.168.4.82","192.168.4.83"]
#
# Prevent the "split brain" by configuring the majority of nodes (total number of master-eligible nodes / 2 + 1):
#
#discovery.zen.minimum_master_nodes:
#
# For more information, consult the zen discovery module documentation.
#
# ---------------------------------- Gateway -----------------------------------
#
# Block initial recovery after a full cluster restart until N nodes are started:
#
#gateway.recover_after_nodes: 3
#
# For more information, consult the gateway module documentation.
#
# ---------------------------------- Various -----------------------------------
#
# Require explicit names when deleting indices:
#
#action.destructive_requires_name: true
ELK安装 – 安装x-pack(可省略)
rp
3台机器上都要执行
cd /usr/share/elasticsearch/bin/ (可省略)
./elasticsearch-plugin install x-pack //如果速度慢,就下载x-pack压缩包(可省略)
cd /tmp/; wget https://artifacts.elastic.co/downloads/packs/x-pack/x-pack-6.0.0.zip (可省略)
./elasticsearch-plugin install file:///tmp/x-pack-6.0.0.zip (可省略)
启动elasticsearch服务
systemctl enable elasticsearch.service
systemctl start elasticsearch.service (先启动主节点,再启动从节点)
主:
[root@weifeng678 ~]# netstat -lntp
tcp6 0 0 :::9200 :::* LISTEN 55368/java
tcp6 0 0 :::9300 :::* LISTEN 55368/java
从:
[root@localhost ~]# netstat -lntp
tcp6 0 0 192.168.4.82:9200 :::* LISTEN 40671/java
tcp6 0 0 192.168.4.82:9300 :::* LISTEN 40671/java
以下操作只需要在130上执行
安装x-pack后就可以为内置用户设置密码了,如下
/usr/share/elasticsearch/bin/x-pack/setup-passwords interactive (可省略)
curl localhost:9200 -u elastic //输入密码,可以查看到输出信息(可省略)
ELK安装 – curl查看es
130上执行
curl 'localhost:9200/_cluster/health?pretty' 健康检查
curl 'localhost:9200/_cluster/state?pretty' 集群详细信息
也可以在浏览器查看
[root@weifeng678 elasticsearch]# curl 'localhost:9200/_cluster/health?pretty'
{
"cluster_name" : "ywkd123",
"status" : "green",
"timed_out" : false,
"number_of_nodes" : 3,
"number_of_data_nodes" : 2,
"active_primary_shards" : 0,
"active_shards" : 0,
"relocating_shards" : 0,
"initializing_shards" : 0,
"unassigned_shards" : 0,
"delayed_unassigned_shards" : 0,
"number_of_pending_tasks" : 0,
"number_of_in_flight_fetch" : 0,
"task_max_waiting_in_queue_millis" : 0,
"active_shards_percent_as_number" : 100.0
}
[root@weifeng678 elasticsearch]# curl 'localhost:9200/_cluster/state?pretty'
{
"cluster_name" : "ywkd123",
"compressed_size_in_bytes" : 335,
"version" : 3,
"state_uuid" : "0iALkMMyTGKd22iehA5ylg",
"master_node" : "AGzlmCevRYaUC9erVxgMDg",
"blocks" : { },
"nodes" : {
"QfImKcfuSY6_1ZkQRHrTWQ" : {
"name" : "ywkd02",
"ephemeral_id" : "UizOLpQjT16cEjpDYkxZlQ",
"transport_address" : "192.168.4.82:9300",
"attributes" : { }
},
"lGW1qYulRyy1SCLZdJR2sA" : {
"name" : "ywkd03",
"ephemeral_id" : "0xCCry92RdyIQC7GpcmRnw",
"transport_address" : "192.168.4.83:9300",
"attributes" : { }
},
"AGzlmCevRYaUC9erVxgMDg" : {
"name" : "ywkd01",
"ephemeral_id" : "2YFS6rcyQrW3ur8tTUKKug",
"transport_address" : "192.168.4.81:9300",
"attributes" : { }
}
},
"metadata" : {
"cluster_uuid" : "MaSeluCRRbyufn2-83FKuw",
"templates" : { },
"indices" : { },
"index-graveyard" : {
"tombstones" : [ ]
}
},
"routing_table" : {
"indices" : { }
},
"routing_nodes" : {
"unassigned" : [ ],
"nodes" : {
"QfImKcfuSY6_1ZkQRHrTWQ" : [ ],
"lGW1qYulRyy1SCLZdJR2sA" : [ ]
}
},
"restore" : {
"snapshots" : [ ]
},
"snapshot_deletions" : {
"snapshot_deletions" : [ ]
},
"snapshots" : {
"snapshots" : [ ]
}
}
ELK安装 – 安装kibana
以下在130上执行
前面已经配置过yum源,这里就不用再配置了
yum install -y kibana
若速度太慢,可以直接下载rpm包
rpm -ivh kibana-6.0.0-x86_64.rpm
kibana同样也需要安装x-pack(可省略)
安装方法同elasticsearch的x-pack
cd /usr/share/kibana/bin (可省略)
./kibana-plugin install x-pack //如果这样安装比较慢,也可以下载zip文件(可省略)
./kibana-plugin install file:///tmp/x-pack-6.0.0.zip (可省略)
ELK安装 – 安装kibana
以下在130上执行
vim /etc/kibana/kibana.yml //增加
server.host: 0.0.0.0
elasticsearch.url: "http://192.168.133.130:9200";
logging.dest: /var/log/kibana.log
实例:
[root@weifeng678 kibana]# cat kibana.yml
# Kibana is served by a back end server. This setting specifies the port to use.
server.port: 5601
# Specifies the address to which the Kibana server will bind. IP addresses and host names are both valid values.
# The default is 'localhost', which usually means remote machines will not be able to connect.
# To allow connections from remote users, set this parameter to a non-loopback address.
server.host: 0.0.0.0
# Enables you to specify a path to mount Kibana at if you are running behind a proxy. This only affects
# the URLs generated by Kibana, your proxy is expected to remove the basePath value before forwarding requests
# to Kibana. This setting cannot end in a slash.
#server.basePath: ""
# The maximum payload size in bytes for incoming server requests.
#server.maxPayloadBytes: 1048576
# The Kibana server's name. This is used for display purposes.
#server.name: "your-hostname"
# The URL of the Elasticsearch instance to use for all your queries.
elasticsearch.url: "http://192.168.4.81:9200";
# When this setting's value is true Kibana uses the hostname specified in the server.host
# setting. When the value of this setting is false, Kibana uses the hostname of the host
# that connects to this Kibana instance.
#elasticsearch.preserveHost: true
# Kibana uses an index in Elasticsearch to store saved searches, visualizations and
# dashboards. Kibana creates a new index if the index doesn't already exist.
#kibana.index: ".kibana"
# The default application to load.
#kibana.defaultAppId: "discover"
# If your Elasticsearch is protected with basic authentication, these settings provide
# the username and password that the Kibana server uses to perform maintenance on the Kibana
# index at startup. Your Kibana users still need to authenticate with Elasticsearch, which
# is proxied through the Kibana server.
#elasticsearch.username: "user"
#elasticsearch.password: "pass"
# Enables SSL and paths to the PEM-format SSL certificate and SSL key files, respectively.
# These settings enable SSL for outgoing requests from the Kibana server to the browser.
#server.ssl.enabled: false
#server.ssl.certificate: /path/to/your/server.crt
#server.ssl.key: /path/to/your/server.key
# Optional settings that provide the paths to the PEM-format SSL certificate and key files.
# These files validate that your Elasticsearch backend uses the same key files.
#elasticsearch.ssl.certificate: /path/to/your/client.crt
#elasticsearch.ssl.key: /path/to/your/client.key
# Optional setting that enables you to specify a path to the PEM file for the certificate
# authority for your Elasticsearch instance.
#elasticsearch.ssl.certificateAuthorities: [ "/path/to/your/CA.pem" ]
# To disregard the validity of SSL certificates, change this setting's value to 'none'.
#elasticsearch.ssl.verificationMode: full
# Time in milliseconds to wait for Elasticsearch to respond to pings. Defaults to the value of
# the elasticsearch.requestTimeout setting.
#elasticsearch.pingTimeout: 1500
# Time in milliseconds to wait for responses from the back end or Elasticsearch. This value
# must be a positive integer.
#elasticsearch.requestTimeout: 30000
# List of Kibana client-side headers to send to Elasticsearch. To send *no* client-side
# headers, set this value to [] (an empty list).
#elasticsearch.requestHeadersWhitelist: [ authorization ]
# Header names and values that are sent to Elasticsearch. Any custom headers cannot be overwritten
# by client-side headers, regardless of the elasticsearch.requestHeadersWhitelist configuration.
#elasticsearch.customHeaders: {}
# Time in milliseconds for Elasticsearch to wait for responses from shards. Set to 0 to disable.
#elasticsearch.shardTimeout: 0
# Time in milliseconds to wait for Elasticsearch at Kibana startup before retrying.
#elasticsearch.startupTimeout: 5000
# Specifies the path where Kibana creates the process ID file.
#pid.file: /var/run/kibana.pid
# Enables you specify a file where Kibana stores log output.
logging.dest: /var/log/kibana.log
# Set the value of this setting to true to suppress all logging output.
#logging.silent: false
# Set the value of this setting to true to suppress all logging output other than error messages.
#logging.quiet: false
# Set the value of this setting to true to log all events, including system usage information
# and all requests.
#logging.verbose: false
# Set the interval in milliseconds to sample system and process performance
# metrics. Minimum is 100ms. Defaults to 5000.
#ops.interval: 5000
# The default locale. This locale can be used in certain circumstances to substitute any missing
# translations.
#i18n.defaultLocale: "en"
touch /var/log/kibana.log; chmod 777 /var/log/kibana.log
systemctl restart kibana
[root@weifeng678 kibana]# ps aux|grep kibana
kibana 1661 49.4 6.3 1121600 119824 ? Ssl 16:45 0:04 /usr/share/kibana/bin/../node/bin/node --no-warnings /usr/share/kibana/bin/../src/cli -c /etc/kibana/kibana.yml
root 1697 0.0 0.0 112664 964 pts/1 R+ 16:45 0:00 grep --color=auto kibana
[root@weifeng678 kibana]# netstat -lntp
tcp 0 0 0.0.0.0:5601 0.0.0.0:* LISTEN 1661/node
用户名elastic,密码为之前你设置过的密码(如果未安装x-pack,不需要用户名密码)
若无法输入用户名密码,查日志/var/log/kibana.log
出现错误 Status changed from uninitialized to red - Elasticsearch is still initializing the kibana index.
解决办法:curl -XDELETE http://192.168.133.130:9200/.kibana -uelastic
ELK安装 – 安装logstash
以下在132上执行
logstash需要先安装java8,目前不支持java9
直接yum安装
yum install -y logstash //如果慢,就下载rpm包
rpm -ivh logstash-6.0.0.rpm
logstash也需要安装x-pack(可省略)
cd /usr/share/logstash/bin/ (可省略)
./logstash-plugin install file:///tmp/x-pack-6.0.0.zip (可省略)
systemctl enable logstash
systemctl start logstash
logstash收集syslog日志
以下在132上操作
编辑配置文件 vim /etc/logstash/conf.d/syslog.conf//加入如下内容
input {
syslog {
type => "system-syslog"
port => 10514
}
}
output {
stdout {
codec => rubydebug
}
}
检测配置文件是否有错
cd /usr/share/logstash/bin
./logstash --path.settings /etc/logstash/ -f /etc/logstash/conf.d/syslog.conf --config.test_and_exit
以下在132上操作
前台形式启动logstash
./logstash --path.settings /etc/logstash/ -f /etc/logstash/conf.d/syslog.conf//这样可以在屏幕上查看到日志输出,不能敲命令
再开一个终端
检测是否开启10514端口:netstat -lnp |grep 10514
vim/etc/rsyslog.conf//在#### RULES下面增加一行
*.* @@127.0.0.1:10514
配置文件实例:
[root@localhost ~]# cat /etc/rsyslog.conf
# rsyslog configuration file
# For more information see /usr/share/doc/rsyslog-*/rsyslog_conf.html
# If you experience problems, see http://www.rsyslog.com/doc/troubleshoot.html
#### MODULES ####
# The imjournal module bellow is now used as a message source instead of imuxsock.
$ModLoad imuxsock # provides support for local system logging (e.g. via logger command)
$ModLoad imjournal # provides access to the systemd journal
#$ModLoad imklog # reads kernel messages (the same are read from journald)
#$ModLoad immark # provides --MARK-- message capability
# Provides UDP syslog reception
#$ModLoad imudp
#$UDPServerRun 514
# Provides TCP syslog reception
#$ModLoad imtcp
#$InputTCPServerRun 514
#### GLOBAL DIRECTIVES ####
# Where to place auxiliary files
$WorkDirectory /var/lib/rsyslog
# Use default timestamp format
$ActionFileDefaultTemplate RSYSLOG_TraditionalFileFormat
# File syncing capability is disabled by default. This feature is usually not required,
# not useful and an extreme performance hit
#$ActionFileEnableSync on
# Include all config files in /etc/rsyslog.d/
$IncludeConfig /etc/rsyslog.d/*.conf
# Turn off message reception via local log socket;
# local messages are retrieved through imjournal now.
$OmitLocalLogging on
# File to store the position in the journal
$IMJournalStateFile imjournal.state
#### RULES ####
*.* @@192.168.4.83:10514
# Log all kernel messages to the console.
# Logging much else clutters up the screen.
#kern.* /dev/console
# Log anything (except mail) of level info or higher.
# Don't log private authentication messages!
*.info;mail.none;authpriv.none;cron.none /var/log/messages
# The authpriv file has restricted access.
authpriv.* /var/log/secure
# Log all the mail messages in one place.
mail.* -/var/log/maillog
# Log cron stuff
cron.* /var/log/cron
# Everybody gets emergency messages
*.emerg :omusrmsg:*
# Save news errors of level crit and higher in a special file.
uucp,news.crit /var/log/spooler
# Save boot messages also to boot.log
local7.* /var/log/boot.log
# ### begin forwarding rule ###
# The statement between the begin ... end define a SINGLE forwarding
# rule. They belong together, do NOT split them. If you create multiple
# forwarding rules, duplicate the whole block!
# Remote Logging (we use TCP for reliable delivery)
#
# An on-disk queue is created for this action. If the remote host is
# down, messages are spooled to disk and sent when it is up again.
#$ActionQueueFileName fwdRule1 # unique name prefix for spool files
#$ActionQueueMaxDiskSpace 1g # 1gb space limit (use as much as possible)
#$ActionQueueSaveOnShutdown on # save messages to disk on shutdown
#$ActionQueueType LinkedList # run asynchronously
#$ActionResumeRetryCount -1 # infinite retries if host is down
# remote host is: name/ip:port, e.g. 192.168.0.1:514, port optional
#*.* @@remote-host:514
# ### end of the forwarding rule ###
systemctl restart rsyslog
从130 ssh 登录到132上,可以在logstash前台的终端上看到ssh登录的相关日志
结束logstash,在前台的那个终端上按ctrl c
屏幕输出:
{
"severity" => 6,
"pid" => "10798",
"program" => "sshd",
"message" => "Accepted password for root from 192.168.4.81 port 33378 ssh2
",
"type" => "system-syslog",
"priority" => 86,
"logsource" => "localhost",
"@timestamp" => 2017-12-14T15:32:48.000Z,
"@version" => "1",
"host" => "127.0.0.1",
"facility" => 10,
"severity_label" => "Informational",
"timestamp" => "Dec 14 23:32:48",
"facility_label" => "security/authorization"
}
以下在132上操作
后台形式启动logstash
编辑配置文件 vim /etc/logstash/conf.d/syslog.conf//配置文件内容改为如下
input {
syslog {
type => "system-syslog"
port => 10514
}
}
output {
elasticsearch {
hosts => ["192.168.130.132:9200"]
index => "system-syslog-%{+YYYY.MM}"
}
}
测试检测下配置文件是否正确
[root@localhost bin]# ./logstash --path.settings /etc/logstash/ -f /etc/logstash/conf.d/syslog.conf --config.test_and_exit
OpenJDK 64-Bit Server VM warning: If the number of processors is expected to increase from one, then you should configure the number of parallel GC threads appropriately using -XX:ParallelGCThreads=N
Sending Logstash's logs to /var/log/logstash which is now configured via log4j2.properties
Configuration OK
systemctl start logstash //启动需要一些时间,启动完成后,可以看到9600端口和10514端口已被监听
[root@localhost ~]# netstat -lntp
tcp6 0 0 127.0.0.1:9600 :::* LISTEN 10829/java
tcp6 0 0 :::10514 :::* LISTEN 10829/java
130上执行curl 'localhost:9200/_cat/indices?v' 可以获取索引信息
[root@localhost ~]# curl '192.168.4.81:9200/_cat/indices?v'
health status index uuid pri rep docs.count docs.deleted store.size pri.store.size
green open .kibana TXIUAJVJTA2F-2rRPq-EQQ 1 1 1 0 6.9kb 3.4kb
green open system-syslog-2017.12 4AI2635WR8elfRW1s1Ar6A 5 1 17 0 241.4kb 120.7kb //可以获取到系统日志索引,找到索引表示logstash与elasticsearch通信正常
curl -XGET 'localhost:9200/indexname?pretty' 可以获指定索引详细信息
[root@localhost ~]# curl -XGET '192.168.4.81:9200/system-syslog-2017.12?pretty'
{
"system-syslog-2017.12" : {
"aliases" : { },
"mappings" : {
"system-syslog" : {
"properties" : {
"@timestamp" : {
"type" : "date"
},
"@version" : {
"type" : "text",
"fields" : {
"keyword" : {
"type" : "keyword",
"ignore_above" : 256
}
}
},
"facility" : {
"type" : "long"
},
"facility_label" : {
"type" : "text",
"fields" : {
"keyword" : {
"type" : "keyword",
"ignore_above" : 256
}
}
},
"host" : {
"type" : "text",
"fields" : {
"keyword" : {
"type" : "keyword",
"ignore_above" : 256
}
}
},
curl -XDELETE 'localhost:9200/logstash-xxx-*' 可以删除指定索引
浏览器访问192.168.132.130:5601,到kibana配置索引
左侧点击“Managerment”-> “Index Patterns”-> “Create Index Pattern”
Index pattern这里需要根据前面curl查询到的索引名字来写,否则下面的按钮是无法点击的
再点击 index 可以查看系统的日志,如没有信息被搜索到 可调整时间间隔来尝试
logstash收集nginx日志
132上 编辑配置文件 vim /etc/logstash/conf.d/nginx.conf//加入如下内容
input {
file {
path => "/tmp/elk_access.log"
start_position => "beginning"
type => "nginx"
}
}
filter {
grok {
match => { "message" => "%{IPORHOST:http_host} %{IPORHOST:clientip} - %{USERNAME:remote_user} [%{HTTPDATE:timestamp}] "(?:%{WORD:http_verb} %{NOTSPACE:http_request}(?: HTTP/%{NUMBER:http_version})?|%{DATA:raw_http_request})" %{NUMBER:response} (?:%{NUMBER:bytes_read}|-) %{QS:referrer} %{QS:agent} %{QS:xforwardedfor} %{NUMBER:request_time:float}"}
}
geoip {
source => "clientip"
}
}
output {
stdout { codec => rubydebug }
elasticsearch {
hosts => ["192.168.133.132:9200"]
index => "nginx-test-%{+YYYY.MM.dd}"
}
}
以下在132上操作
检测配置文件是否有错
cd /usr/share/logstash/bin
./logstash --path.settings /etc/logstash/ -f /etc/logstash/conf.d/nginx.conf --config.test_and_exit
yum install -y nginx
vim /etc/nginx/conf.d/elk.conf//写入如下内容
server {
listen 80;
server_name elk.weifeng.com;
location / {
proxy_pass http://192.168.133.130:5601;
proxy_set_header Host $host;
proxy_set_header X-Real-IP $remote_addr;
proxy_set_header X-Forwarded-For $proxy_add_x_forwarded_for;
}
access_log /tmp/elk_access.log main2;
}
实际配置内容:
[root@localhost ~]# cat /etc/nginx/conf.d/elk.conf
server {
listen 80;
server_name 192.168.4.83;
location / {
proxy_pass http://192.168.4.81:5601;
proxy_set_header Host $host;
proxy_set_header X-Real-IP $remote_addr;
proxy_set_header X-Forwarded-For $proxy_add_x_forwarded_for;
}
access_log /tmp/elk_access.log main2;
}
以下在132上操作
vim /etc/nginx/nginx.conf//增加如下内容
log_format main2 '$http_host $remote_addr - $remote_user [$time_local] "$request" '
'$status $body_bytes_sent "$http_referer" '
'"$http_user_agent" "$upstream_addr" $request_time';
nginx -t
systemctl start nginx
绑定hosts 192.168.133.132 elk.weifeng.com
浏览器访问,检查是否有日志产生
systemctl restart logstash
130上curl 'localhost:9200/_cat/indices?v'
实际操作:
[root@localhost ~]# curl '192.168.4.81:9200/_cat/indices?v'
health status index uuid pri rep docs.count docs.deleted store.size pri.store.size
green open .kibana TXIUAJVJTA2F-2rRPq-EQQ 1 1 3 1 34.5kb 18.6kb
green open system-syslog-2017.12 4AI2635WR8elfRW1s1Ar6A 5 1 2146 0 1.9mb 1mb
green open nginx-test-2017.12.14 R0uSIyUcSF2pw3ZAzw9ZFQ 5 1 2017 0 889.6kb 454.9kb
检查是否有nginx-test开头的索引生成
如果有,才能到kibana里去配置该索引
左侧点击“Managerment”-> “Index Patterns”-> “Create Index Pattern”
Index pattern这里写nginx-test-*
之后点击左侧的Discover
使用Beats采集日志
filebeat metricbeat packetbeat winlogbeat auditbeat heartbeat
可扩展,支持自定义构建
在133上执行
rpm -ivh filebeat-6.0.0-x86_64.rpm
首先编辑配置文件
vim /etc/filebeat/filebeat.yml //增加或者更改
filebeat.prospectors:
- type: log
paths:
- /var/log/messages
output.console:
enable: true
实际配置文件:
[root@localhost ~]# cat /etc/filebeat/filebeat.yml
###################### Filebeat Configuration Example #########################
# This file is an example configuration file highlighting only the most common
# options. The filebeat.reference.yml file from the same directory contains all the
# supported options with more comments. You can use it as a reference.
#
# You can find the full configuration reference here:
# For more available modules and options, please see the filebeat.reference.yml sample
# configuration file.
#=========================== Filebeat prospectors =============================
filebeat.prospectors:
# Each - is a prospector. Most options can be set at the prospector level, so
# you can use different prospectors for various configurations.
# Below are the prospector specific configurations.
- type: log
# Change to true to enable this prospector configuration.
# enabled: false
# Paths that should be crawled and fetched. Glob based paths.
paths:
- /var/log/messages
#- c:programdataelasticsearchlogs*
# Exclude lines. A list of regular expressions to match. It drops the lines that are
# matching any regular expression from the list.
#exclude_lines: ['^DBG']
# Include lines. A list of regular expressions to match. It exports the lines that are
# matching any regular expression from the list.
#include_lines: ['^ERR', '^WARN']
# Exclude files. A list of regular expressions to match. Filebeat drops the files that
# are matching any regular expression from the list. By default, no files are dropped.
#exclude_files: ['.gz$']
# Optional additional fields. These fields can be freely picked
# to add additional information to the crawled log files for filtering
#fields:
# level: debug
# review: 1
### Multiline options
# Mutiline can be used for log messages spanning multiple lines. This is common
# for Java Stack Traces or C-Line Continuation
# The regexp Pattern that has to be matched. The example pattern matches all lines starting with [
#multiline.pattern: ^[
# Defines if the pattern set under pattern should be negated or not. Default is false.
#multiline.negate: false
# Match can be set to "after" or "before". It is used to define if lines should be append to a pattern
# that was (not) matched before or after or as long as a pattern is not matched based on negate.
# Note: After is the equivalent to previous and before is the equivalent to to next in Logstash
#multiline.match: after
#============================= Filebeat modules ===============================
filebeat.config.modules:
# Glob pattern for configuration loading
path: ${path.config}/modules.d/*.yml
# Set to true to enable config reloading
reload.enabled: false
# Period on which files under path should be checked for changes
#reload.period: 10s
#==================== Elasticsearch template setting ==========================
setup.template.settings:
index.number_of_shards: 3
#index.codec: best_compression
#_source.enabled: false
#================================ General =====================================
# The name of the shipper that publishes the network data. It can be used to group
# all the transactions sent by a single shipper in the web interface.
#name:
# The tags of the shipper are included in their own field with each
# transaction published.
#tags: ["service-X", "web-tier"]
# Optional fields that you can specify to add additional information to the
# output.
#fields:
# env: staging
#============================== Dashboards =====================================
# These settings control loading the sample dashboards to the Kibana index. Loading
# the dashboards is disabled by default and can be enabled either by setting the
# options here, or by using the `-setup` CLI flag or the `setup` command.
#setup.dashboards.enabled: false
# The URL from where to download the dashboards archive. By default this URL
# has a value which is computed based on the Beat name and version. For released
# versions, this URL points to the dashboard archive on the artifacts.elastic.co
# website.
#setup.dashboards.url:
#============================== Kibana =====================================
# Starting with Beats version 6.0.0, the dashboards are loaded via the Kibana API.
# This requires a Kibana endpoint configuration.
setup.kibana:
# Kibana Host
# Scheme and port can be left out and will be set to the default (http and 5601)
# In case you specify and additional path, the scheme is required: http://localhost:5601/path
# IPv6 addresses should always be defined as: https://[2001:db8::1]:5601
#host: "localhost:5601"
#============================= Elastic Cloud ==================================
# These settings simplify using filebeat with the Elastic Cloud (https://cloud.elastic.co/).
# The cloud.id setting overwrites the `output.elasticsearch.hosts` and
# `setup.kibana.host` options.
# You can find the `cloud.id` in the Elastic Cloud web UI.
#cloud.id:
# The cloud.auth setting overwrites the `output.elasticsearch.username` and
# `output.elasticsearch.password` settings. The format is `<user>:<pass>`.
#cloud.auth:
#================================ Outputs =====================================
# Configure what output to use when sending the data collected by the beat.
output.console:
enable: true
#-------------------------- Elasticsearch output ------------------------------
#output.elasticsearch:
# Array of hosts to connect to.
# hosts: ["localhost:9200"]
# Optional protocol and basic auth credentials.
#protocol: "https"
#username: "elastic"
#password: "changeme"
#----------------------------- Logstash output --------------------------------
#output.logstash:
# The Logstash hosts
#hosts: ["localhost:5044"]
# Optional SSL. By default is off.
# List of root certificates for HTTPS server verifications
#ssl.certificate_authorities: ["/etc/pki/root/ca.pem"]
# Certificate for SSL client authentication
#ssl.certificate: "/etc/pki/client/cert.pem"
# Client Certificate Key
#ssl.key: "/etc/pki/client/cert.key"
#================================ Logging =====================================
# Sets log level. The default log level is info.
# Available log levels are: critical, error, warning, info, debug
#logging.level: debug
# At debug level, you can selectively enable logging only for some components.
# To enable all selectors use ["*"]. Examples of other selectors are "beat",
# "publish", "service".
#logging.selectors: ["*"]
/usr/share/filebeat/bin/filebeat -c /etc/filebeat/filebeat.yml //可以在屏幕上看到对应的日志信息
再编辑配置文件
vim /etc/filebeat/filebeat.yml //增加或者更改
filebeat.prospectors:
- input_type: log
paths:
- /var/log/messages
output.elasticsearch:
hosts: ["192.168.133.130:9200"]
实际配置文件:
[root@localhost ~]# cat /etc/filebeat/filebeat.yml
###################### Filebeat Configuration Example #########################
# This file is an example configuration file highlighting only the most common
# options. The filebeat.reference.yml file from the same directory contains all the
# supported options with more comments. You can use it as a reference.
#
# You can find the full configuration reference here:
# For more available modules and options, please see the filebeat.reference.yml sample
# configuration file.
#=========================== Filebeat prospectors =============================
filebeat.prospectors:
# Each - is a prospector. Most options can be set at the prospector level, so
# you can use different prospectors for various configurations.
# Below are the prospector specific configurations.
- type: log
# Change to true to enable this prospector configuration.
# enabled: false
# Paths that should be crawled and fetched. Glob based paths.
paths:
- /var/log/messages
#- c:programdataelasticsearchlogs*
# Exclude lines. A list of regular expressions to match. It drops the lines that are
# matching any regular expression from the list.
#exclude_lines: ['^DBG']
# Include lines. A list of regular expressions to match. It exports the lines that are
# matching any regular expression from the list.
#include_lines: ['^ERR', '^WARN']
# Exclude files. A list of regular expressions to match. Filebeat drops the files that
# are matching any regular expression from the list. By default, no files are dropped.
#exclude_files: ['.gz$']
# Optional additional fields. These fields can be freely picked
# to add additional information to the crawled log files for filtering
#fields:
# level: debug
# review: 1
### Multiline options
# Mutiline can be used for log messages spanning multiple lines. This is common
# for Java Stack Traces or C-Line Continuation
# The regexp Pattern that has to be matched. The example pattern matches all lines starting with [
#multiline.pattern: ^[
# Defines if the pattern set under pattern should be negated or not. Default is false.
#multiline.negate: false
# Match can be set to "after" or "before". It is used to define if lines should be append to a pattern
# that was (not) matched before or after or as long as a pattern is not matched based on negate.
# Note: After is the equivalent to previous and before is the equivalent to to next in Logstash
#multiline.match: after
#============================= Filebeat modules ===============================
filebeat.config.modules:
# Glob pattern for configuration loading
path: ${path.config}/modules.d/*.yml
# Set to true to enable config reloading
reload.enabled: false
# Period on which files under path should be checked for changes
#reload.period: 10s
#==================== Elasticsearch template setting ==========================
setup.template.settings:
index.number_of_shards: 3
#index.codec: best_compression
#_source.enabled: false
#================================ General =====================================
# The name of the shipper that publishes the network data. It can be used to group
# all the transactions sent by a single shipper in the web interface.
#name:
# The tags of the shipper are included in their own field with each
# transaction published.
#tags: ["service-X", "web-tier"]
# Optional fields that you can specify to add additional information to the
# output.
#fields:
# env: staging
#============================== Dashboards =====================================
# These settings control loading the sample dashboards to the Kibana index. Loading
# the dashboards is disabled by default and can be enabled either by setting the
# options here, or by using the `-setup` CLI flag or the `setup` command.
#setup.dashboards.enabled: false
# The URL from where to download the dashboards archive. By default this URL
# has a value which is computed based on the Beat name and version. For released
# versions, this URL points to the dashboard archive on the artifacts.elastic.co
# website.
#setup.dashboards.url:
#============================== Kibana =====================================
# Starting with Beats version 6.0.0, the dashboards are loaded via the Kibana API.
# This requires a Kibana endpoint configuration.
setup.kibana:
# Kibana Host
# Scheme and port can be left out and will be set to the default (http and 5601)
# In case you specify and additional path, the scheme is required: http://localhost:5601/path
# IPv6 addresses should always be defined as: https://[2001:db8::1]:5601
#host: "localhost:5601"
#============================= Elastic Cloud ==================================
# These settings simplify using filebeat with the Elastic Cloud (https://cloud.elastic.co/).
# The cloud.id setting overwrites the `output.elasticsearch.hosts` and
# `setup.kibana.host` options.
# You can find the `cloud.id` in the Elastic Cloud web UI.
#cloud.id:
# The cloud.auth setting overwrites the `output.elasticsearch.username` and
# `output.elasticsearch.password` settings. The format is `<user>:<pass>`.
#cloud.auth:
#================================ Outputs =====================================
# Configure what output to use when sending the data collected by the beat.
#-------------------------- Elasticsearch output ------------------------------
output.elasticsearch:
# Array of hosts to connect to.
hosts: ["192.168.4.81:9200"]
# Optional protocol and basic auth credentials.
#protocol: "https"
#username: "elastic"
#password: "changeme"
#----------------------------- Logstash output --------------------------------
#output.logstash:
# The Logstash hosts
#hosts: ["localhost:5044"]
# Optional SSL. By default is off.
# List of root certificates for HTTPS server verifications
#ssl.certificate_authorities: ["/etc/pki/root/ca.pem"]
# Certificate for SSL client authentication
#ssl.certificate: "/etc/pki/client/cert.pem"
# Client Certificate Key
#ssl.key: "/etc/pki/client/cert.key"
#================================ Logging =====================================
# Sets log level. The default log level is info.
# Available log levels are: critical, error, warning, info, debug
#logging.level: debug
# At debug level, you can selectively enable logging only for some components.
# To enable all selectors use ["*"]. Examples of other selectors are "beat",
# "publish", "service".
#logging.selectors: ["*"]
systemctl start filebeat
查看新的索引:
[root@localhost ~]# curl '192.168.4.81:9200/_cat/indices?v'
health status index uuid pri rep docs.count docs.deleted store.size pri.store.size
green open nginx-test-2017.12.14 R0uSIyUcSF2pw3ZAzw9ZFQ 5 1 12037 0 4.7mb 2.5mb
green open system-syslog-2017.12 4AI2635WR8elfRW1s1Ar6A 5 1 12165 0 5.1mb 2.5mb
green open .kibana TXIUAJVJTA2F-2rRPq-EQQ 1 1 4 1 45.9kb 24.3kb
green open filebeat-6.0.0-2017.12.15 g56dvk51TMO6knC6ajgAuw 3 1 43411 0 6.5mb 3.2mb
添加索引: