创建 mysql-exporter 应用
apiVersion: apps/v1
kind: Deployment
metadata:
  labels:
    app: mysql-exporter
    k8s.kuboard.cn/name: mysql-exporter
  managedFields:
   - apiVersion: apps/v1
  name: mysql-exporter
  namespace: monitoring
spec:
  progressDeadlineSeconds: 600
  replicas: 1
  revisionHistoryLimit: 10
  selector:
    matchLabels:
      app: mysql-exporter
  strategy:
    rollingUpdate:
      maxSurge: 25%
      maxUnavailable: 25%
    type: RollingUpdate
  template:
    metadata:
      creationTimestamp: null
      labels:
        app: mysql-exporter
    spec:
      containers:
      - env:
        - name: port
          value: "9104"
        - name: endpoint
          value: /metrics
        - name: DATA_SOURCE_NAME
          value: ********/mysql
        image: prom/mysqld-exporter:latest
        imagePullPolicy: Always
        name: mysql-exporter
        ports:
        - containerPort: 9104
          protocol: TCP
        resources: {}
        terminationMessagePath: /dev/termination-log
        terminationMessagePolicy: File
      dnsPolicy: ClusterFirst
      restartPolicy: Always
      schedulerName: default-scheduler
      securityContext: {}
      terminationGracePeriodSeconds: 30
kubectl apply -f mysql-exporter-deploy.yaml
创建 mysql-exporter 的 service
apiVersion: v1
kind: Service
metadata:
  labels:
    app: mysql-exporter
  name: mysql-exporter
  namespace: monitoring
spec:
  externalTrafficPolicy: Cluster
  ports:
  - name: http
    nodePort: 31104
    port: 9104
    protocol: TCP
    targetPort: 9104
  selector:
    app: mysql-exporter
  sessionAffinity: None
  type: NodePort
status:
  loadBalancer: {}
kubectl apply -f mysql-exporter-svc.yaml
创建 mysql-exporter 的 endpoints
apiVersion: v1
kind: Endpoints
metadata:
  labels:
    app: mysql-exporter
  name: mysql-exporter
  namespace: monitoring
subsets:
- addresses:
  - ip: 172.16.147.186
    nodeName: k8s-worker2
  ports:
  - name: http
    port: 31104
    protocol: TCP
kubectl apply -f mysql-exporter-endpoints.yaml
创建 mysql-exporter的 servicemonitor
apiVersion: monitoring.coreos.com/v1
kind: ServiceMonitor
metadata:
  labels:
    app: mysql-exporter
  name: mysql-exporter
  namespace: monitoring
spec:
  endpoints:
  - bearerTokenFile: /var/run/secrets/kubernetes.io/serviceaccount/token
    interval: 15s
    port: http
    relabelings:
    - action: replace
      regex: (.*)
      replacement: $1
      sourceLabels:
      - __meta_kubernetes_pod_node_name
      targetLabel: instance
    scheme: http
    tlsConfig:
      insecureSkipVerify: true
  jobLabel: app
  selector:
    matchLabels:
      app: mysql-exporter
kubectl apply -f mysql-exporter-servicemonitor.yaml
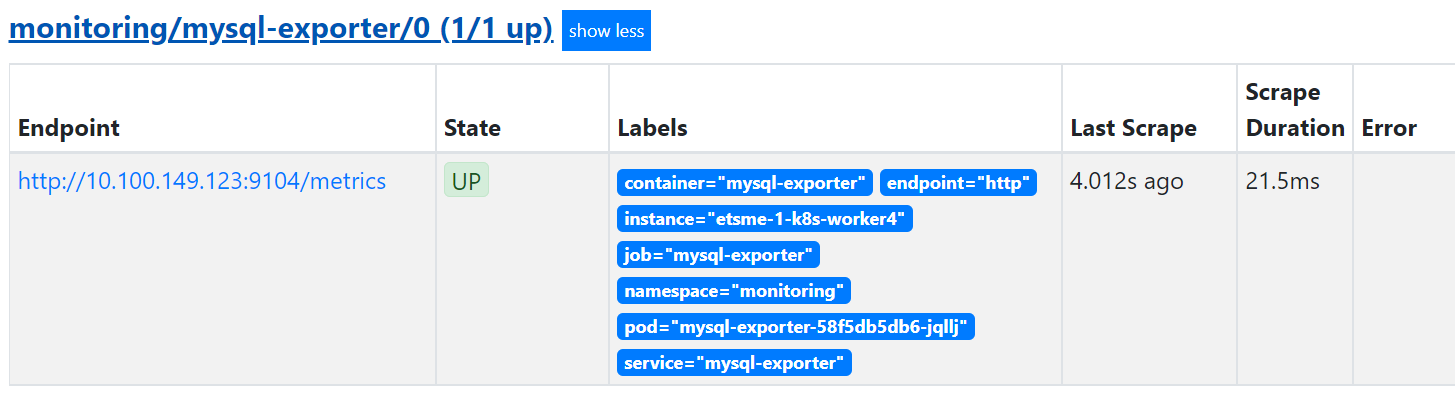
查看prometheus target 页面是否添加成功:
添加 mysql_prometheusrules 报警规则:
apiVersion: monitoring.coreos.com/v1
kind: PrometheusRule
metadata:
  labels:
    prometheus: k8s
    role: alert-rules
  name: mysql-prometheus-rules
  namespace: monitoring
spec:
  groups:
  - name: mysql-galera
    rules:
    - record: mysql_slave_lag_seconds
      expr: mysql_slave_status_seconds_behind_master - mysql_slave_status_sql_delay
    - record: mysql_heartbeat_lag_seconds
      expr: mysql_heartbeat_now_timestamp_seconds - mysql_heartbeat_stored_timestamp_seconds
    - record: job:mysql_transactions:rate5m
      expr: sum(rate(mysql_global_status_commands_total{command=~"(commit|rollback)"}[5m])) without (command)
    - alert: MySQLGaleraNotReady
      expr: mysql_global_status_wsrep_ready != 1
      for: 2m
      labels:
        severity: warning
      annotations:
        description: '{{`{{$labels.job}}`}} on {{`{{$labels.instance}}`}} is not ready.'
        summary: Galera cluster node not ready
    - alert: MySQLGaleraOutOfSync
      expr: (mysql_global_status_wsrep_local_state != 4 and mysql_global_variables_wsrep_desync
        == 0)
      for: 5m
      labels:
        severity: warning
      annotations:
        description: '{{`{{$labels.job}}`}} on {{`{{$labels.instance}}`}} is not in sync ({{`{{$value}}`}}
          != 4).'
        summary: Galera cluster node out of sync
    - alert: MySQLGaleraDonorFallingBehind
      expr: (mysql_global_status_wsrep_local_state == 2 and mysql_global_status_wsrep_local_recv_queue > 100)
      for: 5m
      labels:
        severity: warning
      annotations:
        description: '{{`{{$labels.job}}`}} on {{`{{$labels.instance}}`}} is a donor (hotbackup)
          and is falling behind (queue size {{`{{$value}}`}}).'
        summary: xtradb cluster donor node falling behind
    - alert: MySQLReplicationNotRunning
      expr: mysql_slave_status_slave_io_running == 0 or mysql_slave_status_slave_sql_running
        == 0
      for: 2m
      labels:
        severity: critical
      annotations:
        description: Slave replication (IO or SQL) has been down for more than 2 minutes.
        summary: Slave replication is not running
    - alert: MySQLReplicationLag
      expr: (mysql_slave_lag_seconds > 30) and on(instance) (predict_linear(mysql_slave_lag_seconds[5m],
        60 * 2) > 0)
      for: 1m
      labels:
        severity: critical
      annotations:
        description: The mysql slave replication has fallen behind and is not recovering
        summary: MySQL slave replication is lagging
    - alert: MySQLReplicationLag
      expr: (mysql_heartbeat_lag_seconds > 30) and on(instance) (predict_linear(mysql_heartbeat_lag_seconds[5m],
        60 * 2) > 0)
      for: 1m
      labels:
        severity: critical
      annotations:
        description: The mysql slave replication has fallen behind and is not recovering
        summary: MySQL slave replication is lagging
    - alert: MySQLInnoDBLogWaits
      expr: rate(mysql_global_status_innodb_log_waits[15m]) > 10
      labels:
        severity: warning
      annotations:
        description: The innodb logs are waiting for disk at a rate of {{`{{$value}}`}} second
        summary: MySQL innodb log writes stalling

  - name: mysql-stats
    rules:
    - alert: MySQLInstanceDown
      expr: mysql_up == 0
      for: 1m
      labels:
        severity: critical
      annotations:
        summary: "Instance {{`{{ $labels.instance }}`}} MySQL is down"
        description: "MySQL Instance is down, This requires immediate action."
    - alert: MySQLOpenFilesHigh
      expr: mysql_global_status_innodb_num_open_files > (mysql_global_variables_open_files_limit) * 0.75
      for: 1m
      labels:
        severity: warning
      annotations:
        summary: "Instance {{`{{ $labels.instance }}`}} open files high"
        description: "Open files is high, Please consider increasing open_files_limit."
    - alert: MySQLReadBufferOutOfMaxAllow
      expr: mysql_global_variables_read_buffer_size > mysql_global_variables_slave_max_allowed_packet
      for: 1m
      labels:
        severity: warning
      annotations:
        summary: "Instance {{`{{ $labels.instance }}`}} Read buffer size is bigger than max. allowed packet size"
        description: "Read buffer size (read_buffer_size) is bigger than max. allowed packet size (max_allowed_packet).This can break your replication."

    - alert: MySQLSortBufferMissconfigured
      expr: mysql_global_variables_innodb_sort_buffer_size <256*1024 or mysql_global_variables_read_buffer_size > 4*1024*1024
      for: 1m
      labels:
        severity: warning
      annotations:
        summary: "Instance {{`{{ $labels.instance }}`}} Sort buffer possibly missconfigured"
        description: "Sort buffer size is either too big or too small. A good value for sort_buffer_size is between 256k and 4M."
    - alert: MySQLThreadStackSizeTooSmall
      expr: mysql_global_variables_thread_stack <196608
      for: 1m
      labels:
        severity: warning
      annotations:
        summary: "Instance {{`{{ $labels.instance }}`}} Thread stack size is too small"
        description: "Thread stack size is too small. This can cause problems when you use Stored Language constructs for example. A typical is 256k for thread_stack_size."
    - alert: MySQLTooManyConnections
      expr: mysql_global_status_max_used_connections > mysql_global_variables_max_connections * 0.8
      for: 1m
      labels:
        severity: warning
      annotations:
        summary: "Instance {{`{{ $labels.instance }}`}} Used more than 80% of max connections limited"
        description: "Used more than 80% of max connections limited"
    - alert: MySQLInnoDBForceRecoveryIsEnabled
      expr: mysql_global_variables_innodb_force_recovery != 0
      for: 1m
      labels:
        severity: warning
      annotations:
        summary: "Instance {{`{{ $labels.instance }}`}} InnoDB Force Recovery is enabled"
        description: "InnoDB Force Recovery is enabled. This mode should be used for data recovery purposes only. It prohibits writing to the data."
    - alert: MySQLInnoDBLogFileSizeIsTooSmall
      expr: mysql_global_variables_innodb_log_file_size < 16777216
      for: 1m
      labels:
        severity: warning
      annotations:
        summary: "Instance {{`{{ $labels.instance }}`}} InnoDB Log File size is too small"
        description: "The InnoDB Log File size is possibly too small. Choosing a small InnoDB Log File size can have significant performance impacts."
    - alert: MySQLInnoDBFlushLogAtTransactionCommit
      expr: mysql_global_variables_innodb_flush_log_at_trx_commit != 1
      for: 1m
      labels:
        severity: warning
      annotations:
        summary: "Instance {{`{{ $labels.instance }}`}} InnoDB Flush Log at Transaction Commit"
        description: "InnoDB Flush Log at Transaction Commit is set to a values != 1. This can lead to a loss of commited transactions in case of a power failure."
    - alert: MySQLTableDefinitionCacheTooSmall
      expr: mysql_global_status_open_table_definitions > mysql_global_variables_table_definition_cache
      for: 1m
      labels:
        severity: page
      annotations:
        summary: "Instance {{`{{ $labels.instance }}`}} Table definition cache too small"
        description: "Your Table Definition Cache is possibly too small. If it is much too small this can have significant performance impacts!"
    - alert: MySQLThreadStackSizeIsPossiblyTooSmall
      expr: mysql_global_variables_thread_stack < 262144
      for: 1m
      labels:
        severity: page
      annotations:
        summary: "Instance {{`{{ $labels.instance }}`}} Thread stack size is possibly too small"
        description: "Thread stack size is possibly too small. This can cause problems when you use Stored Language constructs for example. A typical is 256k for   thread_stack_size."
    - alert: MySQLBinaryLogIsDisabled
      expr: mysql_global_variables_log_bin != 1
      for: 1m
      labels:
        severity: warning
      annotations:
        summary: "Instance {{`{{ $labels.instance }}`}} Binary Log is disabled"
        description: "Binary Log is disabled. This prohibits you to do Point in Time Recovery (PiTR)."
    - alert: MySQLIOThreadStopped
      expr: mysql_slave_status_slave_io_running != 1
      for: 1m
      labels:
        severity: critical
      annotations:
        summary: "Instance {{`{{ $labels.instance }}`}} IO thread stopped"
        description: "IO thread has stopped. This is usually because it cannot connect to the Master any more."
    - alert: MySQLSQLThreadStopped
      expr: mysql_slave_status_slave_sql_running == 0
      for: 1m
      labels:
        severity: critical
      annotations:
        summary: "Instance {{`{{ $labels.instance }}`}} SQL thread stopped"
        description: "SQL thread has stopped. This is usually because it cannot apply a SQL statement received from the master."
    - alert: MySQLSQLThreadError
      expr: mysql_slave_status_slave_sql_running != 1
      for: 1m
      labels:
        severity: critical
      annotations:
        summary: "Instance {{`{{ $labels.instance }}`}} Sync Binlog is enabled"
        description: "SQL thread has stopped. This is usually because it cannot apply a SQL statement received from the master."
    - alert: MySQLSlaveLaggingBehindMaster
      expr: rate(mysql_slave_status_seconds_behind_master[1m]) > 30
      for: 1m
      labels:
        severity: warning
      annotations:
        summary: "Instance {{`{{ $labels.instance }}`}} Slave lagging behind Master"
        description: "Slave is lagging behind Master. Please check if Slave threads are running and if there are some performance issues!"
kubectl apply -f mysql_prometheusrule.yaml 生效
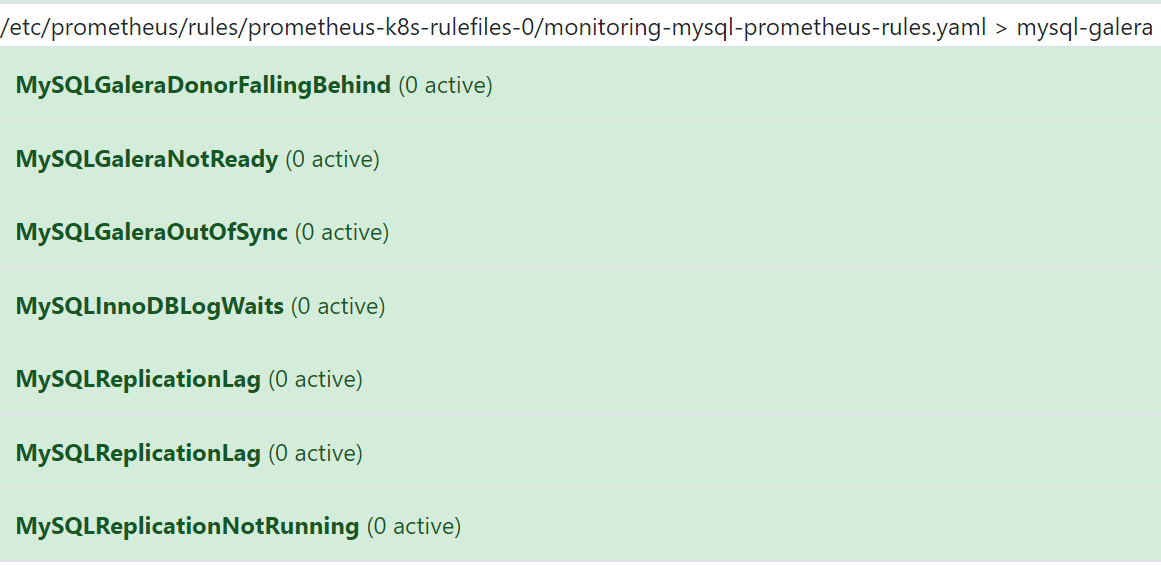
查看 prometheus mysql监控项是否生效
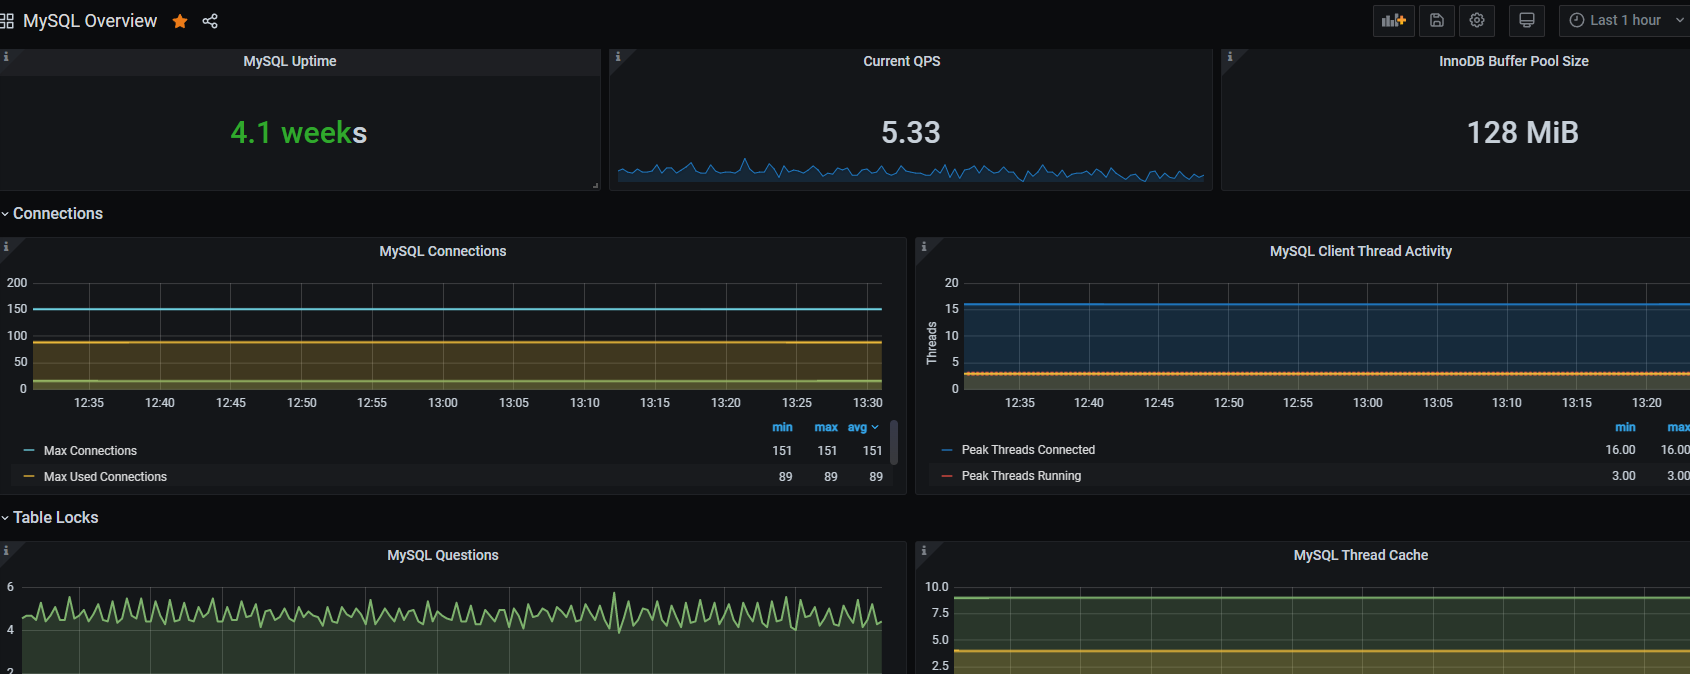
grafana 添加 mysql dashboard
{
"__requires": [
{
"type": "grafana",
"id": "grafana",
"name": "Grafana",
"version": "5.0.3"
},
{
"type": "panel",
"id": "graph",
"name": "Graph",
"version": "5.0.0"
},
{
"type": "datasource",
"id": "prometheus",
"name": "Prometheus",
"version": "5.0.0"
},
{
"type": "panel",
"id": "singlestat",
"name": "Singlestat",
"version": "5.0.0"
}
],
"annotations": {
"list": [
{
"builtIn": 1,
"datasource": "-- Grafana --",
"enable": true,
"hide": false,
"iconColor": "#e0752d",
"limit": 100,
"name": "PMM Annotations",
"showIn": 0,
"tags": [
"pmm_annotation"
],
"type": "tags"
}
]
},
"editable": true,
"gnetId": null,
"graphTooltip": 1,
"id": null,
"iteration": 1534407320176,
"links": [],
"panels": [
{
"collapsed": false,
"gridPos": {
"h": 1,
"w": 24,
"x": 0,
"y": 0
},
"id": 382,
"panels": [],
"repeat": null,
"title": "",
"type": "row"
},
{
"cacheTimeout": null,
"colorBackground": false,
"colorValue": true,
"colors": [
"rgba(245, 54, 54, 0.9)",
"rgba(237, 129, 40, 0.89)",
"rgba(50, 172, 45, 0.97)"
],
"datasource": "prometheus",
"decimals": 1,
"description": "**MySQL Uptime**\n\nThe amount of time since the last restart of the MySQL server process.",
"editable": true,
"error": false,
"format": "s",
"gauge": {
"maxValue": 100,
"minValue": 0,
"show": false,
"thresholdLabels": false,
"thresholdMarkers": true
},
"gridPos": {
"h": 4,
"w": 8,
"x": 0,
"y": 1
},
"height": "125px",
"id": 12,
"interval": "$interval",
"links": [],
"mappingType": 1,
"mappingTypes": [
{
"name": "value to text",
"value": 1
},
{
"name": "range to text",
"value": 2
}
],
"maxDataPoints": 100,
"nullPointMode": "connected",
"nullText": null,
"postfix": "s",
"postfixFontSize": "80%",
"prefix": "",
"prefixFontSize": "80%",
"rangeMaps": [
{
"from": "null",
"text": "N/A",
"to": "null"
}
],
"sparkline": {
"fillColor": "rgba(31, 118, 189, 0.18)",
"full": false,
"lineColor": "rgb(31, 120, 193)",
"show": false
},
"tableColumn": "",
"targets": [
{
"calculatedInterval": "10m",
"datasourceErrors": {},
"errors": {},
"expr": "mysql_global_status_uptime{instance=\"$host\"}",
"format": "time_series",
"interval": "5m",
"intervalFactor": 1,
"legendFormat": "",
"metric": "",
"refId": "A",
"step": 300
}
],
"thresholds": "300,3600",
"title": "MySQL Uptime",
"transparent": false,
"type": "singlestat",
"valueFontSize": "80%",
"valueMaps": [],
"valueName": "current"
},
{
"cacheTimeout": null,
"colorBackground": false,
"colorValue": false,
"colors": [
"rgba(245, 54, 54, 0.9)",
"rgba(237, 129, 40, 0.89)",
"rgba(50, 172, 45, 0.97)"
],
"datasource": "prometheus",
"decimals": 2,
"description": "**Current QPS**\n\nBased on the queries reported by MySQL's ``SHOW STATUS`` command, it is the number of statements executed by the server within the last second. This variable includes statements executed within stored programs, unlike the Questions variable. It does not count \n``COM_PING`` or ``COM_STATISTICS`` commands.",
"editable": true,
"error": false,
"format": "short",
"gauge": {
"maxValue": 100,
"minValue": 0,
"show": false,
"thresholdLabels": false,
"thresholdMarkers": true
},
"gridPos": {
"h": 4,
"w": 8,
"x": 8,
"y": 1
},
"height": "125px",
"id": 13,
"interval": "$interval",
"links": [
{
"targetBlank": true,
"title": "MySQL Server Status Variables",
"type": "absolute",
"url": "https://dev.mysql.com/doc/refman/5.7/en/server-status-variables.html#statvar_Queries"
}
],
"mappingType": 1,
"mappingTypes": [
{
"name": "value to text",
"value": 1
},
{
"name": "range to text",
"value": 2
}
],
"maxDataPoints": 100,
"nullPointMode": "connected",
"nullText": null,
"postfix": "",
"postfixFontSize": "50%",
"prefix": "",
"prefixFontSize": "80%",
"rangeMaps": [
{
"from": "null",
"text": "N/A",
"to": "null"
}
],
"sparkline": {
"fillColor": "rgba(31, 118, 189, 0.18)",
"full": false,
"lineColor": "rgb(31, 120, 193)",
"show": true
},
"tableColumn": "",
"targets": [
{
"calculatedInterval": "10m",
"datasourceErrors": {},
"errors": {},
"expr": "rate(mysql_global_status_queries{instance=\"$host\"}[$interval]) or irate(mysql_global_status_queries{instance=\"$host\"}[5m])",
"format": "time_series",
"interval": "$interval",
"intervalFactor": 1,
"legendFormat": "",
"metric": "",
"refId": "A",
"step": 20
}
],
"thresholds": "35,75",
"title": "Current QPS",
"transparent": false,
"type": "singlestat",
"valueFontSize": "80%",
"valueMaps": [],
"valueName": "current"
},
{
"cacheTimeout": null,
"colorBackground": false,
"colorValue": false,
"colors": [
"rgba(50, 172, 45, 0.97)",
"rgba(237, 129, 40, 0.89)",
"rgba(245, 54, 54, 0.9)"
],
"datasource": "prometheus",
"decimals": 0,
"description": "**InnoDB Buffer Pool Size**\n\nInnoDB maintains a storage area called the buffer pool for caching data and indexes in memory. Knowing how the InnoDB buffer pool works, and taking advantage of it to keep frequently accessed data in memory, is one of the most important aspects of MySQL tuning. The goal is to keep the working set in memory. In most cases, this should be between 60%-90% of available memory on a dedicated database host, but depends on many factors.",
"editable": true,
"error": false,
"format": "bytes",
"gauge": {
"maxValue": 100,
"minValue": 0,
"show": false,
"thresholdLabels": false,
"thresholdMarkers": true
},
"gridPos": {
"h": 4,
"w": 8,
"x": 16,
"y": 1
},
"height": "125px",
"id": 51,
"interval": "$interval",
"links": [
{
"targetBlank": true,
"title": "Tuning the InnoDB Buffer Pool Size",
"type": "absolute",
"url": "https://www.percona.com/blog/2015/06/02/80-ram-tune-innodb_buffer_pool_size/"
}
],
"mappingType": 1,
"mappingTypes": [
{
"name": "value to text",
"value": 1
},
{
"name": "range to text",
"value": 2
}
],
"maxDataPoints": 100,
"nullPointMode": "connected",
"nullText": null,
"postfix": "",
"postfixFontSize": "50%",
"prefix": "",
"prefixFontSize": "80%",
"rangeMaps": [
{
"from": "null",
"text": "N/A",
"to": "null"
}
],
"sparkline": {
"fillColor": "rgba(31, 118, 189, 0.18)",
"full": false,
"lineColor": "rgb(31, 120, 193)",
"show": false
},
"tableColumn": "",
"targets": [
{
"calculatedInterval": "10m",
"datasourceErrors": {},
"errors": {},
"expr": "mysql_global_variables_innodb_buffer_pool_size{instance=\"$host\"}",
"format": "time_series",
"interval": "5m",
"intervalFactor": 1,
"legendFormat": "",
"metric": "",
"refId": "A",
"step": 300
}
],
"thresholds": "90,95",
"title": "InnoDB Buffer Pool Size",
"transparent": false,
"type": "singlestat",
"valueFontSize": "80%",
"valueMaps": [],
"valueName": "current"
},
{
"collapsed": false,
"gridPos": {
"h": 1,
"w": 24,
"x": 0,
"y": 5
},
"id": 383,
"panels": [],
"repeat": null,
"title": "Connections",
"type": "row"
},
{
"aliasColors": {},
"bars": false,
"dashLength": 10,
"dashes": false,
"datasource": "prometheus",
"decimals": 0,
"description": "**Max Connections** \n\nMax Connections is the maximum permitted number of simultaneous client connections. By default, this is 151. Increasing this value increases the number of file descriptors that mysqld requires. If the required number of descriptors are not available, the server reduces the value of Max Connections.\n\nmysqld actually permits Max Connections + 1 clients to connect. The extra connection is reserved for use by accounts that have the SUPER privilege, such as root.\n\nMax Used Connections is the maximum number of connections that have been in use simultaneously since the server started.\n\nConnections is the number of connection attempts (successful or not) to the MySQL server.",
"editable": true,
"error": false,
"fill": 2,
"grid": {},
"gridPos": {
"h": 7,
"w": 12,
"x": 0,
"y": 6
},
"height": "250px",
"id": 92,
"legend": {
"alignAsTable": true,
"avg": true,
"current": false,
"max": true,
"min": true,
"show": true,
"sort": "avg",
"sortDesc": true,
"total": false,
"values": true
},
"lines": true,
"linewidth": 2,
"links": [
{
"targetBlank": true,
"title": "MySQL Server System Variables",
"type": "absolute",
"url": "https://dev.mysql.com/doc/refman/5.7/en/server-system-variables.html#sysvar_max_connections"
}
],
"nullPointMode": "null",
"percentage": false,
"pointradius": 5,
"points": false,
"renderer": "flot",
"seriesOverrides": [
{
"alias": "Max Connections",
"fill": 0
}
],
"spaceLength": 10,
"stack": false,
"steppedLine": false,
"targets": [
{
"calculatedInterval": "2m",
"datasourceErrors": {},
"errors": {},
"expr": "max(max_over_time(mysql_global_status_threads_connected{instance=\"$host\"}[$interval]) or mysql_global_status_threads_connected{instance=\"$host\"} )",
"format": "time_series",
"interval": "$interval",
"intervalFactor": 1,
"legendFormat": "Connections",
"metric": "",
"refId": "A",
"step": 20
},
{
"calculatedInterval": "2m",
"datasourceErrors": {},
"errors": {},
"expr": "mysql_global_status_max_used_connections{instance=\"$host\"}",
"format": "time_series",
"interval": "$interval",
"intervalFactor": 1,
"legendFormat": "Max Used Connections",
"metric": "",
"refId": "C",
"step": 20,
"target": ""
},
{
"calculatedInterval": "2m",
"datasourceErrors": {},
"errors": {},
"expr": "mysql_global_variables_max_connections{instance=\"$host\"}",
"format": "time_series",
"interval": "$interval",
"intervalFactor": 1,
"legendFormat": "Max Connections",
"metric": "",
"refId": "B",
"step": 20,
"target": ""
}
],
"thresholds": [],
"timeFrom": null,
"timeShift": null,
"title": "MySQL Connections",
"tooltip": {
"msResolution": false,
"shared": true,
"sort": 0,
"value_type": "cumulative"
},
"type": "graph",
"xaxis": {
"buckets": null,
"mode": "time",
"name": null,
"show": true,
"values": []
},
"yaxes": [
{
"format": "short",
"label": "",
"logBase": 1,
"max": null,
"min": 0,
"show": true
},
{
"format": "short",
"label": "",
"logBase": 1,
"max": null,
"min": 0,
"show": true
}
],
"yaxis": {
"align": false,
"alignLevel": null
}
},
{
"aliasColors": {},
"bars": false,
"dashLength": 10,
"dashes": false,
"datasource": "prometheus",
"decimals": 2,
"description": "**MySQL Active Threads**\n\nThreads Connected is the number of open connections, while Threads Running is the number of threads not sleeping.",
"editable": true,
"error": false,
"fill": 2,
"grid": {},
"gridPos": {
"h": 7,
"w": 12,
"x": 12,
"y": 6
},
"id": 10,
"legend": {
"alignAsTable": true,
"avg": true,
"current": true,
"max": true,
"min": true,
"rightSide": false,
"show": true,
"sortDesc": true,
"total": false,
"values": true
},
"lines": true,
"linewidth": 2,
"links": [],
"nullPointMode": "null",
"percentage": false,
"pointradius": 5,
"points": false,
"renderer": "flot",
"seriesOverrides": [
{
"alias": "Peak Threads Running",
"color": "#E24D42",
"lines": false,
"pointradius": 1,
"points": true
},
{
"alias": "Peak Threads Connected",
"color": "#1F78C1"
},
{
"alias": "Avg Threads Running",
"color": "#EAB839"
}
],
"spaceLength": 10,
"stack": false,
"steppedLine": false,
"targets": [
{
"calculatedInterval": "2m",
"datasourceErrors": {},
"errors": {},
"expr": "max_over_time(mysql_global_status_threads_connected{instance=\"$host\"}[$interval]) or\nmax_over_time(mysql_global_status_threads_connected{instance=\"$host\"}[5m])",
"format": "time_series",
"hide": false,
"interval": "$interval",
"intervalFactor": 1,
"legendFormat": "Peak Threads Connected",
"metric": "",
"refId": "A",
"step": 20
},
{
"calculatedInterval": "2m",
"datasourceErrors": {},
"errors": {},
"expr": "max_over_time(mysql_global_status_threads_running{instance=\"$host\"}[$interval]) or\nmax_over_time(mysql_global_status_threads_running{instance=\"$host\"}[5m])",
"format": "time_series",
"interval": "$interval",
"intervalFactor": 1,
"legendFormat": "Peak Threads Running",
"metric": "",
"refId": "B",
"step": 20
},
{
"expr": "avg_over_time(mysql_global_status_threads_running{instance=\"$host\"}[$interval]) or \navg_over_time(mysql_global_status_threads_running{instance=\"$host\"}[5m])",
"format": "time_series",
"interval": "$interval",
"intervalFactor": 1,
"legendFormat": "Avg Threads Running",
"refId": "C",
"step": 20
}
],
"thresholds": [],
"timeFrom": null,
"timeShift": null,
"title": "MySQL Client Thread Activity",
"tooltip": {
"msResolution": false,
"shared": true,
"sort": 0,
"value_type": "individual"
},
"type": "graph",
"xaxis": {
"buckets": null,
"mode": "time",
"name": null,
"show": true,
"values": [
"total"
]
},
"yaxes": [
{
"format": "short",
"label": "Threads",
"logBase": 1,
"max": null,
"min": 0,
"show": true
},
{
"format": "short",
"label": "",
"logBase": 1,
"max": null,
"min": 0,
"show": false
}
],
"yaxis": {
"align": false,
"alignLevel": null
}
},
{
"collapsed": false,
"gridPos": {
"h": 1,
"w": 24,
"x": 0,
"y": 13
},
"id": 384,
"panels": [],
"repeat": null,
"title": "Table Locks",
"type": "row"
},
{
"aliasColors": {},
"bars": false,
"dashLength": 10,
"dashes": false,
"datasource": "prometheus",
"decimals": null,
"description": "**MySQL Questions**\n\nThe number of statements executed by the server. This includes only statements sent to the server by clients and not statements executed within stored programs, unlike the Queries used in the QPS calculation. \n\nThis variable does not count the following commands:\n* ``COM_PING``\n* ``COM_STATISTICS``\n* ``COM_STMT_PREPARE``\n* ``COM_STMT_CLOSE``\n* ``COM_STMT_RESET``",
"editable": true,
"error": false,
"fill": 2,
"grid": {},
"gridPos": {
"h": 7,
"w": 12,
"x": 0,
"y": 14
},
"id": 53,
"legend": {
"alignAsTable": true,
"avg": true,
"current": false,
"max": true,
"min": true,
"rightSide": false,
"show": true,
"total": false,
"values": true
},
"lines": true,
"linewidth": 2,
"links": [
{
"targetBlank": true,
"title": "MySQL Queries and Questions",
"type": "absolute",
"url": "https://www.percona.com/blog/2014/05/29/how-mysql-queries-and-questions-are-measured/"
}
],
"nullPointMode": "null",
"percentage": false,
"pointradius": 5,
"points": false,
"renderer": "flot",
"seriesOverrides": [],
"spaceLength": 10,
"stack": false,
"steppedLine": false,
"targets": [
{
"calculatedInterval": "2m",
"datasourceErrors": {},
"errors": {},
"expr": "rate(mysql_global_status_questions{instance=\"$host\"}[$interval]) or irate(mysql_global_status_questions{instance=\"$host\"}[5m])",
"format": "time_series",
"interval": "$interval",
"intervalFactor": 1,
"legendFormat": "Questions",
"metric": "",
"refId": "A",
"step": 20
}
],
"thresholds": [],
"timeFrom": null,
"timeShift": null,
"title": "MySQL Questions",
"tooltip": {
"msResolution": false,
"shared": true,
"sort": 0,
"value_type": "individual"
},
"type": "graph",
"xaxis": {
"buckets": null,
"mode": "time",
"name": null,
"show": true,
"values": []
},
"yaxes": [
{
"format": "short",
"logBase": 1,
"max": null,
"min": 0,
"show": true
},
{
"format": "short",
"logBase": 1,
"max": null,
"min": 0,
"show": true
}
],
"yaxis": {
"align": false,
"alignLevel": null
}
},
{
"aliasColors": {},
"bars": false,
"dashLength": 10,
"dashes": false,
"datasource": "prometheus",
"decimals": 2,
"description": "**MySQL Thread Cache**\n\nThe thread_cache_size variable sets how many threads the server should cache to reuse. When a client disconnects, the client's threads are put in the cache if the cache is not full. It is autosized in MySQL 5.6.8 and above (capped to 100). Requests for threads are satisfied by reusing threads taken from the cache if possible, and only when the cache is empty is a new thread created.\n\n* *Threads_created*: The number of threads created to handle connections.\n* *Threads_cached*: The number of threads in the thread cache.",
"editable": true,
"error": false,
"fill": 2,
"grid": {},
"gridPos": {
"h": 7,
"w": 12,
"x": 12,
"y": 14
},
"id": 11,
"legend": {
"alignAsTable": true,
"avg": true,
"current": false,
"max": true,
"min": true,
"rightSide": false,
"show": true,
"sort": "avg",
"sortDesc": true,
"total": false,
"values": true
},
"lines": true,
"linewidth": 2,
"links": [
{
"title": "Tuning information",
"type": "absolute",
"url": "https://dev.mysql.com/doc/refman/5.6/en/server-system-variables.html#sysvar_thread_cache_size"
}
],
"nullPointMode": "null",
"percentage": false,
"pointradius": 5,
"points": false,
"renderer": "flot",
"seriesOverrides": [
{
"alias": "Threads Created",
"fill": 0
}
],
"spaceLength": 10,
"stack": false,
"steppedLine": false,
"targets": [
{
"calculatedInterval": "2m",
"datasourceErrors": {},
"errors": {},
"expr": "mysql_global_variables_thread_cache_size{instance=\"$host\"}",
"format": "time_series",
"interval": "$interval",
"intervalFactor": 1,
"legendFormat": "Thread Cache Size",
"metric": "",
"refId": "B",
"step": 20
},
{
"calculatedInterval": "2m",
"datasourceErrors": {},
"errors": {},
"expr": "mysql_global_status_threads_cached{instance=\"$host\"}",
"format": "time_series",
"interval": "$interval",
"intervalFactor": 1,
"legendFormat": "Threads Cached",
"metric": "",
"refId": "C",
"step": 20
},
{
"calculatedInterval": "2m",
"datasourceErrors": {},
"errors": {},
"expr": "rate(mysql_global_status_threads_created{instance=\"$host\"}[$interval]) or irate(mysql_global_status_threads_created{instance=\"$host\"}[5m])",
"format": "time_series",
"interval": "$interval",
"intervalFactor": 1,
"legendFormat": "Threads Created",
"metric": "",
"refId": "A",
"step": 20
}
],
"thresholds": [],
"timeFrom": null,
"timeShift": null,
"title": "MySQL Thread Cache",
"tooltip": {
"msResolution": false,
"shared": true,
"sort": 0,
"value_type": "individual"
},
"transparent": false,
"type": "graph",
"xaxis": {
"buckets": null,
"mode": "time",
"name": null,
"show": true,
"values": []
},
"yaxes": [
{
"format": "short",
"logBase": 1,
"max": null,
"min": 0,
"show": true
},
{
"format": "short",
"logBase": 1,
"max": null,
"min": 0,
"show": true
}
],
"yaxis": {
"align": false,
"alignLevel": null
}
},
{
"collapsed": false,
"gridPos": {
"h": 1,
"w": 24,
"x": 0,
"y": 21
},
"id": 385,
"panels": [],
"repeat": null,
"title": "Temporary Objects",
"type": "row"
},
{
"aliasColors": {},
"bars": false,
"dashLength": 10,
"dashes": false,
"datasource": "prometheus",
"decimals": 2,
"editable": true,
"error": false,
"fill": 2,
"grid": {},
"gridPos": {
"h": 7,
"w": 12,
"x": 0,
"y": 22
},
"id": 22,
"legend": {
"alignAsTable": true,
"avg": true,
"current": false,
"max": true,
"min": true,
"rightSide": false,
"show": true,
"sort": "avg",
"sortDesc": true,
"total": false,
"values": true
},
"lines": true,
"linewidth": 2,
"links": [],
"nullPointMode": "null",
"percentage": false,
"pointradius": 5,
"points": false,
"renderer": "flot",
"seriesOverrides": [],
"spaceLength": 10,
"stack": false,
"steppedLine": false,
"targets": [
{
"calculatedInterval": "2m",
"datasourceErrors": {},
"errors": {},
"expr": "rate(mysql_global_status_created_tmp_tables{instance=\"$host\"}[$interval]) or irate(mysql_global_status_created_tmp_tables{instance=\"$host\"}[5m])",
"interval": "$interval",
"intervalFactor": 1,
"legendFormat": "Created Tmp Tables",
"metric": "",
"refId": "A",
"step": 20
},
{
"calculatedInterval": "2m",
"datasourceErrors": {},
"errors": {},
"expr": "rate(mysql_global_status_created_tmp_disk_tables{instance=\"$host\"}[$interval]) or irate(mysql_global_status_created_tmp_disk_tables{instance=\"$host\"}[5m])",
"interval": "$interval",
"intervalFactor": 1,
"legendFormat": "Created Tmp Disk Tables",
"metric": "",
"refId": "B",
"step": 20
},
{
"calculatedInterval": "2m",
"datasourceErrors": {},
"errors": {},
"expr": "rate(mysql_global_status_created_tmp_files{instance=\"$host\"}[$interval]) or irate(mysql_global_status_created_tmp_files{instance=\"$host\"}[5m])",
"interval": "$interval",
"intervalFactor": 1,
"legendFormat": "Created Tmp Files",
"metric": "",
"refId": "C",
"step": 20
}
],
"thresholds": [],
"timeFrom": null,
"timeShift": null,
"title": "MySQL Temporary Objects",
"tooltip": {
"msResolution": false,
"shared": true,
"sort": 0,
"value_type": "individual"
},
"type": "graph",
"xaxis": {
"buckets": null,
"mode": "time",
"name": null,
"show": true,
"values": []
},
"yaxes": [
{
"format": "short",
"logBase": 1,
"max": null,
"min": 0,
"show": true
},
{
"format": "short",
"logBase": 1,
"max": null,
"min": 0,
"show": true
}
],
"yaxis": {
"align": false,
"alignLevel": null
}
},
{
"aliasColors": {},
"bars": false,
"dashLength": 10,
"dashes": false,
"datasource": "prometheus",
"decimals": 2,
"description": "**MySQL Select Types**\n\nAs with most relational databases, selecting based on indexes is more efficient than scanning an entire table's data. Here we see the counters for selects not done with indexes.\n\n* ***Select Scan*** is how many queries caused full table scans, in which all the data in the table had to be read and either discarded or returned.\n* ***Select Range*** is how many queries used a range scan, which means MySQL scanned all rows in a given range.\n* ***Select Full Join*** is the number of joins that are not joined on an index, this is usually a huge performance hit.",
"editable": true,
"error": false,
"fill": 2,
"grid": {},
"gridPos": {
"h": 7,
"w": 12,
"x": 12,
"y": 22
},
"height": "250px",
"id": 311,
"legend": {
"alignAsTable": true,
"avg": true,
"current": false,
"hideZero": true,
"max": true,
"min": true,
"rightSide": false,
"show": true,
"sort": "avg",
"sortDesc": true,
"total": false,
"values": true
},
"lines": true,
"linewidth": 2,
"links": [],
"nullPointMode": "null",
"percentage": false,
"pointradius": 5,
"points": false,
"renderer": "flot",
"seriesOverrides": [],
"spaceLength": 10,
"stack": false,
"steppedLine": false,
"targets": [
{
"calculatedInterval": "2m",
"datasourceErrors": {},
"errors": {},
"expr": "rate(mysql_global_status_select_full_join{instance=\"$host\"}[$interval]) or irate(mysql_global_status_select_full_join{instance=\"$host\"}[5m])",
"format": "time_series",
"interval": "$interval",
"intervalFactor": 1,
"legendFormat": "Select Full Join",
"metric": "",
"refId": "A",
"step": 20
},
{
"calculatedInterval": "2m",
"datasourceErrors": {},
"errors": {},
"expr": "rate(mysql_global_status_select_full_range_join{instance=\"$host\"}[$interval]) or irate(mysql_global_status_select_full_range_join{instance=\"$host\"}[5m])",
"format": "time_series",
"interval": "$interval",
"intervalFactor": 1,
"legendFormat": "Select Full Range Join",
"metric": "",
"refId": "B",
"step": 20
},
{
"calculatedInterval": "2m",
"datasourceErrors": {},
"errors": {},
"expr": "rate(mysql_global_status_select_range{instance=\"$host\"}[$interval]) or irate(mysql_global_status_select_range{instance=\"$host\"}[5m])",
"format": "time_series",
"interval": "$interval",
"intervalFactor": 1,
"legendFormat": "Select Range",
"metric": "",
"refId": "C",
"step": 20
},
{
"calculatedInterval": "2m",
"datasourceErrors": {},
"errors": {},
"expr": "rate(mysql_global_status_select_range_check{instance=\"$host\"}[$interval]) or irate(mysql_global_status_select_range_check{instance=\"$host\"}[5m])",
"format": "time_series",
"interval": "$interval",
"intervalFactor": 1,
"legendFormat": "Select Range Check",
"metric": "",
"refId": "D",
"step": 20
},
{
"calculatedInterval": "2m",
"datasourceErrors": {},
"errors": {},
"expr": "rate(mysql_global_status_select_scan{instance=\"$host\"}[$interval]) or irate(mysql_global_status_select_scan{instance=\"$host\"}[5m])",
"format": "time_series",
"interval": "$interval",
"intervalFactor": 1,
"legendFormat": "Select Scan",
"metric": "",
"refId": "E",
"step": 20
}
],
"thresholds": [],
"timeFrom": null,
"timeShift": null,
"title": "MySQL Select Types",
"tooltip": {
"msResolution": false,
"shared": true,
"sort": 0,
"value_type": "individual"
},
"type": "graph",
"xaxis": {
"buckets": null,
"mode": "time",
"name": null,
"show": true,
"values": []
},
"yaxes": [
{
"format": "short",
"logBase": 1,
"max": null,
"min": 0,
"show": true
},
{
"format": "short",
"logBase": 1,
"max": null,
"min": 0,
"show": true
}
],
"yaxis": {
"align": false,
"alignLevel": null
}
},
{
"collapsed": false,
"gridPos": {
"h": 1,
"w": 24,
"x": 0,
"y": 29
},
"id": 386,
"panels": [],
"repeat": null,
"title": "Sorts",
"type": "row"
},
{
"aliasColors": {},
"bars": false,
"dashLength": 10,
"dashes": false,
"datasource": "prometheus",
"decimals": 2,
"description": "**MySQL Sorts**\n\nDue to a query's structure, order, or other requirements, MySQL sorts the rows before returning them. For example, if a table is ordered 1 to 10 but you want the results reversed, MySQL then has to sort the rows to return 10 to 1.\n\nThis graph also shows when sorts had to scan a whole table or a given range of a table in order to return the results and which could not have been sorted via an index.",
"editable": true,
"error": false,
"fill": 2,
"grid": {},
"gridPos": {
"h": 7,
"w": 12,
"x": 0,
"y": 30
},
"id": 30,
"legend": {
"alignAsTable": true,
"avg": true,
"current": false,
"hideZero": true,
"max": true,
"min": true,
"rightSide": false,
"show": true,
"sort": "avg",
"sortDesc": true,
"total": false,
"values": true
},
"lines": true,
"linewidth": 2,
"links": [],
"nullPointMode": "null",
"percentage": false,
"pointradius": 5,
"points": false,
"renderer": "flot",
"seriesOverrides": [],
"spaceLength": 10,
"stack": false,
"steppedLine": false,
"targets": [
{
"calculatedInterval": "2m",
"datasourceErrors": {},
"errors": {},
"expr": "rate(mysql_global_status_sort_rows{instance=\"$host\"}[$interval]) or irate(mysql_global_status_sort_rows{instance=\"$host\"}[5m])",
"format": "time_series",
"interval": "$interval",
"intervalFactor": 1,
"legendFormat": "Sort Rows",
"metric": "",
"refId": "A",
"step": 20
},
{
"calculatedInterval": "2m",
"datasourceErrors": {},
"errors": {},
"expr": "rate(mysql_global_status_sort_range{instance=\"$host\"}[$interval]) or irate(mysql_global_status_sort_range{instance=\"$host\"}[5m])",
"format": "time_series",
"interval": "$interval",
"intervalFactor": 1,
"legendFormat": "Sort Range",
"metric": "",
"refId": "B",
"step": 20
},
{
"calculatedInterval": "2m",
"datasourceErrors": {},
"errors": {},
"expr": "rate(mysql_global_status_sort_merge_passes{instance=\"$host\"}[$interval]) or irate(mysql_global_status_sort_merge_passes{instance=\"$host\"}[5m])",
"format": "time_series",
"interval": "$interval",
"intervalFactor": 1,
"legendFormat": "Sort Merge Passes",
"metric": "",
"refId": "C",
"step": 20
},
{
"calculatedInterval": "2m",
"datasourceErrors": {},
"errors": {},
"expr": "rate(mysql_global_status_sort_scan{instance=\"$host\"}[$interval]) or irate(mysql_global_status_sort_scan{instance=\"$host\"}[5m])",
"format": "time_series",
"interval": "$interval",
"intervalFactor": 1,
"legendFormat": "Sort Scan",
"metric": "",
"refId": "D",
"step": 20
}
],
"thresholds": [],
"timeFrom": null,
"timeShift": null,
"title": "MySQL Sorts",
"tooltip": {
"msResolution": false,
"shared": true,
"sort": 0,
"value_type": "individual"
},
"type": "graph",
"xaxis": {
"buckets": null,
"mode": "time",
"name": null,
"show": true,
"values": []
},
"yaxes": [
{
"format": "short",
"logBase": 1,
"max": null,
"min": 0,
"show": true
},
{
"format": "short",
"logBase": 1,
"max": null,
"min": 0,
"show": true
}
],
"yaxis": {
"align": false,
"alignLevel": null
}
},
{
"aliasColors": {},
"bars": false,
"dashLength": 10,
"dashes": false,
"datasource": "prometheus",
"decimals": 2,
"description": "**MySQL Slow Queries**\n\nSlow queries are defined as queries being slower than the long_query_time setting. For example, if you have long_query_time set to 3, all queries that take longer than 3 seconds to complete will show on this graph.",
"editable": true,
"error": false,
"fill": 2,
"grid": {},
"gridPos": {
"h": 7,
"w": 12,
"x": 12,
"y": 30
},
"id": 48,
"legend": {
"alignAsTable": true,
"avg": true,
"current": false,
"max": true,
"min": true,
"show": true,
"total": false,
"values": true
},
"lines": true,
"linewidth": 2,
"links": [],
"nullPointMode": "null",
"percentage": false,
"pointradius": 5,
"points": false,
"renderer": "flot",
"seriesOverrides": [],
"spaceLength": 10,
"stack": false,
"steppedLine": false,
"targets": [
{
"calculatedInterval": "2m",
"datasourceErrors": {},
"errors": {},
"expr": "rate(mysql_global_status_slow_queries{instance=\"$host\"}[$interval]) or irate(mysql_global_status_slow_queries{instance=\"$host\"}[5m])",
"format": "time_series",
"interval": "$interval",
"intervalFactor": 1,
"legendFormat": "Slow Queries",
"metric": "",
"refId": "A",
"step": 20
}
],
"thresholds": [],
"timeFrom": null,
"timeShift": null,
"title": "MySQL Slow Queries",
"tooltip": {
"msResolution": false,
"shared": true,
"sort": 0,
"value_type": "cumulative"
},
"type": "graph",
"xaxis": {
"buckets": null,
"mode": "time",
"name": null,
"show": true,
"values": []
},
"yaxes": [
{
"format": "short",
"label": "",
"logBase": 1,
"max": null,
"min": 0,
"show": true
},
{
"format": "short",
"label": "",
"logBase": 1,
"max": null,
"min": 0,
"show": true
}
],
"yaxis": {
"align": false,
"alignLevel": null
}
},
{
"collapsed": false,
"gridPos": {
"h": 1,
"w": 24,
"x": 0,
"y": 37
},
"id": 387,
"panels": [],
"repeat": null,
"title": "Aborted",
"type": "row"
},
{
"aliasColors": {},
"bars": false,
"dashLength": 10,
"dashes": false,
"datasource": "prometheus",
"decimals": 2,
"description": "**Aborted Connections**\n\nWhen a given host connects to MySQL and the connection is interrupted in the middle (for example due to bad credentials), MySQL keeps that info in a system table (since 5.6 this table is exposed in performance_schema).\n\nIf the amount of failed requests without a successful connection reaches the value of max_connect_errors, mysqld assumes that something is wrong and blocks the host from further connection.\n\nTo allow connections from that host again, you need to issue the ``FLUSH HOSTS`` statement.",
"editable": true,
"error": false,
"fill": 2,
"grid": {},
"gridPos": {
"h": 7,
"w": 12,
"x": 0,
"y": 38
},
"id": 47,
"legend": {
"alignAsTable": true,
"avg": true,
"current": false,
"max": true,
"min": true,
"show": true,
"sort": "avg",
"sortDesc": true,
"total": false,
"values": true
},
"lines": true,
"linewidth": 2,
"links": [],
"nullPointMode": "null",
"percentage": false,
"pointradius": 5,
"points": false,
"renderer": "flot",
"seriesOverrides": [],
"spaceLength": 10,
"stack": false,
"steppedLine": false,
"targets": [
{
"calculatedInterval": "2m",
"datasourceErrors": {},
"errors": {},
"expr": "rate(mysql_global_status_aborted_connects{instance=\"$host\"}[$interval]) or irate(mysql_global_status_aborted_connects{instance=\"$host\"}[5m])",
"format": "time_series",
"interval": "$interval",
"intervalFactor": 1,
"legendFormat": "Aborted Connects (attempts)",
"metric": "",
"refId": "A",
"step": 20
},
{
"calculatedInterval": "2m",
"datasourceErrors": {},
"errors": {},
"expr": "rate(mysql_global_status_aborted_clients{instance=\"$host\"}[$interval]) or irate(mysql_global_status_aborted_clients{instance=\"$host\"}[5m])",
"format": "time_series",
"interval": "$interval",
"intervalFactor": 1,
"legendFormat": "Aborted Clients (timeout)",
"metric": "",
"refId": "B",
"step": 20,
"target": ""
}
],
"thresholds": [],
"timeFrom": null,
"timeShift": null,
"title": "MySQL Aborted Connections",
"tooltip": {
"msResolution": false,
"shared": true,
"sort": 0,
"value_type": "cumulative"
},
"type": "graph",
"xaxis": {
"buckets": null,
"mode": "time",
"name": null,
"show": true,
"values": []
},
"yaxes": [
{
"format": "short",
"label": "",
"logBase": 1,
"max": null,
"min": 0,
"show": true
},
{
"format": "short",
"label": "",
"logBase": 1,
"max": null,
"min": 0,
"show": true
}
],
"yaxis": {
"align": false,
"alignLevel": null
}
},
{
"aliasColors": {},
"bars": false,
"dashLength": 10,
"dashes": false,
"datasource": "prometheus",
"decimals": 2,
"description": "**Table Locks**\n\nMySQL takes a number of different locks for varying reasons. In this graph we see how many Table level locks MySQL has requested from the storage engine. In the case of InnoDB, many times the locks could actually be row locks as it only takes table level locks in a few specific cases.\n\nIt is most useful to compare Locks Immediate and Locks Waited. If Locks waited is rising, it means you have lock contention. Otherwise, Locks Immediate rising and falling is normal activity.",
"editable": true,
"error": false,
"fill": 2,
"grid": {},
"gridPos": {
"h": 7,
"w": 12,
"x": 12,
"y": 38
},
"id": 32,
"legend": {
"alignAsTable": true,
"avg": true,
"current": false,
"max": true,
"min": true,
"rightSide": false,
"show": true,
"sort": "avg",
"sortDesc": true,
"total": false,
"values": true
},
"lines": true,
"linewidth": 2,
"links": [],
"nullPointMode": "null",
"percentage": false,
"pointradius": 5,
"points": false,
"renderer": "flot",
"seriesOverrides": [],
"spaceLength": 10,
"stack": false,
"steppedLine": false,
"targets": [
{
"calculatedInterval": "2m",
"datasourceErrors": {},
"errors": {},
"expr": "rate(mysql_global_status_table_locks_immediate{instance=\"$host\"}[$interval]) or irate(mysql_global_status_table_locks_immediate{instance=\"$host\"}[5m])",
"format": "time_series",
"interval": "$interval",
"intervalFactor": 1,
"legendFormat": "Table Locks Immediate",
"metric": "",
"refId": "A",
"step": 20
},
{
"calculatedInterval": "2m",
"datasourceErrors": {},
"errors": {},
"expr": "rate(mysql_global_status_table_locks_waited{instance=\"$host\"}[$interval]) or irate(mysql_global_status_table_locks_waited{instance=\"$host\"}[5m])",
"format": "time_series",
"interval": "$interval",
"intervalFactor": 1,
"legendFormat": "Table Locks Waited",
"metric": "",
"refId": "B",
"step": 20
}
],
"thresholds": [],
"timeFrom": null,
"timeShift": null,
"title": "MySQL Table Locks",
"tooltip": {
"msResolution": false,
"shared": true,
"sort": 0,
"value_type": "individual"
},
"type": "graph",
"xaxis": {
"buckets": null,
"mode": "time",
"name": null,
"show": true,
"values": []
},
"yaxes": [
{
"format": "short",
"logBase": 1,
"max": null,
"min": 0,
"show": true
},
{
"format": "short",
"logBase": 1,
"max": null,
"min": 0,
"show": true
}
],
"yaxis": {
"align": false,
"alignLevel": null
}
},
{
"collapsed": false,
"gridPos": {
"h": 1,
"w": 24,
"x": 0,
"y": 45
},
"id": 388,
"panels": [],
"repeat": null,
"title": "Network",
"type": "row"
},
{
"aliasColors": {},
"bars": false,
"dashLength": 10,
"dashes": false,
"datasource": "prometheus",
"decimals": 2,
"description": "**MySQL Network Traffic**\n\nHere we can see how much network traffic is generated by MySQL. Outbound is network traffic sent from MySQL and Inbound is network traffic MySQL has received.",
"editable": true,
"error": false,
"fill": 6,
"grid": {},
"gridPos": {
"h": 7,
"w": 12,
"x": 0,
"y": 46
},
"id": 9,
"legend": {
"alignAsTable": true,
"avg": true,
"current": false,
"max": true,
"min": true,
"rightSide": false,
"show": true,
"sort": "avg",
"sortDesc": true,
"total": false,
"values": true
},
"lines": true,
"linewidth": 2,
"links": [],
"nullPointMode": "null",
"percentage": false,
"pointradius": 5,
"points": false,
"renderer": "flot",
"seriesOverrides": [],
"spaceLength": 10,
"stack": true,
"steppedLine": false,
"targets": [
{
"calculatedInterval": "2m",
"datasourceErrors": {},
"errors": {},
"expr": "rate(mysql_global_status_bytes_received{instance=\"$host\"}[$interval]) or irate(mysql_global_status_bytes_received{instance=\"$host\"}[5m])",
"format": "time_series",
"interval": "$interval",
"intervalFactor": 1,
"legendFormat": "Inbound",
"metric": "",
"refId": "A",
"step": 20
},
{
"calculatedInterval": "2m",
"datasourceErrors": {},
"errors": {},
"expr": "rate(mysql_global_status_bytes_sent{instance=\"$host\"}[$interval]) or irate(mysql_global_status_bytes_sent{instance=\"$host\"}[5m])",
"format": "time_series",
"interval": "$interval",
"intervalFactor": 1,
"legendFormat": "Outbound",
"metric": "",
"refId": "B",
"step": 20
}
],
"thresholds": [],
"timeFrom": null,
"timeShift": null,
"title": "MySQL Network Traffic",
"tooltip": {
"msResolution": false,
"shared": true,
"sort": 0,
"value_type": "individual"
},
"type": "graph",
"xaxis": {
"buckets": null,
"mode": "time",
"name": null,
"show": true,
"values": []
},
"yaxes": [
{
"format": "Bps",
"logBase": 1,
"max": null,
"min": 0,
"show": true
},
{
"format": "none",
"logBase": 1,
"max": null,
"min": 0,
"show": true
}
],
"yaxis": {
"align": false,
"alignLevel": null
}
},
{
"aliasColors": {},
"bars": true,
"dashLength": 10,
"dashes": false,
"datasource": "prometheus",
"decimals": 2,
"description": "**MySQL Network Usage Hourly**\n\nHere we can see how much network traffic is generated by MySQL per hour. You can use the bar graph to compare data sent by MySQL and data received by MySQL.",
"editable": true,
"error": false,
"fill": 6,
"grid": {},
"gridPos": {
"h": 7,
"w": 12,
"x": 12,
"y": 46
},
"height": "250px",
"id": 381,
"legend": {
"alignAsTable": true,
"avg": true,
"current": false,
"max": true,
"min": true,
"rightSide": false,
"show": true,
"sort": "avg",
"sortDesc": true,
"total": false,
"values": true
},
"lines": false,
"linewidth": 2,
"links": [],
"nullPointMode": "null",
"percentage": false,
"pointradius": 5,
"points": false,
"renderer": "flot",
"seriesOverrides": [],
"spaceLength": 10,
"stack": true,
"steppedLine": false,
"targets": [
{
"calculatedInterval": "2m",
"datasourceErrors": {},
"errors": {},
"expr": "increase(mysql_global_status_bytes_received{instance=\"$host\"}[1h])",
"format": "time_series",
"interval": "1h",
"intervalFactor": 1,
"legendFormat": "Received",
"metric": "",
"refId": "A",
"step": 3600
},
{
"calculatedInterval": "2m",
"datasourceErrors": {},
"errors": {},
"expr": "increase(mysql_global_status_bytes_sent{instance=\"$host\"}[1h])",
"format": "time_series",
"interval": "1h",
"intervalFactor": 1,
"legendFormat": "Sent",
"metric": "",
"refId": "B",
"step": 3600
}
],
"thresholds": [],
"timeFrom": "24h",
"timeShift": null,
"title": "MySQL Network Usage Hourly",
"tooltip": {
"msResolution": false,
"shared": true,
"sort": 0,
"value_type": "individual"
},
"type": "graph",
"xaxis": {
"buckets": null,
"mode": "time",
"name": null,
"show": true,
"values": []
},
"yaxes": [
{
"format": "bytes",
"logBase": 1,
"max": null,
"min": 0,
"show": true
},
{
"format": "none",
"logBase": 1,
"max": null,
"min": 0,
"show": true
}
],
"yaxis": {
"align": false,
"alignLevel": null
}
},
{
"collapsed": false,
"gridPos": {
"h": 1,
"w": 24,
"x": 0,
"y": 53
},
"id": 389,
"panels": [],
"repeat": null,
"title": "Memory",
"type": "row"
},
{
"aliasColors": {},
"bars": false,
"dashLength": 10,
"dashes": false,
"datasource": "prometheus",
"decimals": 0,
"description": "***System Memory***: Total Memory for the system.\\\n***InnoDB Buffer Pool Data***: InnoDB maintains a storage area called the buffer pool for caching data and indexes in memory.\\\n***TokuDB Cache Size***: Similar in function to the InnoDB Buffer Pool, TokuDB will allocate 50% of the installed RAM for its own cache.\\\n***Key Buffer Size***: Index blocks for MYISAM tables are buffered and are shared by all threads. key_buffer_size is the size of the buffer used for index blocks.\\\n***Adaptive Hash Index Size***: When InnoDB notices that some index values are being accessed very frequently, it builds a hash index for them in memory on top of B-Tree indexes.\\\n ***Query Cache Size***: The query cache stores the text of a SELECT statement together with the corresponding result that was sent to the client. The query cache has huge scalability problems in that only one thread can do an operation in the query cache at the same time.\\\n***InnoDB Dictionary Size***: The data dictionary is InnoDB ‘s internal catalog of tables. InnoDB stores the data dictionary on disk, and loads entries into memory while the server is running.\\\n***InnoDB Log Buffer Size***: The MySQL InnoDB log buffer allows transactions to run without having to write the log to disk before the transactions commit.",
"editable": true,
"error": false,
"fill": 6,
"grid": {},
"gridPos": {
"h": 7,
"w": 24,
"x": 0,
"y": 54
},
"id": 50,
"legend": {
"alignAsTable": true,
"avg": true,
"current": false,
"hideEmpty": true,
"hideZero": true,
"max": true,
"min": true,
"rightSide": true,
"show": true,
"sort": "avg",
"sortDesc": true,
"total": false,
"values": true
},
"lines": true,
"linewidth": 2,
"links": [
{
"title": "Detailed descriptions about metrics",
"type": "absolute",
"url": "https://www.percona.com/doc/percona-monitoring-and-management/dashboard.mysql-overview.html#mysql-internal-memory-overview"
}
],
"nullPointMode": "null",
"percentage": false,
"pointradius": 5,
"points": false,
"renderer": "flot",
"seriesOverrides": [
{
"alias": "System Memory",
"fill": 0,
"stack": false
}
],
"spaceLength": 10,
"stack": true,
"steppedLine": false,
"targets": [
{
"expr": "node_memory_MemTotal{instance=\"$host\"}",
"format": "time_series",
"intervalFactor": 2,
"legendFormat": "System Memory",
"refId": "G",
"step": 4
},
{
"expr": "mysql_global_status_innodb_page_size{instance=\"$host\"} * on (instance) mysql_global_status_buffer_pool_pages{instance=\"$host\",state=\"data\"}",
"format": "time_series",
"hide": false,
"interval": "$interval",
"intervalFactor": 1,
"legendFormat": "InnoDB Buffer Pool Data",
"refId": "A",
"step": 20
},
{
"expr": "mysql_global_variables_innodb_log_buffer_size{instance=\"$host\"}",
"format": "time_series",
"interval": "$interval",
"intervalFactor": 1,
"legendFormat": "InnoDB Log Buffer Size",
"refId": "D",
"step": 20
},
{
"expr": "mysql_global_variables_innodb_additional_mem_pool_size{instance=\"$host\"}",
"format": "time_series",
"interval": "$interval",
"intervalFactor": 2,
"legendFormat": "InnoDB Additional Memory Pool Size",
"refId": "H",
"step": 40
},
{
"expr": "mysql_global_status_innodb_mem_dictionary{instance=\"$host\"}",
"format": "time_series",
"interval": "$interval",
"intervalFactor": 1,
"legendFormat": "InnoDB Dictionary Size",
"refId": "F",
"step": 20
},
{
"expr": "mysql_global_variables_key_buffer_size{instance=\"$host\"}",
"format": "time_series",
"interval": "$interval",
"intervalFactor": 1,
"legendFormat": "Key Buffer Size",
"refId": "B",
"step": 20
},
{
"expr": "mysql_global_variables_query_cache_size{instance=\"$host\"}",
"format": "time_series",
"interval": "$interval",
"intervalFactor": 1,
"legendFormat": "Query Cache Size",
"refId": "C",
"step": 20
},
{
"expr": "mysql_global_status_innodb_mem_adaptive_hash{instance=\"$host\"}",
"format": "time_series",
"interval": "$interval",
"intervalFactor": 1,
"legendFormat": "Adaptive Hash Index Size",
"refId": "E",
"step": 20
},
{
"expr": "mysql_global_variables_tokudb_cache_size{instance=\"$host\"}",
"format": "time_series",
"interval": "$interval",
"intervalFactor": 1,
"legendFormat": "TokuDB Cache Size",
"refId": "I",
"step": 20
}
],
"thresholds": [],
"timeFrom": null,
"timeShift": null,
"title": "MySQL Internal Memory Overview",
"tooltip": {
"msResolution": false,
"shared": true,
"sort": 0,
"value_type": "individual"
},
"type": "graph",
"xaxis": {
"buckets": null,
"mode": "time",
"name": null,
"show": true,
"values": []
},
"yaxes": [
{
"format": "bytes",
"label": "",
"logBase": 1,
"max": null,
"min": 0,
"show": true
},
{
"format": "short",
"label": null,
"logBase": 1,
"max": null,
"min": null,
"show": true
}
],
"yaxis": {
"align": false,
"alignLevel": null
}
},
{
"collapsed": false,
"gridPos": {
"h": 1,
"w": 24,
"x": 0,
"y": 61
},
"id": 390,
"panels": [],
"repeat": null,
"title": "Command, Handlers, Processes",
"type": "row"
},
{
"aliasColors": {},
"bars": false,
"dashLength": 10,
"dashes": false,
"datasource": "prometheus",
"decimals": 2,
"description": "**Top Command Counters**\n\nThe Com_{{xxx}} statement counter variables indicate the number of times each xxx statement has been executed. There is one status variable for each type of statement. For example, Com_delete and Com_update count [``DELETE``](https://dev.mysql.com/doc/refman/5.7/en/delete.html) and [``UPDATE``](https://dev.mysql.com/doc/refman/5.7/en/update.html) statements, respectively. Com_delete_multi and Com_update_multi are similar but apply to [``DELETE``](https://dev.mysql.com/doc/refman/5.7/en/delete.html) and [``UPDATE``](https://dev.mysql.com/doc/refman/5.7/en/update.html) statements that use multiple-table syntax.",
"editable": true,
"error": false,
"fill": 2,
"grid": {},
"gridPos": {
"h": 7,
"w": 24,
"x": 0,
"y": 62
},
"id": 14,
"legend": {
"alignAsTable": true,
"avg": true,
"current": false,
"hideEmpty": false,
"hideZero": false,
"max": true,
"min": true,
"rightSide": true,
"show": true,
"sort": "avg",
"sortDesc": true,
"total": false,
"values": true
},
"lines": true,
"linewidth": 2,
"links": [
{
"title": "Server Status Variables (Com_xxx)",
"type": "absolute",
"url": "https://dev.mysql.com/doc/refman/5.7/en/server-status-variables.html#statvar_Com_xxx"
}
],
"nullPointMode": "null",
"percentage": false,
"pointradius": 5,
"points": false,
"renderer": "flot",
"seriesOverrides": [],
"spaceLength": 10,
"stack": false,
"steppedLine": false,
"targets": [
{
"calculatedInterval": "2m",
"datasourceErrors": {},
"errors": {},
"expr": "topk(5, rate(mysql_global_status_commands_total{instance=\"$host\"}[$interval])>0) or topk(5, irate(mysql_global_status_commands_total{instance=\"$host\"}[5m])>0)",
"format": "time_series",
"hide": false,
"interval": "$interval",
"intervalFactor": 1,
"legendFormat": "Com_{{ command }}",
"metric": "",
"refId": "B",
"step": 20
}
],
"thresholds": [],
"timeFrom": null,
"timeShift": null,
"title": "Top Command Counters",
"tooltip": {
"msResolution": false,
"shared": true,
"sort": 0,
"value_type": "individual"
},
"type": "graph",
"xaxis": {
"buckets": null,
"mode": "time",
"name": null,
"show": true,
"values": []
},
"yaxes": [
{
"format": "short",
"logBase": 1,
"max": null,
"min": 0,
"show": true
},
{
"format": "short",
"logBase": 1,
"max": null,
"min": 0,
"show": true
}
],
"yaxis": {
"align": false,
"alignLevel": null
}
},
{
"aliasColors": {},
"bars": true,
"dashLength": 10,
"dashes": false,
"datasource": "prometheus",
"decimals": 2,
"description": "**Top Command Counters Hourly**\n\nThe Com_{{xxx}} statement counter variables indicate the number of times each xxx statement has been executed. There is one status variable for each type of statement. For example, Com_delete and Com_update count [``DELETE``](https://dev.mysql.com/doc/refman/5.7/en/delete.html) and [``UPDATE``](https://dev.mysql.com/doc/refman/5.7/en/update.html) statements, respectively. Com_delete_multi and Com_update_multi are similar but apply to [``DELETE``](https://dev.mysql.com/doc/refman/5.7/en/delete.html) and [``UPDATE``](https://dev.mysql.com/doc/refman/5.7/en/update.html) statements that use multiple-table syntax.",
"editable": true,
"error": false,
"fill": 6,
"grid": {},
"gridPos": {
"h": 7,
"w": 24,
"x": 0,
"y": 69
},
"id": 39,
"legend": {
"alignAsTable": true,
"avg": true,
"current": false,
"max": true,
"min": true,
"rightSide": true,
"show": true,
"sort": "avg",
"sortDesc": true,
"total": false,
"values": true
},
"lines": false,
"linewidth": 2,
"links": [
{
"dashboard": "https://dev.mysql.com/doc/refman/5.7/en/server-status-variables.html#statvar_Com_xxx",
"title": "Server Status Variables (Com_xxx)",
"type": "absolute",
"url": "https://dev.mysql.com/doc/refman/5.7/en/server-status-variables.html#statvar_Com_xxx"
}
],
"nullPointMode": "null",
"percentage": false,
"pointradius": 5,
"points": false,
"renderer": "flot",
"seriesOverrides": [],
"spaceLength": 10,
"stack": true,
"steppedLine": false,
"targets": [
{
"calculatedInterval": "2m",
"datasourceErrors": {},
"errors": {},
"expr": "topk(5, increase(mysql_global_status_commands_total{instance=\"$host\"}[1h])>0)",
"format": "time_series",
"interval": "1h",
"intervalFactor": 1,
"legendFormat": "Com_{{ command }}",
"metric": "",
"refId": "A",
"step": 3600
}
],
"thresholds": [],
"timeFrom": "24h",
"timeShift": null,
"title": "Top Command Counters Hourly",
"tooltip": {
"msResolution": false,
"shared": true,
"sort": 0,
"value_type": "individual"
},
"type": "graph",
"xaxis": {
"buckets": null,
"mode": "time",
"name": null,
"show": true,
"values": []
},
"yaxes": [
{
"format": "short",
"logBase": 1,
"max": null,
"min": 0,
"show": true
},
{
"format": "short",
"logBase": 1,
"max": null,
"min": 0,
"show": true
}
],
"yaxis": {
"align": false,
"alignLevel": null
}
},
{
"aliasColors": {},
"bars": false,
"dashLength": 10,
"dashes": false,
"datasource": "prometheus",
"decimals": 2,
"description": "**MySQL Handlers**\n\nHandler statistics are internal statistics on how MySQL is selecting, updating, inserting, and modifying rows, tables, and indexes.\n\nThis is in fact the layer between the Storage Engine and MySQL.\n\n* `read_rnd_next` is incremented when the server performs a full table scan and this is a counter you don't really want to see with a high value.\n* `read_key` is incremented when a read is done with an index.\n* `read_next` is incremented when the storage engine is asked to 'read the next index entry'. A high value means a lot of index scans are being done.",
"editable": true,
"error": false,
"fill": 2,
"grid": {},
"gridPos": {
"h": 7,
"w": 24,
"x": 0,
"y": 76
},
"id": 8,
"legend": {
"alignAsTable": true,
"avg": true,
"current": false,
"hideZero": true,
"max": true,
"min": true,
"rightSide": true,
"show": true,
"sort": "avg",
"sortDesc": true,
"total": false,
"values": true
},
"lines": true,
"linewidth": 2,
"links": [],
"nullPointMode": "null",
"percentage": false,
"pointradius": 5,
"points": false,
"renderer": "flot",
"seriesOverrides": [],
"spaceLength": 10,
"stack": false,
"steppedLine": false,
"targets": [
{
"calculatedInterval": "2m",
"datasourceErrors": {},
"errors": {},
"expr": "rate(mysql_global_status_handlers_total{instance=\"$host\", handler!~\"commit|rollback|savepoint.*|prepare\"}[$interval]) or irate(mysql_global_status_handlers_total{instance=\"$host\", handler!~\"commit|rollback|savepoint.*|prepare\"}[5m])",
"format": "time_series",
"interval": "$interval",
"intervalFactor": 1,
"legendFormat": "{{ handler }}",
"metric": "",
"refId": "J",
"step": 20
}
],
"thresholds": [],
"timeFrom": null,
"timeShift": null,
"title": "MySQL Handlers",
"tooltip": {
"msResolution": false,
"shared": true,
"sort": 0,
"value_type": "individual"
},
"type": "graph",
"xaxis": {
"buckets": null,
"mode": "time",
"name": null,
"show": true,
"values": []
},
"yaxes": [
{
"format": "short",
"logBase": 1,
"max": null,
"min": 0,
"show": true
},
{
"format": "short",
"logBase": 1,
"max": null,
"min": 0,
"show": true
}
],
"yaxis": {
"align": false,
"alignLevel": null
}
},
{
"aliasColors": {},
"bars": false,
"dashLength": 10,
"dashes": false,
"datasource": "prometheus",
"decimals": 2,
"editable": true,
"error": false,
"fill": 2,
"grid": {},
"gridPos": {
"h": 7,
"w": 24,
"x": 0,
"y": 83
},
"id": 28,
"legend": {
"alignAsTable": true,
"avg": true,
"current": false,
"hideZero": true,
"max": true,
"min": true,
"rightSide": true,
"show": true,
"sort": "avg",
"sortDesc": true,
"total": false,
"values": true
},
"lines": true,
"linewidth": 2,
"links": [],
"nullPointMode": "null",
"percentage": false,
"pointradius": 5,
"points": false,
"renderer": "flot",
"seriesOverrides": [],
"spaceLength": 10,
"stack": false,
"steppedLine": false,
"targets": [
{
"calculatedInterval": "2m",
"datasourceErrors": {},
"errors": {},
"expr": "rate(mysql_global_status_handlers_total{instance=\"$host\", handler=~\"commit|rollback|savepoint.*|prepare\"}[$interval]) or irate(mysql_global_status_handlers_total{instance=\"$host\", handler=~\"commit|rollback|savepoint.*|prepare\"}[5m])",
"interval": "$interval",
"intervalFactor": 1,
"legendFormat": "{{ handler }}",
"metric": "",
"refId": "A",
"step": 20
}
],
"thresholds": [],
"timeFrom": null,
"timeShift": null,
"title": "MySQL Transaction Handlers",
"tooltip": {
"msResolution": false,
"shared": true,
"sort": 0,
"value_type": "individual"
},
"type": "graph",
"xaxis": {
"buckets": null,
"mode": "time",
"name": null,
"show": true,
"values": []
},
"yaxes": [
{
"format": "short",
"logBase": 1,
"max": null,
"min": 0,
"show": true
},
{
"format": "short",
"logBase": 1,
"max": null,
"min": 0,
"show": true
}
],
"yaxis": {
"align": false,
"alignLevel": null
}
},
{
"aliasColors": {},
"bars": false,
"dashLength": 10,
"dashes": false,
"datasource": "prometheus",
"decimals": 2,
"editable": true,
"error": false,
"fill": 0,
"grid": {},
"gridPos": {
"h": 7,
"w": 24,
"x": 0,
"y": 90
},
"id": 40,
"legend": {
"alignAsTable": true,
"avg": true,
"current": false,
"hideZero": true,
"max": true,
"min": false,
"rightSide": true,
"show": true,
"sort": "avg",
"sortDesc": true,
"total": false,
"values": true
},
"lines": true,
"linewidth": 2,
"links": [],
"nullPointMode": "null",
"percentage": false,
"pointradius": 5,
"points": false,
"renderer": "flot",
"seriesOverrides": [],
"spaceLength": 10,
"stack": false,
"steppedLine": false,
"targets": [
{
"calculatedInterval": "2m",
"datasourceErrors": {},
"errors": {},
"expr": "mysql_info_schema_threads{instance=\"$host\"}",
"interval": "$interval",
"intervalFactor": 1,
"legendFormat": "{{ state }}",
"metric": "",
"refId": "A",
"step": 20
}
],
"thresholds": [],
"timeFrom": null,
"timeShift": null,
"title": "Process States",
"tooltip": {
"msResolution": false,
"shared": true,
"sort": 0,
"value_type": "individual"
},
"type": "graph",
"xaxis": {
"buckets": null,
"mode": "time",
"name": null,
"show": true,
"values": []
},
"yaxes": [
{
"format": "short",
"logBase": 1,
"max": null,
"min": 0,
"show": true
},
{
"format": "short",
"logBase": 1,
"max": null,
"min": 0,
"show": true
}
],
"yaxis": {
"align": false,
"alignLevel": null
}
},
{
"aliasColors": {},
"bars": true,
"dashLength": 10,
"dashes": false,
"datasource": "prometheus",
"decimals": 2,
"editable": true,
"error": false,
"fill": 6,
"grid": {},
"gridPos": {
"h": 7,
"w": 24,
"x": 0,
"y": 97
},
"id": 49,
"legend": {
"alignAsTable": true,
"avg": true,
"current": false,
"hideZero": true,
"max": true,
"min": false,
"rightSide": true,
"show": true,
"sort": "avg",
"sortDesc": true,
"total": false,
"values": true
},
"lines": false,
"linewidth": 2,
"links": [],
"nullPointMode": "null",
"percentage": false,
"pointradius": 5,
"points": false,
"renderer": "flot",
"seriesOverrides": [],
"spaceLength": 10,
"stack": true,
"steppedLine": false,
"targets": [
{
"calculatedInterval": "2m",
"datasourceErrors": {},
"errors": {},
"expr": "topk(5, avg_over_time(mysql_info_schema_threads{instance=\"$host\"}[1h]))",
"interval": "1h",
"intervalFactor": 1,
"legendFormat": "{{ state }}",
"metric": "",
"refId": "A",
"step": 3600
}
],
"thresholds": [],
"timeFrom": "24h",
"timeShift": null,
"title": "Top Process States Hourly",
"tooltip": {
"msResolution": false,
"shared": true,
"sort": 0,
"value_type": "individual"
},
"type": "graph",
"xaxis": {
"buckets": null,
"mode": "time",
"name": null,
"show": true,
"values": []
},
"yaxes": [
{
"format": "short",
"logBase": 1,
"max": null,
"min": 0,
"show": true
},
{
"format": "short",
"logBase": 1,
"max": null,
"min": 0,
"show": true
}
],
"yaxis": {
"align": false,
"alignLevel": null
}
},
{
"collapsed": false,
"gridPos": {
"h": 1,
"w": 24,
"x": 0,
"y": 104
},
"id": 391,
"panels": [],
"repeat": null,
"title": "Query Cache",
"type": "row"
},
{
"aliasColors": {},
"bars": false,
"dashLength": 10,
"dashes": false,
"datasource": "prometheus",
"decimals": 2,
"description": "**MySQL Query Cache Memory**\n\nThe query cache has huge scalability problems in that only one thread can do an operation in the query cache at the same time. This serialization is true not only for SELECTs, but also for INSERT/UPDATE/DELETE.\n\nThis also means that the larger the `query_cache_size` is set to, the slower those operations become. In concurrent environments, the MySQL Query Cache quickly becomes a contention point, decreasing performance. MariaDB and AWS Aurora have done work to try and eliminate the query cache contention in their flavors of MySQL, while MySQL 8.0 has eliminated the query cache feature.\n\nThe recommended settings for most environments is to set:\n ``query_cache_type=0``\n ``query_cache_size=0``\n\nNote that while you can dynamically change these values, to completely remove the contention point you have to restart the database.",
"editable": true,
"error": false,
"fill": 2,
"grid": {},
"gridPos": {
"h": 7,
"w": 12,
"x": 0,
"y": 105
},
"id": 46,
"legend": {
"alignAsTable": true,
"avg": true,
"current": false,
"max": true,
"min": true,
"rightSide": false,
"show": true,
"sort": "avg",
"sortDesc": true,
"total": false,
"values": true
},
"lines": true,
"linewidth": 2,
"links": [],
"nullPointMode": "null",
"percentage": false,
"pointradius": 5,
"points": false,
"renderer": "flot",
"seriesOverrides": [],
"spaceLength": 10,
"stack": false,
"steppedLine": false,
"targets": [
{
"calculatedInterval": "2m",
"datasourceErrors": {},
"errors": {},
"expr": "mysql_global_status_qcache_free_memory{instance=\"$host\"}",
"format": "time_series",
"interval": "$interval",
"intervalFactor": 1,
"legendFormat": "Free Memory",
"metric": "",
"refId": "F",
"step": 20
},
{
"calculatedInterval": "2m",
"datasourceErrors": {},
"errors": {},
"expr": "mysql_global_variables_query_cache_size{instance=\"$host\"}",
"format": "time_series",
"interval": "$interval",
"intervalFactor": 1,
"legendFormat": "Query Cache Size",
"metric": "",
"refId": "E",
"step": 20
}
],
"thresholds": [],
"timeFrom": null,
"timeShift": null,
"title": "MySQL Query Cache Memory",
"tooltip": {
"msResolution": false,
"shared": true,
"sort": 0,
"value_type": "individual"
},
"type": "graph",
"xaxis": {
"buckets": null,
"mode": "time",
"name": null,
"show": true,
"values": []
},
"yaxes": [
{
"format": "bytes",
"logBase": 1,
"max": null,
"min": 0,
"show": true
},
{
"format": "short",
"logBase": 1,
"max": null,
"min": 0,
"show": true
}
],
"yaxis": {
"align": false,
"alignLevel": null
}
},
{
"aliasColors": {},
"bars": false,
"dashLength": 10,
"dashes": false,
"datasource": "prometheus",
"decimals": 2,
"description": "**MySQL Query Cache Activity**\n\nThe query cache has huge scalability problems in that only one thread can do an operation in the query cache at the same time. This serialization is true not only for SELECTs, but also for INSERT/UPDATE/DELETE.\n\nThis also means that the larger the `query_cache_size` is set to, the slower those operations become. In concurrent environments, the MySQL Query Cache quickly becomes a contention point, decreasing performance. MariaDB and AWS Aurora have done work to try and eliminate the query cache contention in their flavors of MySQL, while MySQL 8.0 has eliminated the query cache feature.\n\nThe recommended settings for most environments is to set:\n``query_cache_type=0``\n``query_cache_size=0``\n\nNote that while you can dynamically change these values, to completely remove the contention point you have to restart the database.",
"editable": true,
"error": false,
"fill": 2,
"grid": {},
"gridPos": {
"h": 7,
"w": 12,
"x": 12,
"y": 105
},
"height": "",
"id": 45,
"legend": {
"alignAsTable": true,
"avg": true,
"current": false,
"max": true,
"min": true,
"rightSide": false,
"show": true,
"sort": "avg",
"sortDesc": true,
"total": false,
"values": true
},
"lines": true,
"linewidth": 2,
"links": [],
"nullPointMode": "null",
"percentage": false,
"pointradius": 5,
"points": false,
"renderer": "flot",
"seriesOverrides": [],
"spaceLength": 10,
"stack": false,
"steppedLine": false,
"targets": [
{
"calculatedInterval": "2m",
"datasourceErrors": {},
"errors": {},
"expr": "rate(mysql_global_status_qcache_hits{instance=\"$host\"}[$interval]) or irate(mysql_global_status_qcache_hits{instance=\"$host\"}[5m])",
"format": "time_series",
"interval": "$interval",
"intervalFactor": 1,
"legendFormat": "Hits",
"metric": "",
"refId": "B",
"step": 20
},
{
"calculatedInterval": "2m",
"datasourceErrors": {},
"errors": {},
"expr": "rate(mysql_global_status_qcache_inserts{instance=\"$host\"}[$interval]) or irate(mysql_global_status_qcache_inserts{instance=\"$host\"}[5m])",
"format": "time_series",
"interval": "$interval",
"intervalFactor": 1,
"legendFormat": "Inserts",
"metric": "",
"refId": "C",
"step": 20
},
{
"calculatedInterval": "2m",
"datasourceErrors": {},
"errors": {},
"expr": "rate(mysql_global_status_qcache_not_cached{instance=\"$host\"}[$interval]) or irate(mysql_global_status_qcache_not_cached{instance=\"$host\"}[5m])",
"format": "time_series",
"interval": "$interval",
"intervalFactor": 1,
"legendFormat": "Not Cached",
"metric": "",
"refId": "D",
"step": 20
},
{
"calculatedInterval": "2m",
"datasourceErrors": {},
"errors": {},
"expr": "rate(mysql_global_status_qcache_lowmem_prunes{instance=\"$host\"}[$interval]) or irate(mysql_global_status_qcache_lowmem_prunes{instance=\"$host\"}[5m])",
"format": "time_series",
"interval": "$interval",
"intervalFactor": 1,
"legendFormat": "Prunes",
"metric": "",
"refId": "F",
"step": 20
},
{
"calculatedInterval": "2m",
"datasourceErrors": {},
"errors": {},
"expr": "mysql_global_status_qcache_queries_in_cache{instance=\"$host\"}",
"format": "time_series",
"interval": "$interval",
"intervalFactor": 1,
"legendFormat": "Queries in Cache",
"metric": "",
"refId": "E",
"step": 20
}
],
"thresholds": [],
"timeFrom": null,
"timeShift": null,
"title": "MySQL Query Cache Activity",
"tooltip": {
"msResolution": false,
"shared": true,
"sort": 0,
"value_type": "individual"
},
"type": "graph",
"xaxis": {
"buckets": null,
"mode": "time",
"name": null,
"show": true,
"values": []
},
"yaxes": [
{
"format": "short",
"logBase": 1,
"max": null,
"min": 0,
"show": true
},
{
"format": "short",
"logBase": 1,
"max": null,
"min": 0,
"show": true
}
],
"yaxis": {
"align": false,
"alignLevel": null
}
},
{
"collapsed": false,
"gridPos": {
"h": 1,
"w": 24,
"x": 0,
"y": 112
},
"id": 392,
"panels": [],
"repeat": null,
"title": "Files and Tables",
"type": "row"
},
{
"aliasColors": {},
"bars": false,
"dashLength": 10,
"dashes": false,
"datasource": "prometheus",
"decimals": 2,
"editable": true,
"error": false,
"fill": 2,
"grid": {},
"gridPos": {
"h": 7,
"w": 12,
"x": 0,
"y": 113
},
"id": 43,
"legend": {
"alignAsTable": true,
"avg": true,
"current": false,
"max": true,
"min": true,
"rightSide": false,
"show": true,
"total": false,
"values": true
},
"lines": true,
"linewidth": 2,
"links": [],
"nullPointMode": "null",
"percentage": false,
"pointradius": 5,
"points": false,
"renderer": "flot",
"seriesOverrides": [],
"spaceLength": 10,
"stack": false,
"steppedLine": false,
"targets": [
{
"calculatedInterval": "2m",
"datasourceErrors": {},
"errors": {},
"expr": "rate(mysql_global_status_opened_files{instance=\"$host\"}[$interval]) or irate(mysql_global_status_opened_files{instance=\"$host\"}[5m])",
"interval": "$interval",
"intervalFactor": 1,
"legendFormat": "Openings",
"metric": "",
"refId": "A",
"step": 20
}
],
"thresholds": [],
"timeFrom": null,
"timeShift": null,
"title": "MySQL File Openings",
"tooltip": {
"msResolution": false,
"shared": true,
"sort": 0,
"value_type": "individual"
},
"type": "graph",
"xaxis": {
"buckets": null,
"mode": "time",
"name": null,
"show": true,
"values": []
},
"yaxes": [
{
"format": "short",
"logBase": 1,
"max": null,
"min": 0,
"show": true
},
{
"format": "short",
"logBase": 1,
"max": null,
"min": 0,
"show": true
}
],
"yaxis": {
"align": false,
"alignLevel": null
}
},
{
"aliasColors": {},
"bars": false,
"dashLength": 10,
"dashes": false,
"datasource": "prometheus",
"decimals": 2,
"editable": true,
"error": false,
"fill": 2,
"grid": {},
"gridPos": {
"h": 7,
"w": 12,
"x": 12,
"y": 113
},
"id": 41,
"legend": {
"alignAsTable": true,
"avg": true,
"current": false,
"max": true,
"min": true,
"rightSide": false,
"show": true,
"sortDesc": true,
"total": false,
"values": true
},
"lines": true,
"linewidth": 2,
"links": [],
"nullPointMode": "null",
"percentage": false,
"pointradius": 5,
"points": false,
"renderer": "flot",
"seriesOverrides": [],
"spaceLength": 10,
"stack": false,
"steppedLine": false,
"targets": [
{
"calculatedInterval": "2m",
"datasourceErrors": {},
"errors": {},
"expr": "mysql_global_status_open_files{instance=\"$host\"}",
"interval": "$interval",
"intervalFactor": 1,
"legendFormat": "Open Files",
"metric": "",
"refId": "A",
"step": 20
},
{
"calculatedInterval": "2m",
"datasourceErrors": {},
"errors": {},
"expr": "mysql_global_variables_open_files_limit{instance=\"$host\"}",
"interval": "$interval",
"intervalFactor": 1,
"legendFormat": "Open Files Limit",
"metric": "",
"refId": "D",
"step": 20
},
{
"expr": "mysql_global_status_innodb_num_open_files{instance=\"$host\"}",
"interval": "$interval",
"intervalFactor": 1,
"legendFormat": "InnoDB Open Files",
"refId": "B",
"step": 20
}
],
"thresholds": [],
"timeFrom": null,
"timeShift": null,
"title": "MySQL Open Files",
"tooltip": {
"msResolution": false,
"shared": true,
"sort": 0,
"value_type": "individual"
},
"type": "graph",
"xaxis": {
"buckets": null,
"mode": "time",
"name": null,
"show": true,
"values": []
},
"yaxes": [
{
"format": "short",
"logBase": 1,
"max": null,
"min": 0,
"show": true
},
{
"format": "short",
"logBase": 1,
"max": null,
"min": 0,
"show": true
}
],
"yaxis": {
"align": false,
"alignLevel": null
}
},
{
"collapsed": false,
"gridPos": {
"h": 1,
"w": 24,
"x": 0,
"y": 120
},
"id": 393,
"panels": [],
"repeat": null,
"title": "Table Openings",
"type": "row"
},
{
"aliasColors": {},
"bars": false,
"dashLength": 10,
"dashes": false,
"datasource": "prometheus",
"decimals": 2,
"description": "**MySQL Table Open Cache Status**\n\nThe recommendation is to set the `table_open_cache_instances` to a loose correlation to virtual CPUs, keeping in mind that more instances means the cache is split more times. If you have a cache set to 500 but it has 10 instances, each cache will only have 50 cached.\n\nThe `table_definition_cache` and `table_open_cache` can be left as default as they are auto-sized MySQL 5.6 and above (ie: do not set them to any value).",
"editable": true,
"error": false,
"fill": 2,
"grid": {},
"gridPos": {
"h": 7,
"w": 12,
"x": 0,
"y": 121
},
"id": 44,
"legend": {
"alignAsTable": true,
"avg": true,
"current": false,
"max": true,
"min": true,
"rightSide": false,
"show": true,
"sort": "avg",
"sortDesc": true,
"total": false,
"values": true
},
"lines": true,
"linewidth": 2,
"links": [
{
"title": "Server Status Variables (table_open_cache)",
"type": "absolute",
"url": "http://dev.mysql.com/doc/refman/5.6/en/server-system-variables.html#sysvar_table_open_cache"
}
],
"nullPointMode": "null",
"percentage": false,
"pointradius": 5,
"points": false,
"renderer": "flot",
"seriesOverrides": [
{
"alias": "Table Open Cache Hit Ratio",
"yaxis": 2
}
],
"spaceLength": 10,
"stack": false,
"steppedLine": false,
"targets": [
{
"calculatedInterval": "2m",
"datasourceErrors": {},
"errors": {},
"expr": "rate(mysql_global_status_opened_tables{instance=\"$host\"}[$interval]) or irate(mysql_global_status_opened_tables{instance=\"$host\"}[5m])",
"format": "time_series",
"interval": "$interval",
"intervalFactor": 1,
"legendFormat": "Openings",
"metric": "",
"refId": "A",
"step": 20
},
{
"expr": "rate(mysql_global_status_table_open_cache_hits{instance=\"$host\"}[$interval]) or irate(mysql_global_status_table_open_cache_hits{instance=\"$host\"}[5m])",
"format": "time_series",
"interval": "$interval",
"intervalFactor": 1,
"legendFormat": "Hits",
"refId": "B",
"step": 20
},
{
"expr": "rate(mysql_global_status_table_open_cache_misses{instance=\"$host\"}[$interval]) or irate(mysql_global_status_table_open_cache_misses{instance=\"$host\"}[5m])",
"format": "time_series",
"interval": "$interval",
"intervalFactor": 1,
"legendFormat": "Misses",
"refId": "C",
"step": 20
},
{
"expr": "rate(mysql_global_status_table_open_cache_overflows{instance=\"$host\"}[$interval]) or irate(mysql_global_status_table_open_cache_overflows{instance=\"$host\"}[5m])",
"format": "time_series",
"interval": "$interval",
"intervalFactor": 1,
"legendFormat": "Misses due to Overflows",
"refId": "D",
"step": 20
},
{
"expr": "(rate(mysql_global_status_table_open_cache_hits{instance=\"$host\"}[$interval]) or irate(mysql_global_status_table_open_cache_hits{instance=\"$host\"}[5m]))/((rate(mysql_global_status_table_open_cache_hits{instance=\"$host\"}[$interval]) or irate(mysql_global_status_table_open_cache_hits{instance=\"$host\"}[5m]))+(rate(mysql_global_status_table_open_cache_misses{instance=\"$host\"}[$interval]) or irate(mysql_global_status_table_open_cache_misses{instance=\"$host\"}[5m])))",
"format": "time_series",
"interval": "$interval",
"intervalFactor": 1,
"legendFormat": "Table Open Cache Hit Ratio",
"refId": "E",
"step": 20
}
],
"thresholds": [],
"timeFrom": null,
"timeShift": null,
"title": "MySQL Table Open Cache Status",
"tooltip": {
"msResolution": false,
"shared": true,
"sort": 0,
"value_type": "individual"
},
"type": "graph",
"xaxis": {
"buckets": null,
"mode": "time",
"name": null,
"show": true,
"values": []
},
"yaxes": [
{
"format": "short",
"logBase": 1,
"max": null,
"min": 0,
"show": true
},
{
"format": "percentunit",
"logBase": 1,
"max": null,
"min": 0,
"show": true
}
],
"yaxis": {
"align": false,
"alignLevel": null
}
},
{
"aliasColors": {},
"bars": false,
"dashLength": 10,
"dashes": false,
"datasource": "prometheus",
"decimals": 2,
"description": "**MySQL Open Tables**\n\nThe recommendation is to set the `table_open_cache_instances` to a loose correlation to virtual CPUs, keeping in mind that more instances means the cache is split more times. If you have a cache set to 500 but it has 10 instances, each cache will only have 50 cached.\n\nThe `table_definition_cache` and `table_open_cache` can be left as default as they are auto-sized MySQL 5.6 and above (ie: do not set them to any value).",
"editable": true,
"error": false,
"fill": 2,
"grid": {},
"gridPos": {
"h": 7,
"w": 12,
"x": 12,
"y": 121
},
"id": 42,
"legend": {
"alignAsTable": true,
"avg": true,
"current": false,
"max": true,
"min": true,
"rightSide": false,
"show": true,
"sort": "avg",
"sortDesc": true,
"total": false,
"values": true
},
"lines": true,
"linewidth": 2,
"links": [
{
"title": "Server Status Variables (table_open_cache)",
"type": "absolute",
"url": "http://dev.mysql.com/doc/refman/5.6/en/server-system-variables.html#sysvar_table_open_cache"
}
],
"nullPointMode": "null",
"percentage": false,
"pointradius": 5,
"points": false,
"renderer": "flot",
"seriesOverrides": [],
"spaceLength": 10,
"stack": false,
"steppedLine": false,
"targets": [
{
"calculatedInterval": "2m",
"datasourceErrors": {},
"errors": {},
"expr": "mysql_global_status_open_tables{instance=\"$host\"}",
"format": "time_series",
"interval": "$interval",
"intervalFactor": 1,
"legendFormat": "Open Tables",
"metric": "",
"refId": "B",
"step": 20
},
{
"calculatedInterval": "2m",
"datasourceErrors": {},
"errors": {},
"expr": "mysql_global_variables_table_open_cache{instance=\"$host\"}",
"format": "time_series",
"interval": "$interval",
"intervalFactor": 1,
"legendFormat": "Table Open Cache",
"metric": "",
"refId": "C",
"step": 20
}
],
"thresholds": [],
"timeFrom": null,
"timeShift": null,
"title": "MySQL Open Tables",
"tooltip": {
"msResolution": false,
"shared": true,
"sort": 0,
"value_type": "individual"
},
"type": "graph",
"xaxis": {
"buckets": null,
"mode": "time",
"name": null,
"show": true,
"values": []
},
"yaxes": [
{
"format": "short",
"logBase": 1,
"max": null,
"min": 0,
"show": true
},
{
"format": "short",
"logBase": 1,
"max": null,
"min": 0,
"show": true
}
],
"yaxis": {
"align": false,
"alignLevel": null
}
},
{
"collapsed": false,
"gridPos": {
"h": 1,
"w": 24,
"x": 0,
"y": 128
},
"id": 394,
"panels": [],
"repeat": null,
"title": "MySQL Table Definition Cache",
"type": "row"
},
{
"aliasColors": {},
"bars": false,
"dashLength": 10,
"dashes": false,
"datasource": "prometheus",
"decimals": 2,
"description": "**MySQL Table Definition Cache**\n\nThe recommendation is to set the `table_open_cache_instances` to a loose correlation to virtual CPUs, keeping in mind that more instances means the cache is split more times. If you have a cache set to 500 but it has 10 instances, each cache will only have 50 cached.\n\nThe `table_definition_cache` and `table_open_cache` can be left as default as they are auto-sized MySQL 5.6 and above (ie: do not set them to any value).",
"editable": true,
"error": false,
"fill": 2,
"grid": {},
"gridPos": {
"h": 7,
"w": 24,
"x": 0,
"y": 129
},
"id": 54,
"legend": {
"alignAsTable": true,
"avg": true,
"current": false,
"max": true,
"min": true,
"rightSide": false,
"show": true,
"sort": "avg",
"sortDesc": true,
"total": false,
"values": true
},
"lines": true,
"linewidth": 2,
"links": [
{
"title": "Server Status Variables (table_open_cache)",
"type": "absolute",
"url": "http://dev.mysql.com/doc/refman/5.6/en/server-system-variables.html#sysvar_table_open_cache"
}
],
"nullPointMode": "null",
"percentage": false,
"pointradius": 5,
"points": false,
"renderer": "flot",
"seriesOverrides": [
{
"alias": "Opened Table Definitions",
"yaxis": 2
}
],
"spaceLength": 10,
"stack": false,
"steppedLine": false,
"targets": [
{
"calculatedInterval": "2m",
"datasourceErrors": {},
"errors": {},
"expr": "mysql_global_status_open_table_definitions{instance=\"$host\"}",
"format": "time_series",
"interval": "$interval",
"intervalFactor": 1,
"legendFormat": "Open Table Definitions",
"metric": "",
"refId": "B",
"step": 20
},
{
"calculatedInterval": "2m",
"datasourceErrors": {},
"errors": {},
"expr": "mysql_global_variables_table_definition_cache{instance=\"$host\"}",
"format": "time_series",
"interval": "$interval",
"intervalFactor": 1,
"legendFormat": "Table Definitions Cache Size",
"metric": "",
"refId": "C",
"step": 20
},
{
"expr": "rate(mysql_global_status_opened_table_definitions{instance=\"$host\"}[$interval]) or irate(mysql_global_status_opened_table_definitions{instance=\"$host\"}[5m])",
"format": "time_series",
"interval": "$interval",
"intervalFactor": 1,
"legendFormat": "Opened Table Definitions",
"refId": "A",
"step": 20
}
],
"thresholds": [],
"timeFrom": null,
"timeShift": null,
"title": "MySQL Table Definition Cache",
"tooltip": {
"msResolution": false,
"shared": true,
"sort": 0,
"value_type": "individual"
},
"type": "graph",
"xaxis": {
"buckets": null,
"mode": "time",
"name": null,
"show": true,
"values": []
},
"yaxes": [
{
"format": "short",
"logBase": 1,
"max": null,
"min": 0,
"show": true
},
{
"format": "short",
"logBase": 1,
"max": null,
"min": 0,
"show": true
}
],
"yaxis": {
"align": false,
"alignLevel": null
}
},
{
"collapsed": false,
"gridPos": {
"h": 1,
"w": 24,
"x": 0,
"y": 136
},
"id": 395,
"panels": [],
"repeat": null,
"title": "System Charts",
"type": "row"
},
{
"aliasColors": {},
"bars": false,
"dashLength": 10,
"dashes": false,
"datasource": "prometheus",
"decimals": null,
"editable": true,
"error": false,
"fill": 2,
"grid": {},
"gridPos": {
"h": 7,
"w": 8,
"x": 0,
"y": 137
},
"id": 31,
"legend": {
"alignAsTable": false,
"avg": true,
"current": false,
"hideEmpty": false,
"max": false,
"min": false,
"rightSide": false,
"show": true,
"sort": "avg",
"sortDesc": true,
"total": false,
"values": true
},
"lines": true,
"linewidth": 2,
"links": [],
"nullPointMode": "null",
"percentage": false,
"pointradius": 5,
"points": false,
"renderer": "flot",
"seriesOverrides": [],
"spaceLength": 10,
"stack": false,
"steppedLine": false,
"targets": [
{
"calculatedInterval": "2s",
"datasourceErrors": {},
"errors": {},
"expr": "rate(node_vmstat_pgpgin{instance=\"$host\"}[$interval]) * 1024 or irate(node_vmstat_pgpgin{instance=\"$host\"}[5m]) * 1024",
"format": "time_series",
"interval": "$interval",
"intervalFactor": 1,
"legendFormat": "Page In",
"metric": "",
"refId": "A",
"step": 20,
"target": ""
},
{
"calculatedInterval": "2s",
"datasourceErrors": {},
"errors": {},
"expr": "rate(node_vmstat_pgpgout{instance=\"$host\"}[$interval]) * 1024 or irate(node_vmstat_pgpgout{instance=\"$host\"}[5m]) * 1024",
"format": "time_series",
"interval": "$interval",
"intervalFactor": 1,
"legendFormat": "Page Out",
"metric": "",
"refId": "B",
"step": 20,
"target": ""
}
],
"thresholds": [],
"timeFrom": null,
"timeShift": null,
"title": "I/O Activity",
"tooltip": {
"msResolution": false,
"shared": true,
"sort": 0,
"value_type": "individual"
},
"transparent": false,
"type": "graph",
"xaxis": {
"buckets": null,
"mode": "time",
"name": null,
"show": true,
"values": []
},
"yaxes": [
{
"format": "Bps",
"label": "",
"logBase": 1,
"max": null,
"min": 0,
"show": true
},
{
"format": "bytes",
"logBase": 1,
"max": null,
"min": 0,
"show": true
}
],
"yaxis": {
"align": false,
"alignLevel": null
}
},
{
"aliasColors": {},
"bars": false,
"dashLength": 10,
"dashes": false,
"datasource": "prometheus",
"decimals": null,
"editable": true,
"error": false,
"fill": 6,
"grid": {},
"gridPos": {
"h": 7,
"w": 8,
"x": 8,
"y": 137
},
"height": "250px",
"id": 37,
"legend": {
"alignAsTable": false,
"avg": true,
"current": false,
"hideEmpty": false,
"max": false,
"min": false,
"rightSide": false,
"show": true,
"sort": "avg",
"sortDesc": true,
"total": false,
"values": true
},
"lines": true,
"linewidth": 2,
"links": [],
"nullPointMode": "null",
"percentage": false,
"pointradius": 5,
"points": false,
"renderer": "flot",
"seriesOverrides": [],
"spaceLength": 10,
"stack": true,
"steppedLine": false,
"targets": [
{
"calculatedInterval": "2s",
"datasourceErrors": {},
"errors": {},
"expr": "node_memory_MemTotal{instance=\"$host\"} - (node_memory_MemFree{instance=\"$host\"} + node_memory_Buffers{instance=\"$host\"} + node_memory_Cached{instance=\"$host\"})",
"interval": "$interval",
"intervalFactor": 1,
"legendFormat": "Used",
"metric": "",
"refId": "A",
"step": 20,
"target": ""
},
{
"calculatedInterval": "2s",
"datasourceErrors": {},
"errors": {},
"expr": "node_memory_MemFree{instance=\"$host\"}",
"interval": "$interval",
"intervalFactor": 1,
"legendFormat": "Free",
"metric": "",
"refId": "B",
"step": 20,
"target": ""
},
{
"calculatedInterval": "2s",
"datasourceErrors": {},
"errors": {},
"expr": "node_memory_Buffers{instance=\"$host\"}",
"interval": "$interval",
"intervalFactor": 1,
"legendFormat": "Buffers",
"metric": "",
"refId": "D",
"step": 20,
"target": ""
},
{
"calculatedInterval": "2s",
"datasourceErrors": {},
"errors": {},
"expr": "node_memory_Cached{instance=\"$host\"}",
"interval": "$interval",
"intervalFactor": 1,
"legendFormat": "Cached",
"metric": "",
"refId": "E",
"step": 20,
"target": ""
}
],
"thresholds": [],
"timeFrom": null,
"timeShift": null,
"title": "Memory Distribution",
"tooltip": {
"msResolution": false,
"shared": true,
"sort": 0,
"value_type": "individual"
},
"transparent": false,
"type": "graph",
"xaxis": {
"buckets": null,
"mode": "time",
"name": null,
"show": true,
"values": []
},
"yaxes": [
{
"format": "bytes",
"label": "",
"logBase": 1,
"max": null,
"min": 0,
"show": true
},
{
"format": "bytes",
"logBase": 1,
"max": null,
"min": 0,
"show": true
}
],
"yaxis": {
"align": false,
"alignLevel": null
}
},
{
"aliasColors": {
"Load 1m": "#58140C",
"Max Core Utilization": "#bf1b00",
"iowait": "#e24d42",
"nice": "#1f78c1",
"softirq": "#806eb7",
"system": "#eab839",
"user": "#508642"
},
"bars": false,
"dashLength": 10,
"dashes": false,
"datasource": "prometheus",
"decimals": null,
"editable": true,
"error": false,
"fill": 6,
"grid": {},
"gridPos": {
"h": 7,
"w": 8,
"x": 16,
"y": 137
},
"height": "",
"id": 2,
"legend": {
"alignAsTable": false,
"avg": true,
"current": false,
"hideEmpty": true,
"hideZero": true,
"max": false,
"min": false,
"rightSide": false,
"show": true,
"sort": "avg",
"sortDesc": true,
"total": false,
"values": true
},
"lines": true,
"linewidth": 2,
"links": [],
"nullPointMode": "null",
"percentage": false,
"pointradius": 5,
"points": false,
"renderer": "flot",
"seriesOverrides": [
{
"alias": "Max Core Utilization",
"lines": false,
"pointradius": 1,
"points": true,
"stack": false
},
{
"alias": "Load 1m",
"color": "#58140C",
"fill": 2,
"stack": false,
"yaxis": 2
}
],
"spaceLength": 10,
"stack": true,
"steppedLine": false,
"targets": [
{
"calculatedInterval": "2s",
"datasourceErrors": {},
"errors": {},
"expr": "clamp_max(((avg by (mode) ( (clamp_max(rate(node_cpu{instance=\"$host\",mode!=\"idle\"}[$interval]),1)) or (clamp_max(irate(node_cpu{instance=\"$host\",mode!=\"idle\"}[5m]),1)) ))*100 or (avg_over_time(node_cpu_average{instance=~\"$host\", mode!=\"total\", mode!=\"idle\"}[$interval]) or avg_over_time(node_cpu_average{instance=~\"$host\", mode!=\"total\", mode!=\"idle\"}[5m]))),100)",
"format": "time_series",
"hide": false,
"interval": "$interval",
"intervalFactor": 1,
"legendFormat": "{{ mode }}",
"metric": "",
"refId": "A",
"step": 20
},
{
"expr": "clamp_max(max by () (sum by (cpu) ( (clamp_max(rate(node_cpu{instance=\"$host\",mode!=\"idle\",mode!=\"iowait\"}[$interval]),1)) or (clamp_max(irate(node_cpu{instance=\"$host\",mode!=\"idle\",mode!=\"iowait\"}[5m]),1)) ))*100,100)",
"format": "time_series",
"hide": true,
"interval": "$interval",
"intervalFactor": 1,
"legendFormat": "Max Core Utilization",
"refId": "B",
"step": 20
},
{
"expr": "node_load1{instance=\"$host\"}",
"format": "time_series",
"hide": false,
"intervalFactor": 2,
"legendFormat": "Load 1m",
"refId": "C"
}
],
"thresholds": [],
"timeFrom": null,
"timeShift": null,
"title": "CPU Usage / Load",
"tooltip": {
"msResolution": false,
"shared": true,
"sort": 0,
"value_type": "individual"
},
"type": "graph",
"xaxis": {
"buckets": null,
"mode": "time",
"name": null,
"show": true,
"values": []
},
"yaxes": [
{
"decimals": 1,
"format": "percent",
"label": "",
"logBase": 1,
"max": 100,
"min": 0,
"show": true
},
{
"format": "none",
"logBase": 1,
"max": null,
"min": 0,
"show": true
}
],
"yaxis": {
"align": false,
"alignLevel": null
}
},
{
"aliasColors": {},
"bars": false,
"dashLength": 10,
"dashes": false,
"datasource": "prometheus",
"decimals": 2,
"editable": true,
"error": false,
"fill": 2,
"grid": {},
"gridPos": {
"h": 7,
"w": 8,
"x": 0,
"y": 144
},
"height": "250px",
"id": 36,
"legend": {
"alignAsTable": false,
"avg": true,
"current": false,
"hideEmpty": true,
"hideZero": true,
"max": false,
"min": false,
"rightSide": false,
"show": true,
"total": false,
"values": true
},
"lines": false,
"linewidth": 2,
"links": [],
"nullPointMode": "null",
"percentage": false,
"pointradius": 1,
"points": true,
"renderer": "flot",
"seriesOverrides": [],
"spaceLength": 10,
"stack": false,
"steppedLine": false,
"targets": [
{
"calculatedInterval": "2m",
"datasourceErrors": {},
"errors": {},
"expr": "sum((rate(node_disk_read_time_ms{device!~\"dm-.+\", instance=\"$host\"}[$interval]) / rate(node_disk_reads_completed{device!~\"dm-.+\", instance=\"$host\"}[$interval])) or (irate(node_disk_read_time_ms{device!~\"dm-.+\", instance=\"$host\"}[5m]) / irate(node_disk_reads_completed{device!~\"dm-.+\", instance=\"$host\"}[5m]))\nor avg_over_time(aws_rds_read_latency_average{instance=\"$host\"}[$interval]) or avg_over_time(aws_rds_read_latency_average{instance=\"$host\"}[5m]))",
"format": "time_series",
"interval": "$interval",
"intervalFactor": 1,
"legendFormat": "Read",
"metric": "",
"refId": "A",
"step": 20,
"target": ""
},
{
"calculatedInterval": "2m",
"datasourceErrors": {},
"errors": {},
"expr": "sum((rate(node_disk_write_time_ms{device!~\"dm-.+\", instance=\"$host\"}[$interval]) / rate(node_disk_writes_completed{device!~\"dm-.+\", instance=\"$host\"}[$interval])) or (irate(node_disk_write_time_ms{device!~\"dm-.+\", instance=\"$host\"}[5m]) / irate(node_disk_writes_completed{device!~\"dm-.+\", instance=\"$host\"}[5m])) or \navg_over_time(aws_rds_write_latency_average{instance=\"$host\"}[$interval]) or avg_over_time(aws_rds_write_latency_average{instance=\"$host\"}[5m]))",
"format": "time_series",
"interval": "$interval",
"intervalFactor": 1,
"legendFormat": "Write",
"metric": "",
"refId": "B",
"step": 20,
"target": ""
}
],
"thresholds": [],
"timeFrom": null,
"timeShift": null,
"title": "Disk Latency",
"tooltip": {
"msResolution": false,
"shared": true,
"sort": 0,
"value_type": "individual"
},
"transparent": false,
"type": "graph",
"xaxis": {
"buckets": null,
"mode": "time",
"name": null,
"show": true,
"values": []
},
"yaxes": [
{
"format": "ms",
"label": "",
"logBase": 2,
"max": null,
"min": null,
"show": true
},
{
"format": "ms",
"label": "",
"logBase": 1,
"max": null,
"min": 0,
"show": true
}
],
"yaxis": {
"align": false,
"alignLevel": null
}
},
{
"aliasColors": {},
"bars": false,
"dashLength": 10,
"dashes": false,
"datasource": "prometheus",
"decimals": null,
"editable": true,
"error": false,
"fill": 2,
"grid": {},
"gridPos": {
"h": 7,
"w": 8,
"x": 8,
"y": 144
},
"height": "250px",
"id": 21,
"legend": {
"alignAsTable": false,
"avg": true,
"current": false,
"hideEmpty": false,
"max": false,
"min": false,
"rightSide": false,
"show": true,
"sort": "avg",
"sortDesc": true,
"total": false,
"values": true
},
"lines": true,
"linewidth": 2,
"links": [],
"nullPointMode": "null",
"percentage": false,
"pointradius": 5,
"points": false,
"renderer": "flot",
"seriesOverrides": [
{
"alias": "Outbound",
"transform": "negative-Y"
}
],
"spaceLength": 10,
"stack": false,
"steppedLine": false,
"targets": [
{
"calculatedInterval": "2s",
"datasourceErrors": {},
"errors": {},
"expr": "sum(rate(node_network_receive_bytes{instance=\"$host\", device!=\"lo\"}[$interval])) or sum(irate(node_network_receive_bytes{instance=\"$host\", device!=\"lo\"}[5m])) or sum(max_over_time(rdsosmetrics_network_rx{instance=\"$host\"}[$interval])) or sum(max_over_time(rdsosmetrics_network_rx{instance=\"$host\"}[5m])) ",
"format": "time_series",
"interval": "$interval",
"intervalFactor": 1,
"legendFormat": "Inbound",
"metric": "",
"refId": "B",
"step": 20,
"target": ""
},
{
"calculatedInterval": "2s",
"datasourceErrors": {},
"errors": {},
"expr": "sum(rate(node_network_transmit_bytes{instance=\"$host\", device!=\"lo\"}[$interval])) or sum(irate(node_network_transmit_bytes{instance=\"$host\", device!=\"lo\"}[5m])) or\nsum(max_over_time(rdsosmetrics_network_tx{instance=\"$host\"}[$interval])) or sum(max_over_time(rdsosmetrics_network_tx{instance=\"$host\"}[5m]))",
"format": "time_series",
"interval": "$interval",
"intervalFactor": 1,
"legendFormat": "Outbound",
"metric": "",
"refId": "A",
"step": 20,
"target": ""
}
],
"thresholds": [],
"timeFrom": null,
"timeShift": null,
"title": "Network Traffic",
"tooltip": {
"msResolution": false,
"shared": true,
"sort": 0,
"value_type": "individual"
},
"transparent": false,
"type": "graph",
"xaxis": {
"buckets": null,
"mode": "time",
"name": null,
"show": true,
"values": []
},
"yaxes": [
{
"format": "Bps",
"label": "",
"logBase": 1,
"max": null,
"min": null,
"show": true
},
{
"format": "bytes",
"logBase": 1,
"max": null,
"min": 0,
"show": true
}
],
"yaxis": {
"align": false,
"alignLevel": null
}
},
{
"aliasColors": {},
"bars": false,
"dashLength": 10,
"dashes": false,
"datasource": "prometheus",
"decimals": null,
"editable": true,
"error": false,
"fill": 2,
"grid": {},
"gridPos": {
"h": 7,
"w": 8,
"x": 16,
"y": 144
},
"id": 38,
"legend": {
"alignAsTable": false,
"avg": true,
"current": false,
"hideEmpty": false,
"max": false,
"min": false,
"rightSide": false,
"show": true,
"sort": "avg",
"sortDesc": true,
"total": false,
"values": true
},
"lines": true,
"linewidth": 2,
"links": [],
"nullPointMode": "null",
"percentage": false,
"pointradius": 5,
"points": false,
"renderer": "flot",
"seriesOverrides": [],
"spaceLength": 10,
"stack": false,
"steppedLine": false,
"targets": [
{
"calculatedInterval": "2s",
"datasourceErrors": {},
"errors": {},
"expr": "rate(node_vmstat_pswpin{instance=\"$host\"}[$interval]) * 4096 or irate(node_vmstat_pswpin{instance=\"$host\"}[5m]) * 4096",
"interval": "$interval",
"intervalFactor": 1,
"legendFormat": "Swap In (Reads)",
"metric": "",
"refId": "A",
"step": 20,
"target": ""
},
{
"calculatedInterval": "2s",
"datasourceErrors": {},
"errors": {},
"expr": "rate(node_vmstat_pswpout{instance=\"$host\"}[$interval]) * 4096 or irate(node_vmstat_pswpout{instance=\"$host\"}[5m]) * 4096",
"interval": "$interval",
"intervalFactor": 1,
"legendFormat": "Swap Out (Writes)",
"metric": "",
"refId": "B",
"step": 20,
"target": ""
}
],
"thresholds": [],
"timeFrom": null,
"timeShift": null,
"title": "Swap Activity",
"tooltip": {
"msResolution": false,
"shared": true,
"sort": 0,
"value_type": "individual"
},
"transparent": false,
"type": "graph",
"xaxis": {
"buckets": null,
"mode": "time",
"name": null,
"show": true,
"values": []
},
"yaxes": [
{
"format": "Bps",
"label": "",
"logBase": 1,
"max": null,
"min": 0,
"show": true
},
{
"format": "bytes",
"logBase": 1,
"max": null,
"min": 0,
"show": true
}
],
"yaxis": {
"align": false,
"alignLevel": null
}
}
],
"refresh": "1m",
"schemaVersion": 16,
"style": "dark",
"tags": [
"MySQL"
],
"templating": {
"list": [
{
"allFormat": "glob",
"auto": true,
"auto_count": 200,
"auto_min": "1s",
"current": {
"text": "auto",
"value": "$__auto_interval_interval"
},
"datasource": "prometheus",
"hide": 0,
"includeAll": false,
"label": "Interval",
"multi": false,
"multiFormat": "glob",
"name": "interval",
"options": [
{
"selected": true,
"text": "auto",
"value": "$__auto_interval_interval"
},
{
"selected": false,
"text": "1s",
"value": "1s"
},
{
"selected": false,
"text": "5s",
"value": "5s"
},
{
"selected": false,
"text": "1m",
"value": "1m"
},
{
"selected": false,
"text": "5m",
"value": "5m"
},
{
"selected": false,
"text": "1h",
"value": "1h"
},
{
"selected": false,
"text": "6h",
"value": "6h"
},
{
"selected": false,
"text": "1d",
"value": "1d"
}
],
"query": "1s,5s,1m,5m,1h,6h,1d",
"refresh": 2,
"type": "interval"
},
{
"allFormat": "glob",
"allValue": null,
"current": {},
"datasource": "prometheus",
"hide": 0,
"includeAll": false,
"label": "Host",
"multi": false,
"multiFormat": "regex values",
"name": "host",
"options": [],
"query": "label_values(mysql_up, instance)",
"refresh": 1,
"refresh_on_load": false,
"regex": "",
"sort": 1,
"tagValuesQuery": null,
"tags": [],
"tagsQuery": null,
"type": "query",
"useTags": false
}
]
},
"time": {
"from": "now-1h",
"to": "now"
},
"timepicker": {
"collapse": false,
"enable": true,
"hidden": false,
"notice": false,
"now": true,
"refresh_intervals": [
"5s",
"10s",
"30s",
"1m",
"5m",
"15m",
"30m",
"1h",
"2h",
"1d"
],
"status": "Stable",
"time_options": [
"5m",
"15m",
"1h",
"6h",
"12h",
"24h",
"2d",
"7d",
"30d"
],
"type": "timepicker"
},
"timezone": "browser",
"title": "MySQL Overview",
"uid": "MQWgroiiz",
"version": 1
}
grafana 展示效果: