xdebug调试原理
IDE(如PHPStorm)已经集成了一个遵循BGDP的XDebug插件,当开启它的时候, 会在本地开一个XDebug调试服务,监听在调试器中所设置的端口上,默认是9000,这个服务就会监听所有到9000端口的链接。

当浏览器发送一个带 XDEBUG_SESSION_START 的参数的请求到服务器时,服务器接受后将其转到后端的php处理,如果php开启了XDebug模块,则会将debug信息转发到客户端IP的IDE的调试端口上。

当参数或者cookie信息中不带 XDEBUG_SESSION_START ,则不会启动调试(相对而言,如果设置 xdebug.remote_autostart = 1 ,则不再使用特定的HTTP GET / POST变量来启动远程调试)。这就为后续在浏览器中添加开关提供了可能。
调试中基本通信说明:
1.打开浏览器,访问web页面,nginx通过fastcgi网关接口加载PHP脚本运行 (对应图上第一个朝向右的箭头)。
2.然后php解释器(当然必须已装好Xdebug扩展),向IDE端的9000端口( 本文下面用的都是9001,原因是我本机9000端口被其它程序占用)发起基于DBGP协议的调试请求。
3.IDE端收到DBGP协议请求后,就可以开始单步调试了。
4.调试完成后,服务端php解释器执行完毕,向浏览器返回response。
-
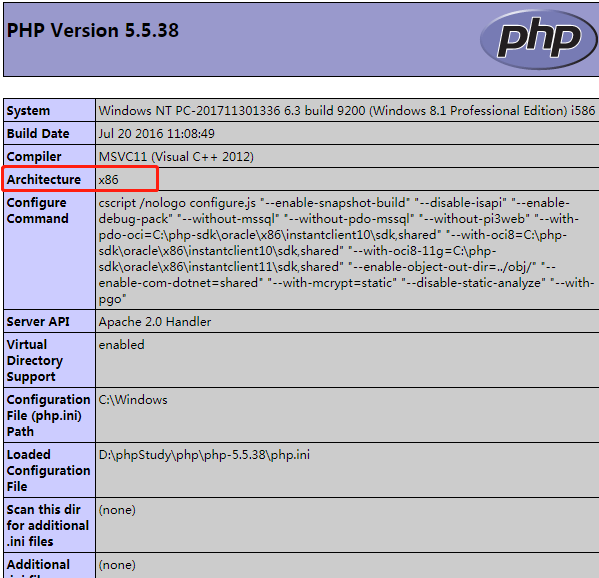
查看PHP版本信息,确定所要下载的xdebug版本

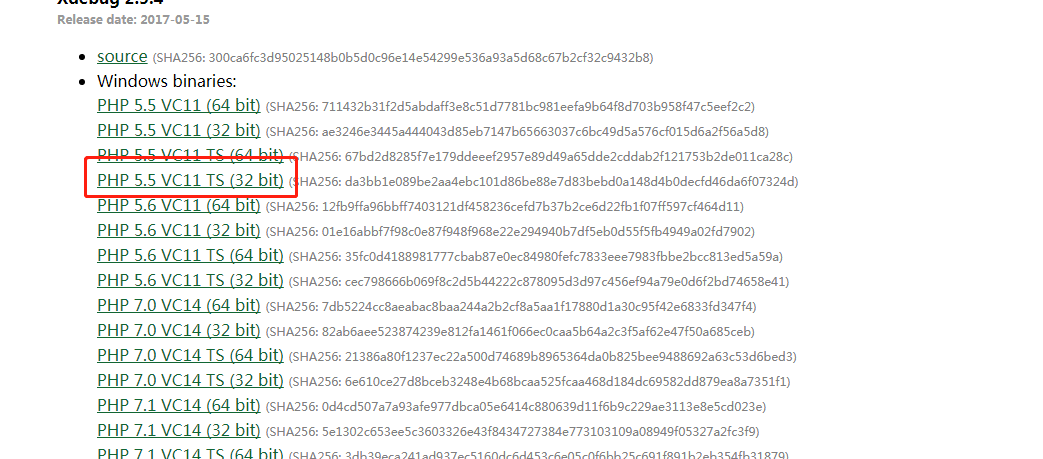
下载后拷贝到任何目录都可以(例:D:/phpStudy/php/php-5.5.38/ext/ 中)
-
配置php.ini文件
port可自定义,但要注意避免和当前已使用端口不冲突!
[XDebug]
;配置参考:https://segmentfault.com/a/1190000016325041
;全部配置:https://xdebug.org/docs/all_settings
;指定Xdebug扩展文件的绝对路径
zend_extension="D:ProgramFilesphpStudyphpphp-7.0.12-ntsextphp_xdebug.dll"
;启用性能检测分析
;xdebug.profiler_enable=On
;启用代码自动跟踪
;xdebug.auto_trace=on
;允许收集传递给函数的参数变量
;xdebug.collect_params=On
;允许收集函数调用的返回值
;xdebug.collect_return=On
;指定堆栈跟踪文件的存放目录
xdebug.trace_output_dir="D:ProgramFilesphpStudy mpxdebug"
;指定性能分析文件的存放目录
xdebug.profiler_output_dir="D:ProgramFilesphpStudy mpxdebug"
xdebug.profiler_output_name = "cachegrind.out.%p"
;是否开启远程调试,boolean
xdebug.remote_enable = 1
;开启后,将不再使用特定的HTTP GET / POST变量来启动远程调试
;Normally you need to use a specific HTTP GET/POST variable to start remote debugging (see Step Debugging). When this setting is set to 1, Xdebug will always attempt to start a remote debugging session and try to connect to a client, even if the GET/POST/COOKIE variable was not present.
xdebug.remote_autostart = 1
;Can only be 'dbgp' to represent the debugger protocol. The DBGp protocol is the only supported protocol.
xdebug.remote_handler = dbgp
xdebug.remote_host = localhost
xdebug.remote_port=9001
-
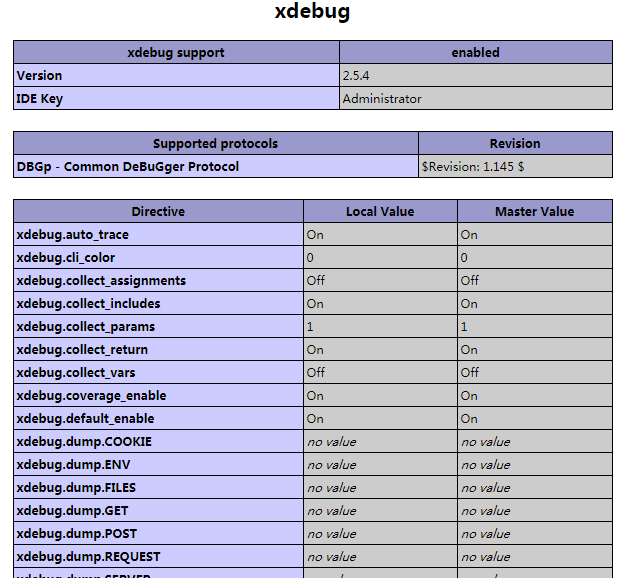
重启php
查看phpinfo()有无加载好xdebug扩展
参考地址:
https://segmentfault.com/a/1190000016325041
配置参考:https://segmentfault.com/a/1190000016325041
官方全部配置说明:https://xdebug.org/docs/all_settings