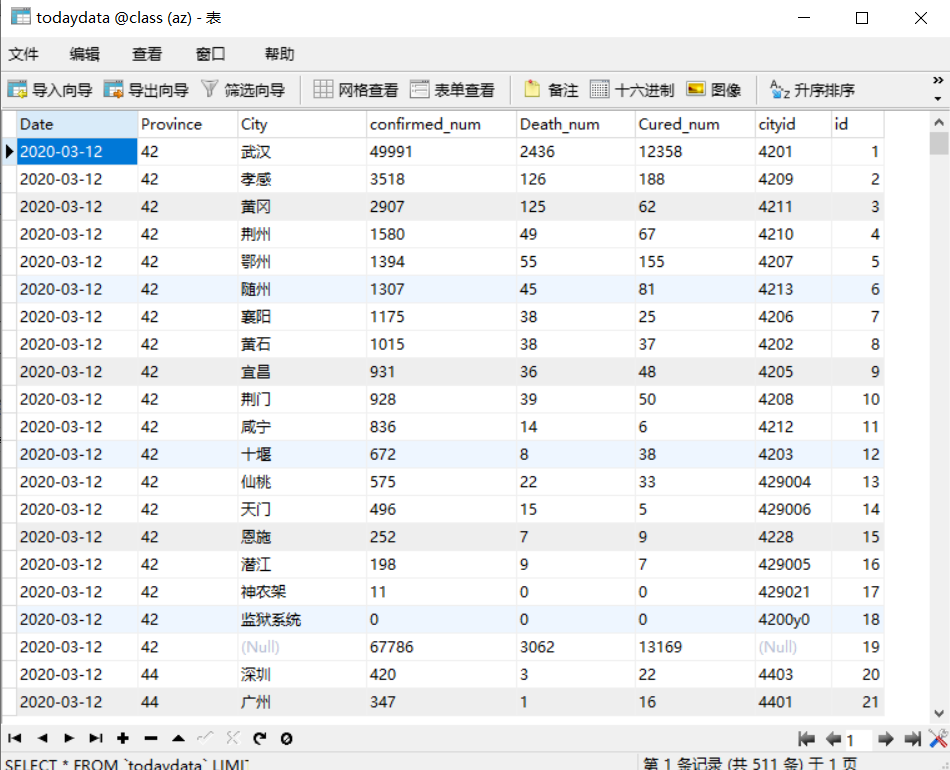
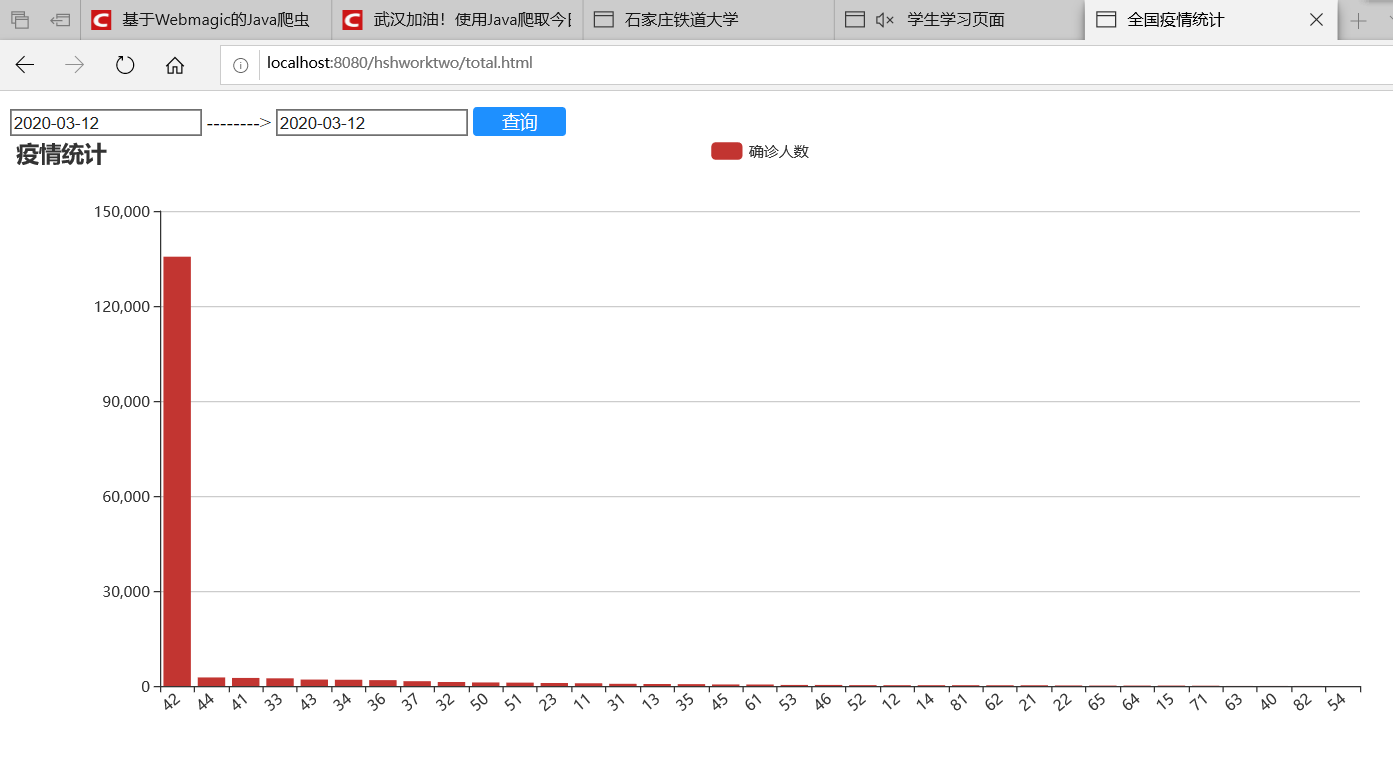
这周主要进行了全国疫情数据数据的爬取以及可视化


package servlet;

import java.io.IOException;
import java.io.PrintWriter;
import java.sql.SQLException;

import javax.servlet.ServletException;
import javax.servlet.annotation.WebServlet;
import javax.servlet.http.HttpServlet;
import javax.servlet.http.HttpServletRequest;
import javax.servlet.http.HttpServletResponse;

import dao.Function;


@WebServlet("/GetdataServlet")
public class GetdataServlet extends HttpServlet {
    private static final long serialVersionUID = 1L;


    protected void doGet(HttpServletRequest request, HttpServletResponse response) throws ServletException, IOException {
        request.setCharacterEncoding("utf-8");
        response.setContentType("utf-8");
        response.setCharacterEncoding("utf-8");
        String time1=request.getParameter("time1");
        String time2=request.getParameter("time2");
        System.out.println(time1+"--->"+time2);
        String json=null;
        try {
             json=Function.getData(time1, time2);
        } catch (SQLException e) {
            // TODO Auto-generated catch block
            e.printStackTrace();
        }
        System.out.println(json);
        PrintWriter out=response.getWriter();
        out.println(json);
        out.close();
    }


    protected void doPost(HttpServletRequest request, HttpServletResponse response) throws ServletException, IOException {
        request.setCharacterEncoding("utf-8");
        response.setContentType("utf-8");
        response.setCharacterEncoding("utf-8");
        String time1=request.getParameter("time1");
        String time2=request.getParameter("time2");
        System.out.println(time1+"--->"+time2);
        String json=null;
        try {
             json=Function.query(time1, time2);
        } catch (SQLException e) {
            // TODO Auto-generated catch block
            e.printStackTrace();
        }
        System.out.println(json);
        PrintWriter out=response.getWriter();
        out.println(json);
        out.close();
    }

}
<!DOCTYPE html>
<html>
<head>
<meta charset="UTF-8">
<title>全国疫情统计</title>
<style type="text/css">
#btn {
    /* 按钮美化 */
    margin-top: 5px;
     75px; /* 宽度 */
    height: 23px; /* 高度 */
    border- 0px; /* 边框宽度 */
    border-radius: 3px; /* 边框半径 */
    background: #1E90FF; /* 背景颜色 */
    cursor: pointer; /* 鼠标移入按钮范围时出现手势 */
    outline: none; /* 不显示轮廓线 */
    font-family: Microsoft YaHei; /* 设置字体 */
    color: white; /* 字体颜色 */
    font-size: 14px; /* 字体大小 */
}

#btn:hover {
    background: orange;
}
table td,th{
         padding: 20px;
        text-align: center;
        border:1px solid #70aefb ;
        vertical-align:middle;
    }
</style>
<script src="echarts.js"></script>
<script src="jquery-3.4.1.js"></script>

<script>
    $(function(){

        $("#btn").click(function(){

            $.post("GetdataServlet",{time1:$("#time1").val(),time2:$("#time2").val()},function(result){
                    if(result!=null){
                        var array=JSON.parse(result);
                        console.log(result);
                        console.log(array);
                        var province=[];
                        var count=[];
                        for(var i=0;i<array.length;i++){
                            province.push(array[i].province);
                            count.push(array[i].count);
                        }
                        var myChart = echarts.init(document.getElementById('main'));
                        myChart.hideLoading();
                            myChart.setOption({
                             title: {
                                  text: '疫情统计'
                              },
                                legend: {
                                        data:['确诊人数']
                                   },
                            xAxis: {
                                data: province,
                                axisLabel: {interval:0,rotate:40 }
                            },

                            yAxis: {

                            },
                            series: [{
                                // 根据名字对应到相应的系列
                                  name: '确诊人数',
                                data:count

                            }]

                        });

                            $.get("GetdataServlet?time1="+$("#time1").val()+"&time2="+$("#time2").val(),function(result){
                                if(result!=null){

                                    var json=JSON.parse(result);
                                    for(var j=0;j<json.length;j++){
                                        html+="<tr><td>"+json[j].id+"</td><td>"+json[j].date+"</td><td>"+json[j].province+"</td><td>"+json[j].city+"</td><td>"+json[j].confirmed_num+"</td><td>"+json[j].Cured_num+"</td><td>"+json[j].Dead_num+"</td></tr>"
                                    }

                                    console.log(json);
                                    $("#table").html(html+"</table>");
                                }else{

                                }
                            });


                    }else{
                        alert("暂无该数据统计情况");
                    }
            });


        });
    });
</script>
</head>
<body>
    <input type="text" id="time1" name="time1" />
    <span>--------></span>
    <input type="text" id="time2" name="time2" />
    <input type="button" value="查询" id="btn">
    <div id="main" style=" 1200px; height: 500px;"></div>
    <div id="table"></div>
    <script>
        var myChart = echarts.init(document.getElementById('main'));
        // 显示标题,图例和空的坐标轴
        myChart.setOption({
            title : {
                text : '疫情统计柱形图'
            },
            tooltip : {},
            legend : {
                data : [ '确诊人数' ]
            },
            xAxis : {
                data : []
            },
            yAxis : {},
            series : [ {
                name : '确诊人数',
                type : 'bar',
                data : []
            } ]
        });
    </script>
</body>
</html>