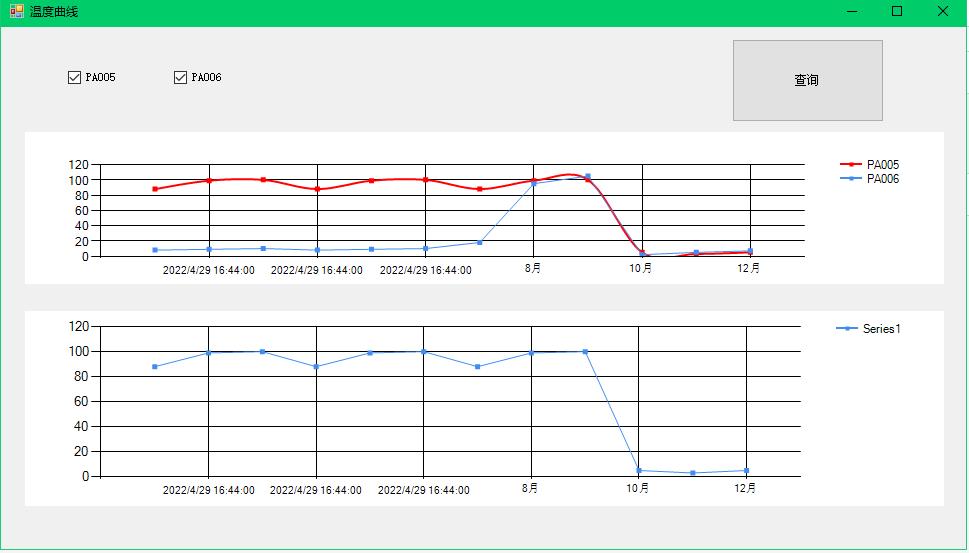
c#ms chart图表隐藏与显示某一系列曲线方法vs2019
 private void checkBox1_CheckedChanged(object sender, EventArgs e)
        {
            if(checkBox1.Checked==true)
            {
              //  chart1.Series[0].IsVisibleInLegend = true;
              //  chart2.Series[0].IsVisibleInLegend = true;

                chart1.Series[0].Enabled = true;

                //by txwtech
            }
            else
            {
               // chart1.Series[0].IsVisibleInLegend = false;
                chart1.Series[0].Enabled = false;
                // chart1.Series[0].Points.Clear();
              //  chart2.Series[0].IsVisibleInLegend = false;
            }
        }

using System;
using System.Collections.Generic;
using System.ComponentModel;
using System.Data;
using System.Drawing;
using System.IO;
using System.Linq;
using System.Net;
using System.Text;
using System.Threading.Tasks;
using System.Windows.Forms;
using System.Windows.Forms.DataVisualization.Charting;

namespace draw_chart_practice
{
    public partial class Form1 : Form
    {
        public Form1()
        {
            InitializeComponent();
        }
        ToolTip toolTip = new ToolTip();
        string postion11 = "";
        string[] xx = new string []{"1月","2月", "3月","4月", "5月", "6月","7月", "8月", "9月", "10月", "11月", "12月" };

        int[] yy = new int[] { 88,99,100, 88, 99, 100 , 88, 99, 100,5,3,5 };
        int[] yy2 = new int[] { 8, 9, 10, 8, 9, 10, 18, 95, 105,2,5,7 };
      //  string[] yy3 = new string[] { "1月", "2月", "3月", "4月", "5月", "6月", "7月", "8月", "9月", "10月", "11月", "12月" };

        private void modify()
        {
          //  static void Main(string[] args)
            {
                DirectoryInfo directoryInfo = new DirectoryInfo(Application.StartupPath);
                string path = directoryInfo.Parent.Parent.FullName + @"\Properties\AssemblyInfo.cs"; //上上级目录

             //   if (args.Length != 1 || !File.Exists(args[0])) return;
                var lines = File.ReadAllLines(path);
                for (int i = lines.Length - 1; i >= 0; i--)
                {
                    if (lines[i].Contains("assembly: AssemblyFileVersion"))
                    {
                        UpdateVersion(ref lines[i]);
                    }
                    if (lines[i].Contains("assembly: AssemblyVersion") && !lines[i].Contains("*"))
                    {
                        UpdateVersion(ref lines[i]);
                        break;
                    }
                }
                File.WriteAllLines(path, lines);
            }
        }
        public static void AddLogInfo_IP(string log_text)
        {
            try
            {


              //  lock (Obj)
                {


                    string data = log_text;

                    string strNow, strDate;

                    System.DateTime currentTime = new System.DateTime();
                    currentTime = System.DateTime.Now;
                    strNow = currentTime.ToString();//记录具体时间
                    strDate = currentTime.ToString("yyyyMMdd");
                    strDate = "\\\\172.17.50.89\\txw\\box_verification_ip\\" + strDate + "box_verification.txt"; //创建文件名
                                                                                      //  strDate = "\
                    if (true)//
                    {
                        data = strNow + " " + data + "\r\n";
                        File.AppendAllText(strDate, data, Encoding.UTF8);

                    }
                }
            }
            catch (IOException e)
            {

                MessageBox.Show("日志记录写入错误\r\n" + e.StackTrace + "\r\n" + e.Message);
            }
            catch (Exception ex)
            {
                MessageBox.Show("日志记录写入错误\r\n" + ex.StackTrace + "\r\n" + ex.Message);

            }
        }
        public static string GetLocalIp()
        {
            ///获取本地的IP地址
            string AddressIP = string.Empty;
            foreach (IPAddress _IPAddress in Dns.GetHostEntry(Dns.GetHostName()).AddressList)
            {
                //if (_IPAddress.AddressFamily.ToString() == "InterNetwork")
                {
                   // AddressIP = _IPAddress.ToString();
                }
                AddLogInfo_IP(_IPAddress.ToString());
            }
            return AddressIP;
        }
        private void button1_Click(object sender, EventArgs e)
        {
            //GetLocalIp();
            //   modify();
            //chart1.Series[0].Points.AddXY(1, 168);
            //chart1.Series[0].Points.AddXY(3, 122);
            //chart1.Series[0].Points.AddXY(4, 153);
            //chart1.Series[0].Points.AddXY(5, 172);
            //chart1.Series[0].Points.AddXY(6, 100);
            //chart1.Series[0].Points.AddXY(100, 120);
            //chart1.Series[1].Points.AddXY(2, 2);
            //chart1.Series[1].Points.AddXY(4, 6);
            xx[0] = System.DateTime.Now.ToString();
            xx[1] = System.DateTime.Now.ToString();
            xx[2] = System.DateTime.Now.ToString();
            xx[3] = System.DateTime.Now.ToString();
            xx[4] = System.DateTime.Now.ToString();
            xx[5] = System.DateTime.Now.ToString();
            chart1.Series[0].Points.DataBindXY(xx,yy);
            chart1.Series[1].Points.DataBindXY(xx, yy2);
            chart2.Series[0].Points.DataBindXY(xx, yy);
            // chart1.Series[0].Label = "#VAL";//每个点的值显示
            chart1.Series[0].ToolTip = "#VALX:#VAL";
            chart1.Series[1].ToolTip = "#VALX:#VAL";

            if (checkBox1.Checked == true)
            {
                chart1.Series[0].IsVisibleInLegend = true;
                chart1.Series[0].Enabled = true;
            }
            else
            {
                chart1.Series[0].IsVisibleInLegend = false;
                chart1.Series[0].Enabled = false;
              //  chart1.Series[0].Points.Clear();
            }
            if (checkBox2.Checked == true)
            {
                chart1.Series[1].IsVisibleInLegend = true;
            }
            else
            {
                chart1.Series[1].IsVisibleInLegend = false;
                //chart1.Series[1].Points.Clear();
            }
            InitChart(chart1);


        }
        static void UpdateVersion(ref string line)
        {
            var first = line.IndexOf('"');
            var second = line.LastIndexOf('"');
            var sVersion = line.Substring(first + 1, second - first - 1);
            var arrVersion = sVersion.Split('.');
            if (arrVersion.Length < 4) return;
            var major = Convert.ToInt32(arrVersion[0]);
            var minor = Convert.ToInt32(arrVersion[1]);
            var build = Convert.ToInt32(arrVersion[2]);
            var amendment = Convert.ToInt32(arrVersion[3]);
            if (++amendment > 999) ++build;
            if (build > 99) ++minor;
            if (minor > 9) ++major;
            var sNewVersion = $"{major}.{minor}.{build}.{amendment}";
            line = line.Replace(sVersion, sNewVersion);
        }


        private void InitChart(System.Windows.Forms.DataVisualization.Charting.Chart chart1)
        {
            chart1.ChartAreas[0].CursorX.Interval = 0;
            chart1.ChartAreas[0].CursorX.IsUserEnabled = true;
            chart1.ChartAreas[0].CursorX.IsUserSelectionEnabled = true;
            chart1.MouseClick += new System.Windows.Forms.MouseEventHandler(chart1_MouseClick);
        }

        private void chart1_MouseMove(object sender, MouseEventArgs e)
        {
            var area = chart1.ChartAreas[0];
           // var area = chart1.Series[0];

      //      double xvalue = area.AxisX.PixelPositionToValue(e.X);

          //  double yvalue = area.AxisY.PixelPositionToValue(e.Y);

            // textbox1.text = string.Format("{0:f0},{1:f0}", xvalue, yvalue);
        //    postion11=(string.Format("{0:f0},{1:f0}", xvalue, yvalue));


        }

        private void chart1_MouseHover(object sender, EventArgs e)
        {
            var area = chart1.ChartAreas[0];

           // double xvalue = area.AxisX.PixelPositionToValue(e.X);

           // double yvalue = area.AxisY.PixelPositionToValue(e.Y);

            // textbox1.text = string.Format("{0:f0},{1:f0}", xvalue, yvalue);
           // MessageBox.Show(string.Format("{0:f0},{1:f0}", xvalue, yvalue));
          //  toolTip.SetToolTip(chart1, postion11);
        }

        //  private void chart1_Click(object sender, EventArgs e)
        // {

        // }

        private void chart1_MouseClick(object sender, MouseEventArgs e)
        {
            Chart chart1 = sender as Chart;

          //  string aa = chart1.Series[0].ToolTip = "#VALX:#VAL";
         //   MessageBox.Show(aa);
            if (e.Button == MouseButtons.Right)
            {
                chart1.ChartAreas[0].AxisX.ScaleView.ZoomReset(0);
            }
        }

        private void checkBox1_CheckedChanged(object sender, EventArgs e)
        {
            if(checkBox1.Checked==true)
            {
              //  chart1.Series[0].IsVisibleInLegend = true;
              //  chart2.Series[0].IsVisibleInLegend = true;

                chart1.Series[0].Enabled = true;

                //by txwtech
            }
            else
            {
               // chart1.Series[0].IsVisibleInLegend = false;
                chart1.Series[0].Enabled = false;
                // chart1.Series[0].Points.Clear();
              //  chart2.Series[0].IsVisibleInLegend = false;
            }
        }

        private void checkBox2_CheckedChanged(object sender, EventArgs e)
        {
            if (checkBox2.Checked == true)
            {
                chart1.Series[1].IsVisibleInLegend = true;
            }
            else
            {
                chart1.Series[1].IsVisibleInLegend = false;
                //chart1.Series[1].Points.Clear();
            }
        }
    }

}