部署Prometheus监控报警系统
一、Prometheus介绍
Prometheus是由SoundCloud开发的开源监控报警系统和时序列数据库(TSDB);Prometheus使用Go语言开发,是Google BorgMon监控系统的开源版本;2016年由Google发起Linux基金会旗下的原生云基金会(Cloud Native Computing Foundation), 将Prometheus纳入其下第二大开源项目;Prometheus和Heapster(Heapster是K8S的一个子项目,用于获取集群的性能数据),相比功能更完善、更全面;Prometheus性能也足够支撑上万台规模的集群
1.1 Prometheus的特点
- 多维度数据模型。
- 灵活的查询语言。
- 不依赖分布式存储,单个服务器节点是自主的。
- 通过基于HTTP的pull方式采集时序数据。
- 可以通过中间网关进行时序列数据推送。
- 通过服务发现或者静态配置来发现目标服务对象。
- 支持多种多样的图表和界面展示,比如Grafana等。
1.2 架构图


1.3 基本原理
Prometheus的基本原理是通过HTTP协议周期性抓取被监控组件的状态,任意组件只要提供对应的HTTP接口就可以接入监控。不需要任何SDK或者其他的集成过程。这样做非常适合做虚拟化环境监控系统,比如VM、Docker、Kubernetes等。输出被监控组件信息的HTTP接口被叫做exporter 。目前互联网公司常用的组件大部分都有exporter可以直接使用,比如Varnish、Haproxy、Nginx、MySQL、Linux系统信息(包括磁盘、内存、CPU、网络等等)。
1.4 服务过程
- Prometheus Daemon负责定时去目标上抓取metrics(指标)数据,每个抓取目标需要暴露一个http服务的接口给它定时抓取。Prometheus支持通过配置文件、文本文件、Zookeeper、Consul、DNS SRV Lookup等方式指定抓取目标。Prometheus采用PULL的方式进行监控,即服务器可以直接通过目标PULL数据或者间接地通过中间网关来Push数据。
- Prometheus在本地存储抓取的所有数据,并通过一定规则进行清理和整理数据,并把得到的结果存储到新的时间序列中。
- Prometheus通过PromQL和其他API可视化地展示收集的数据。Prometheus支持很多方式的图表可视化,例如Grafana、自带的Promdash以及自身提供的模版引擎等等。Prometheus还提供HTTP API的查询方式,自定义所需要的输出。
- PushGateway支持Client主动推送metrics到PushGateway,而Prometheus只是定时去Gateway上抓取数据。
- Alertmanager是独立于Prometheus的一个组件,可以支持Prometheus的查询语句,提供十分灵活的报警方式。
1.5 三大套件
- Server 主要负责数据采集和存储,提供PromQL查询语言的支持
- Alertmanager 警告管理器,用来进行报警
- Push Gateway 支持临时性Job主动推送指标的中间网关
二、基础环境
| 环境/组件 | 版本 | 下载地址 |
| 操作系统 | CentOS7 | http://archive.kernel.org/centos-vault/7.3.1611/isos/x86_64/CentOS-7-x86_64-DVD-1611.iso |
| Prometheus | 2.17.1 | https://prometheus.io/download/#prometheus |
| go | 1.14.2 | https://golang.org/dl/ |
| Grafana | 6.7.2 | https://dl.grafana.com/oss/release/grafana-5.4.2-1.x86_64.rpm |
三、CentOS组件安装、更新及配置
3.1 防火墙设置
1 systemctl stop firewalld                              //关闭防火墙
2 systemctl disable firewalld                        //关闭防火墙自启

3.2 Selinux设置
1 sed -i '/SELINUX/s/enforcing/disabled/' /etc/selinux/config    //关闭Selinux
2 sestatus                 //查询Selinux状态(需重启后查询)
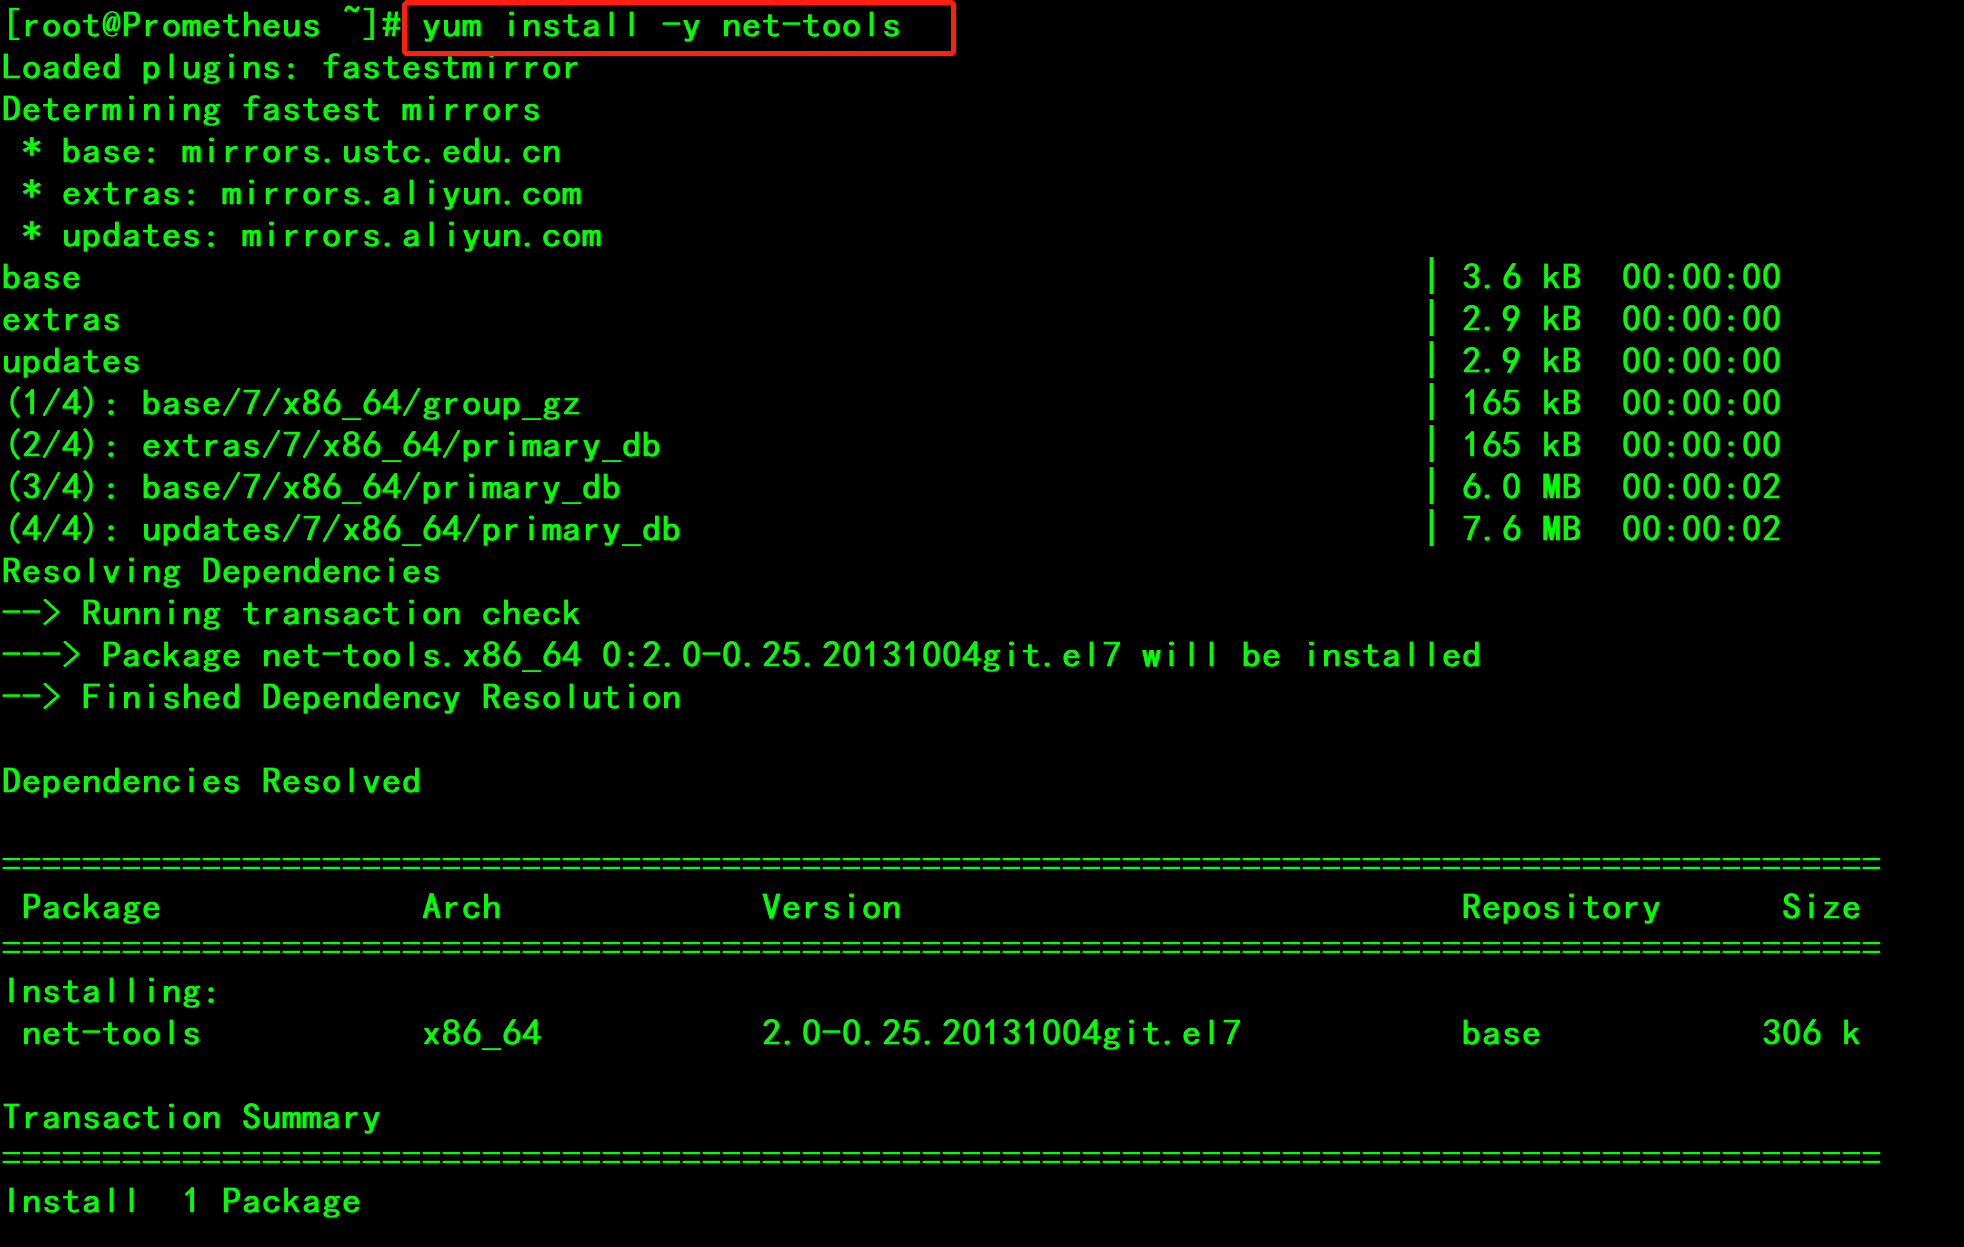
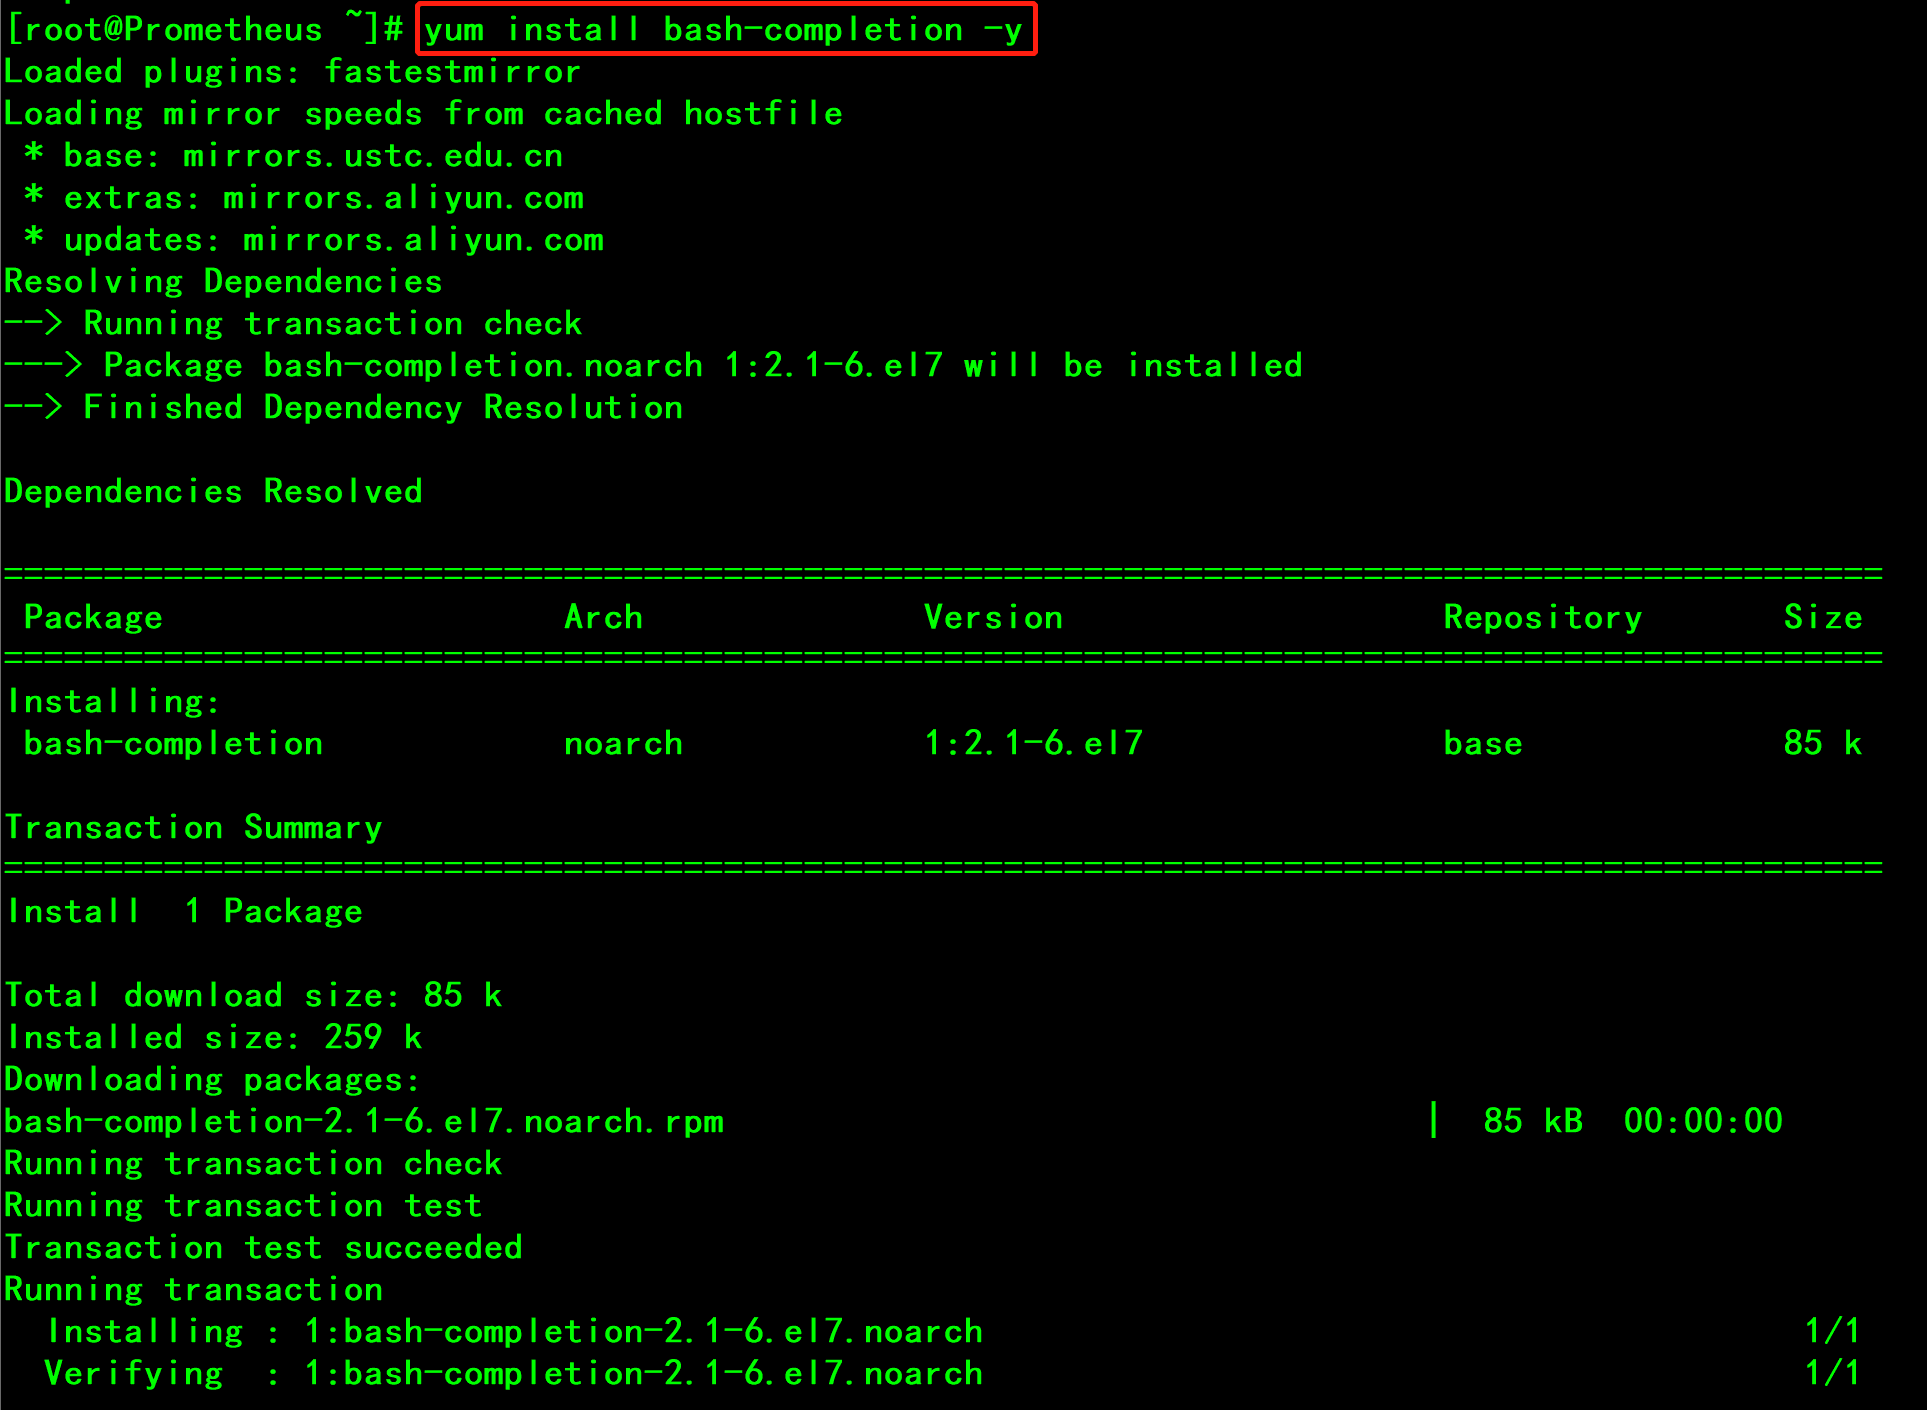
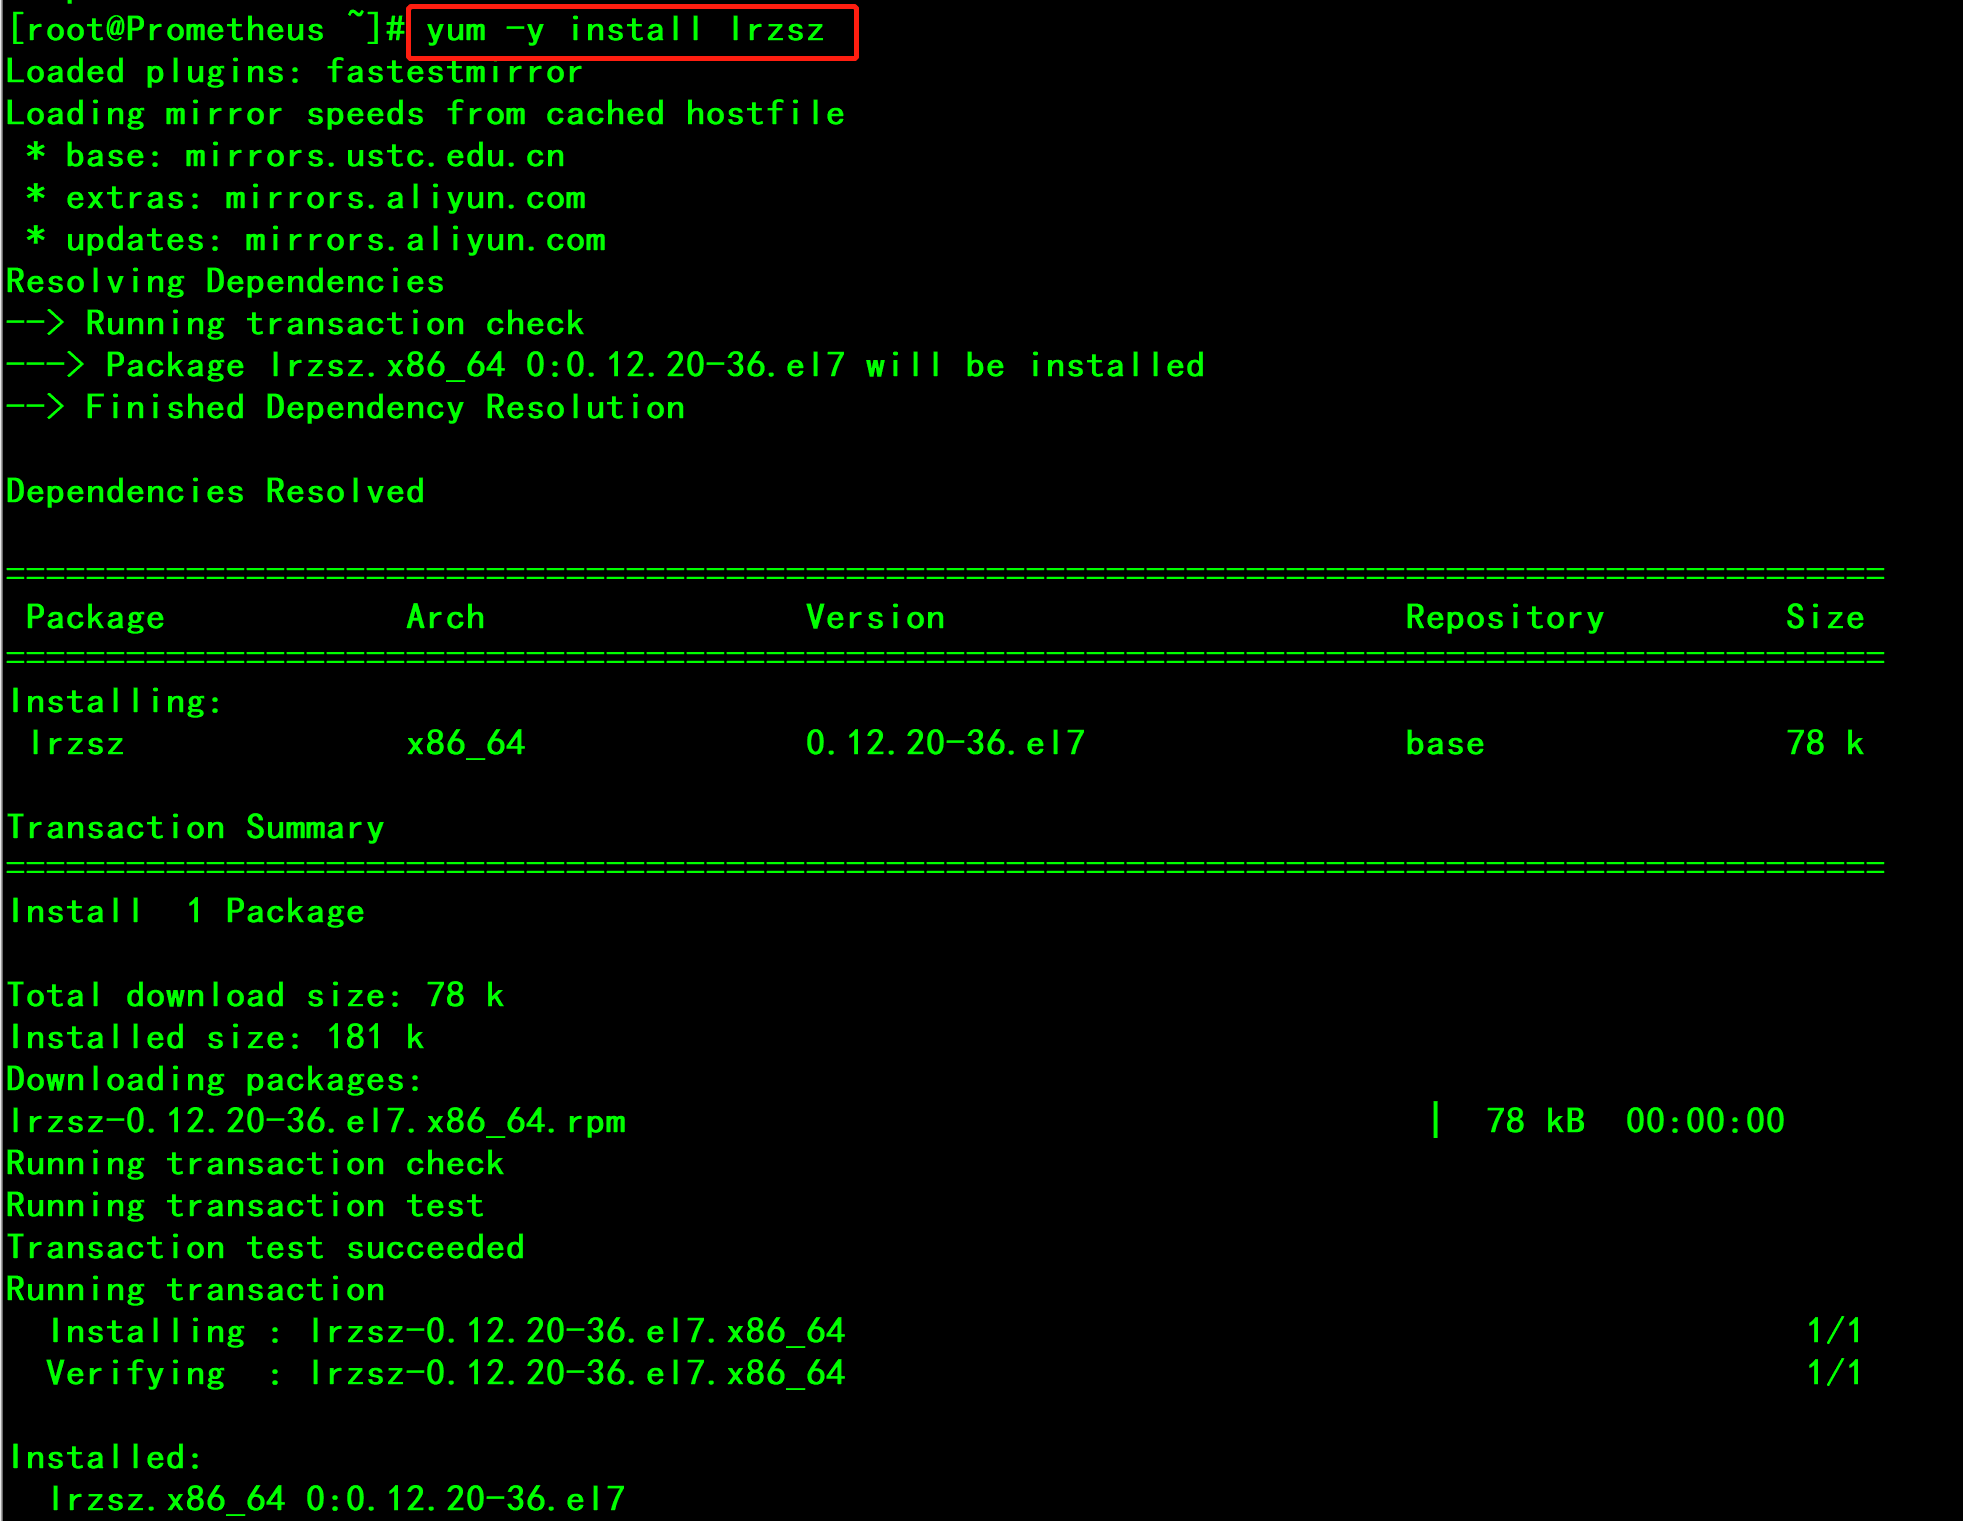
3.3 组件安装
1 yum install -y net-tools             //安装Ifconfig工具
2 yum install bash-completion -y                    //安装命令补全工具
3 yum -y install lrzsz                              //安装文件管理工具
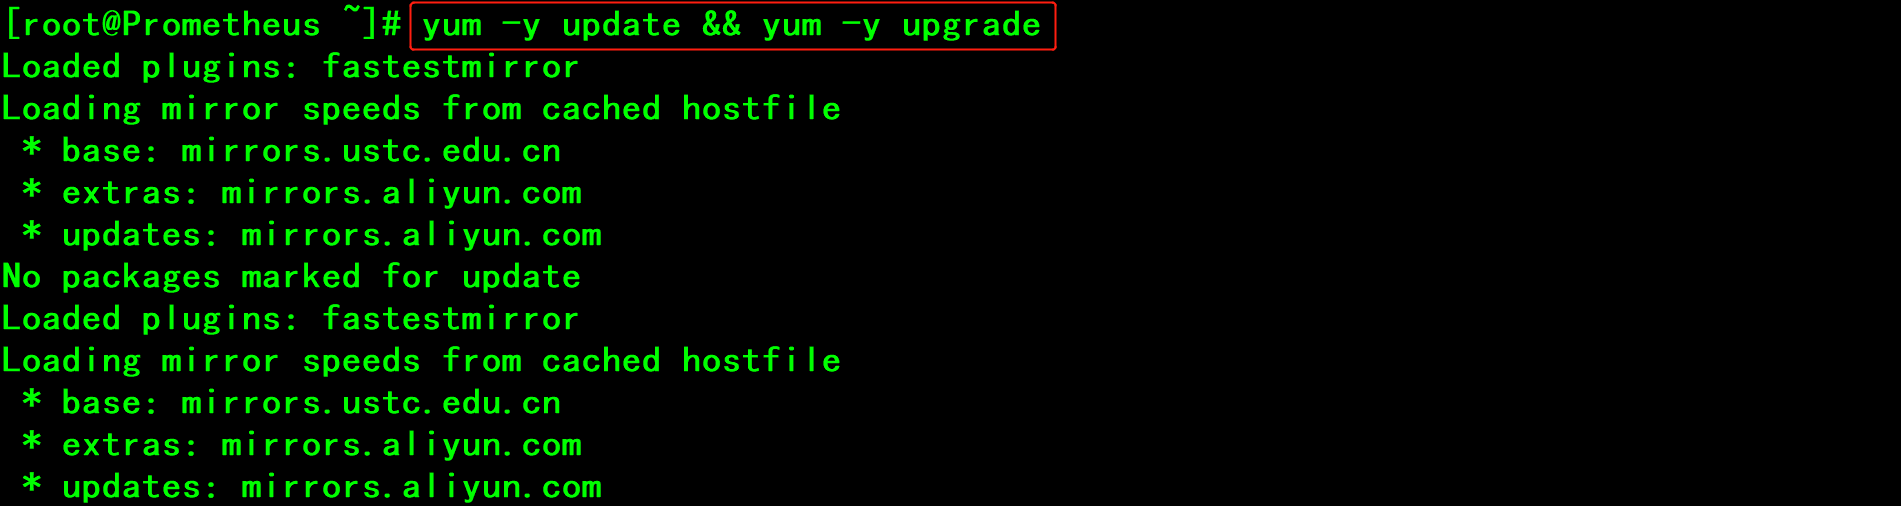
3.4 更新系统及源码库
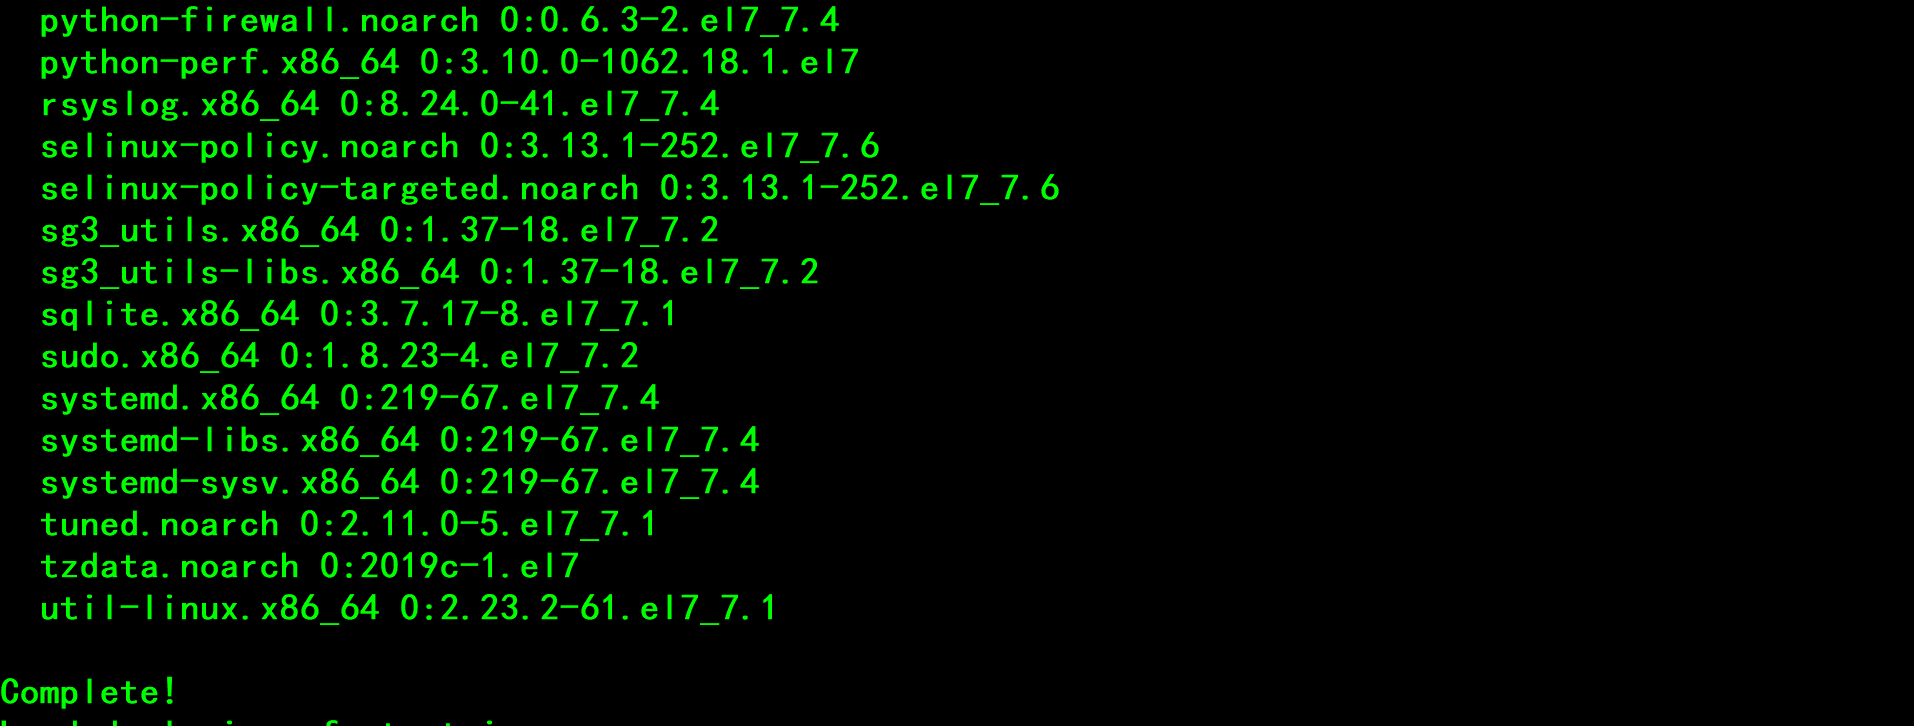
1 yum -y update && yum -y upgrade
四、Prometheus服务端安装
4.1 安装Go环境
Prometheus是由go语言开发的,安装Prometheus之前需要先安装go环境
1 cd /opt                //进入opt文件夹目录下
2 rz                    //上传go安装文件(下图中为上传了本次部署需要用到的所有安装包)
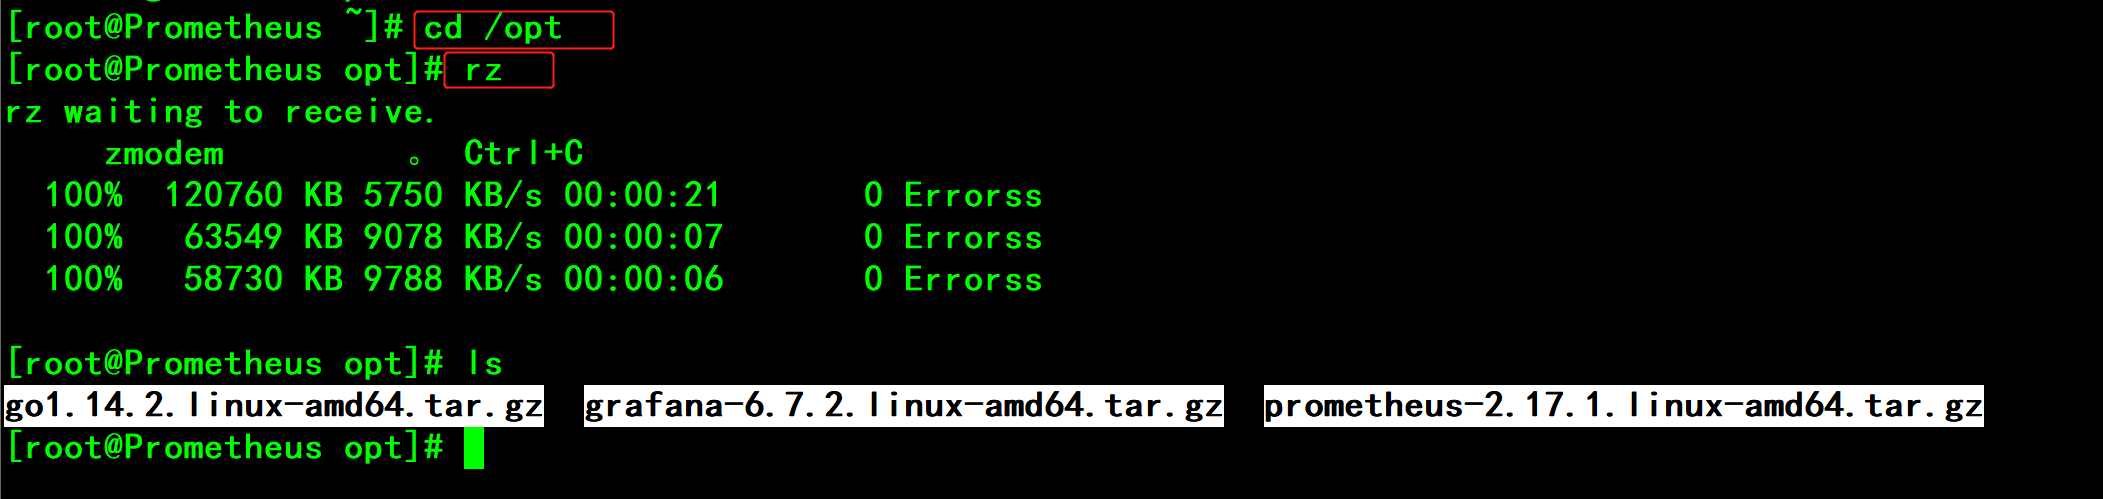
1 tar -xvf go1.14.2.linux-amd64.tar.gz //解压缩Go安装包
![]()
4.2 配置环境变量
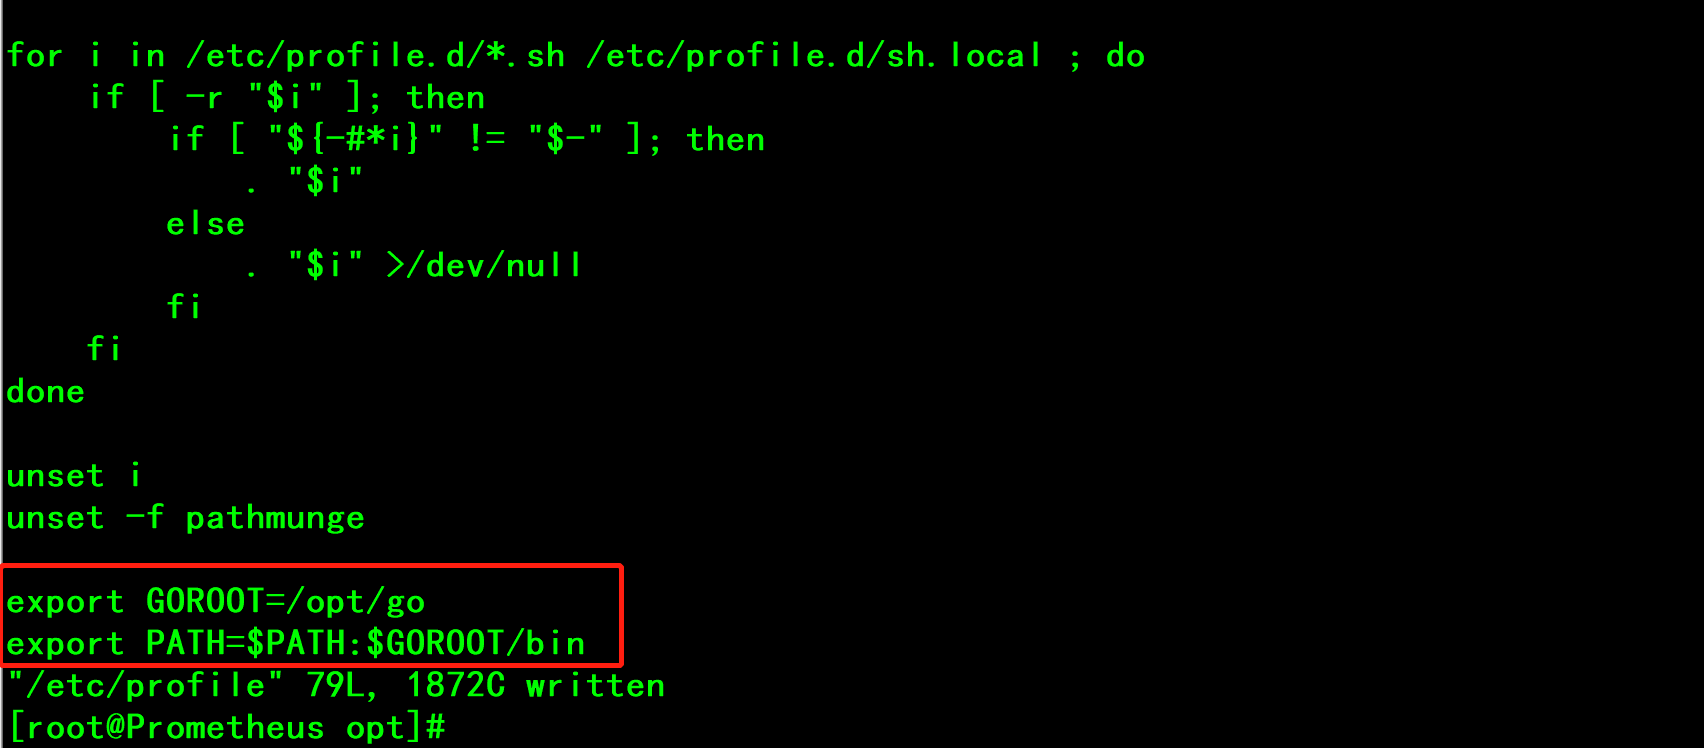
添加/opt/go/bin目录到PATH变量中(添加到/etc/profile 或$HOME/.profile都可以)
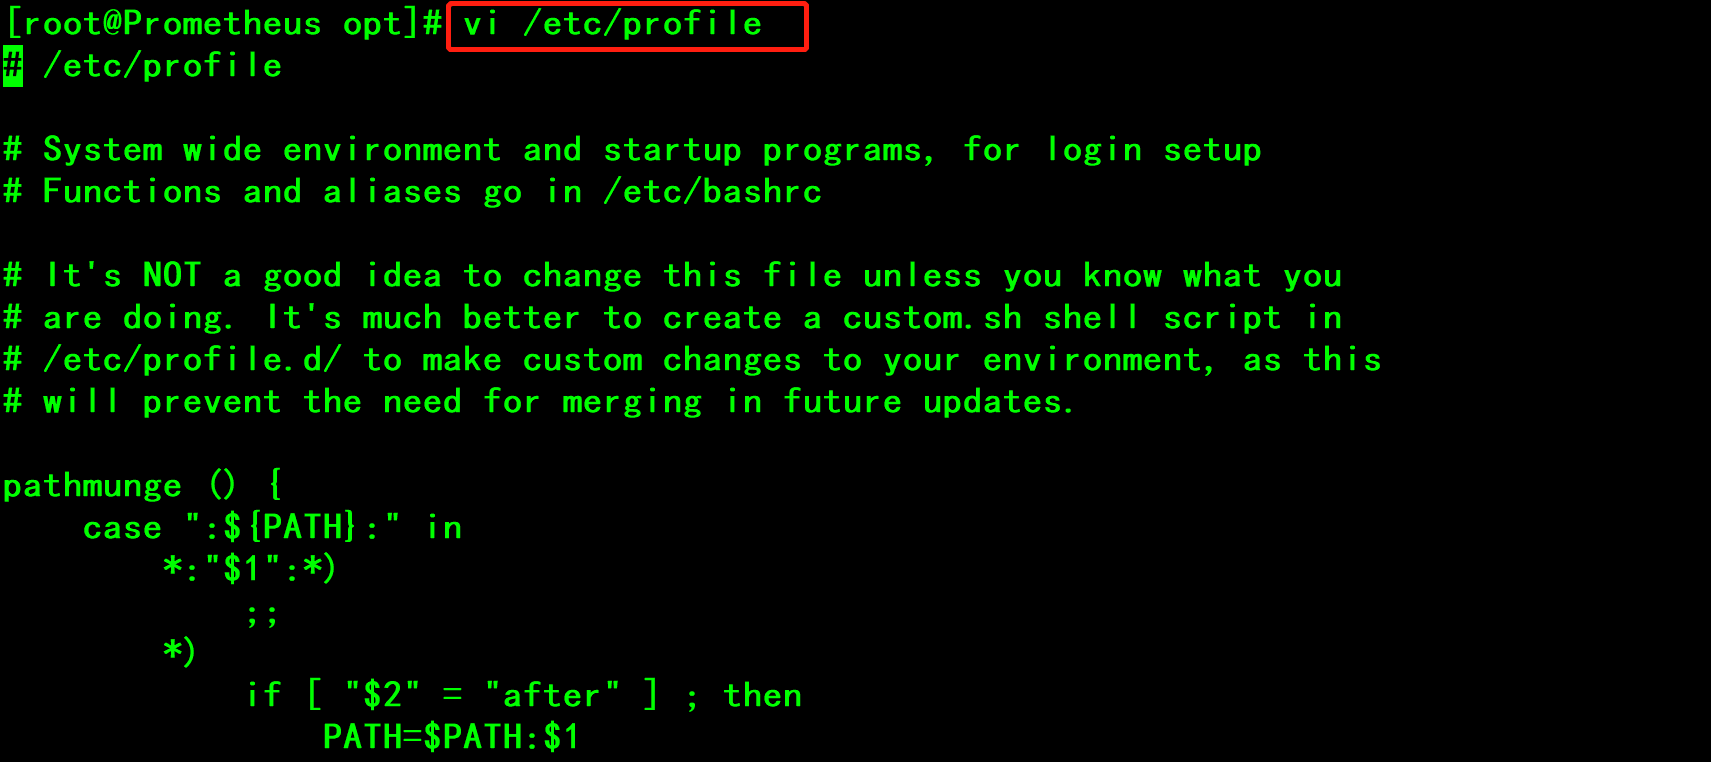
1 vi /etc/profile //编辑Profile文件
1 export GOROOT=/opt/go                 //添加在最后一行
2 export PATH=$PATH:$GOROOT/bin
1 source /etc/profile

1 go version //检查Go版本号(如果显示版本号,则Go环境安装成功)

五、安装Prometheus
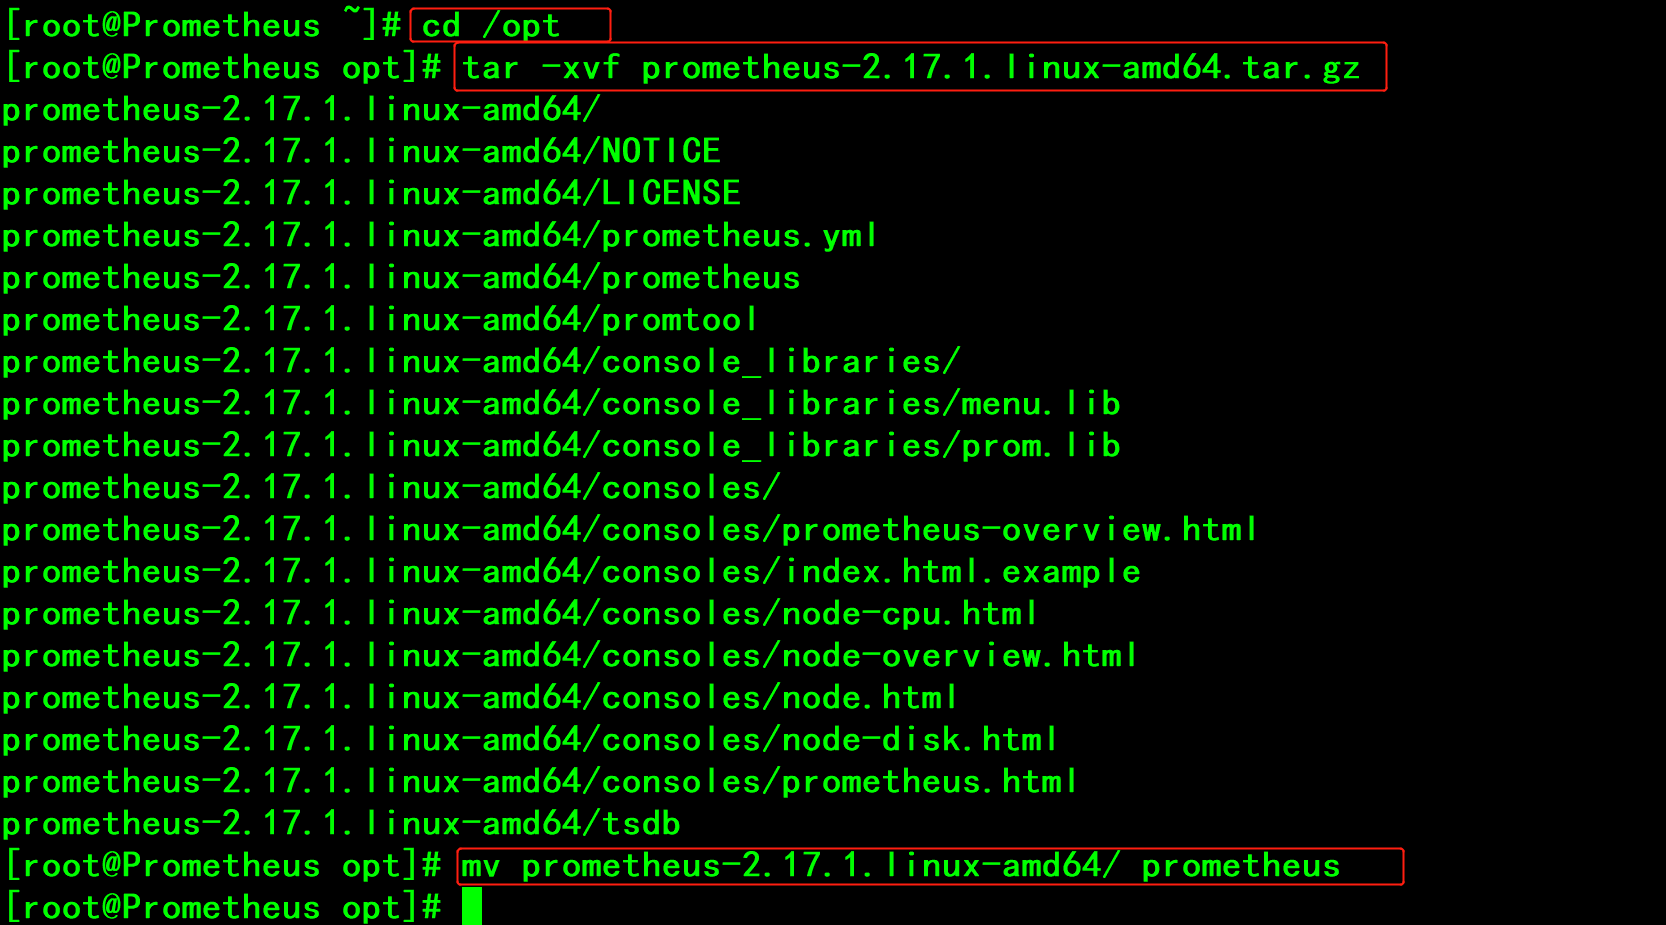
1 tar -xvf prometheus-2.17.1.linux-amd64.tar.gz             //解压缩Prometheus安装包
2 mv prometheus-2.17.1.linux-amd64/ prometheus         //移动文件至prometheus文件夹
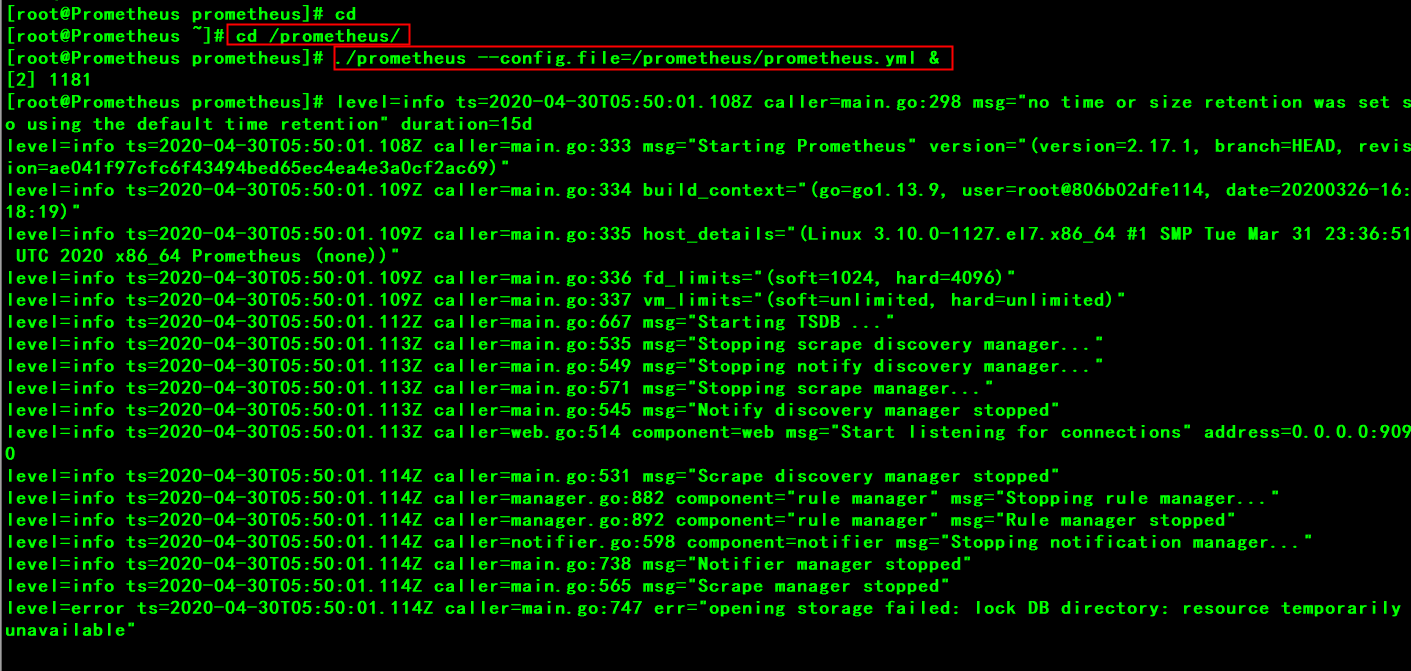
1 cd prometheus                            //进入prometheus文件夹
2 ./prometheus --config.file=/prometheus/prometheus.yml &       //启动prometheus
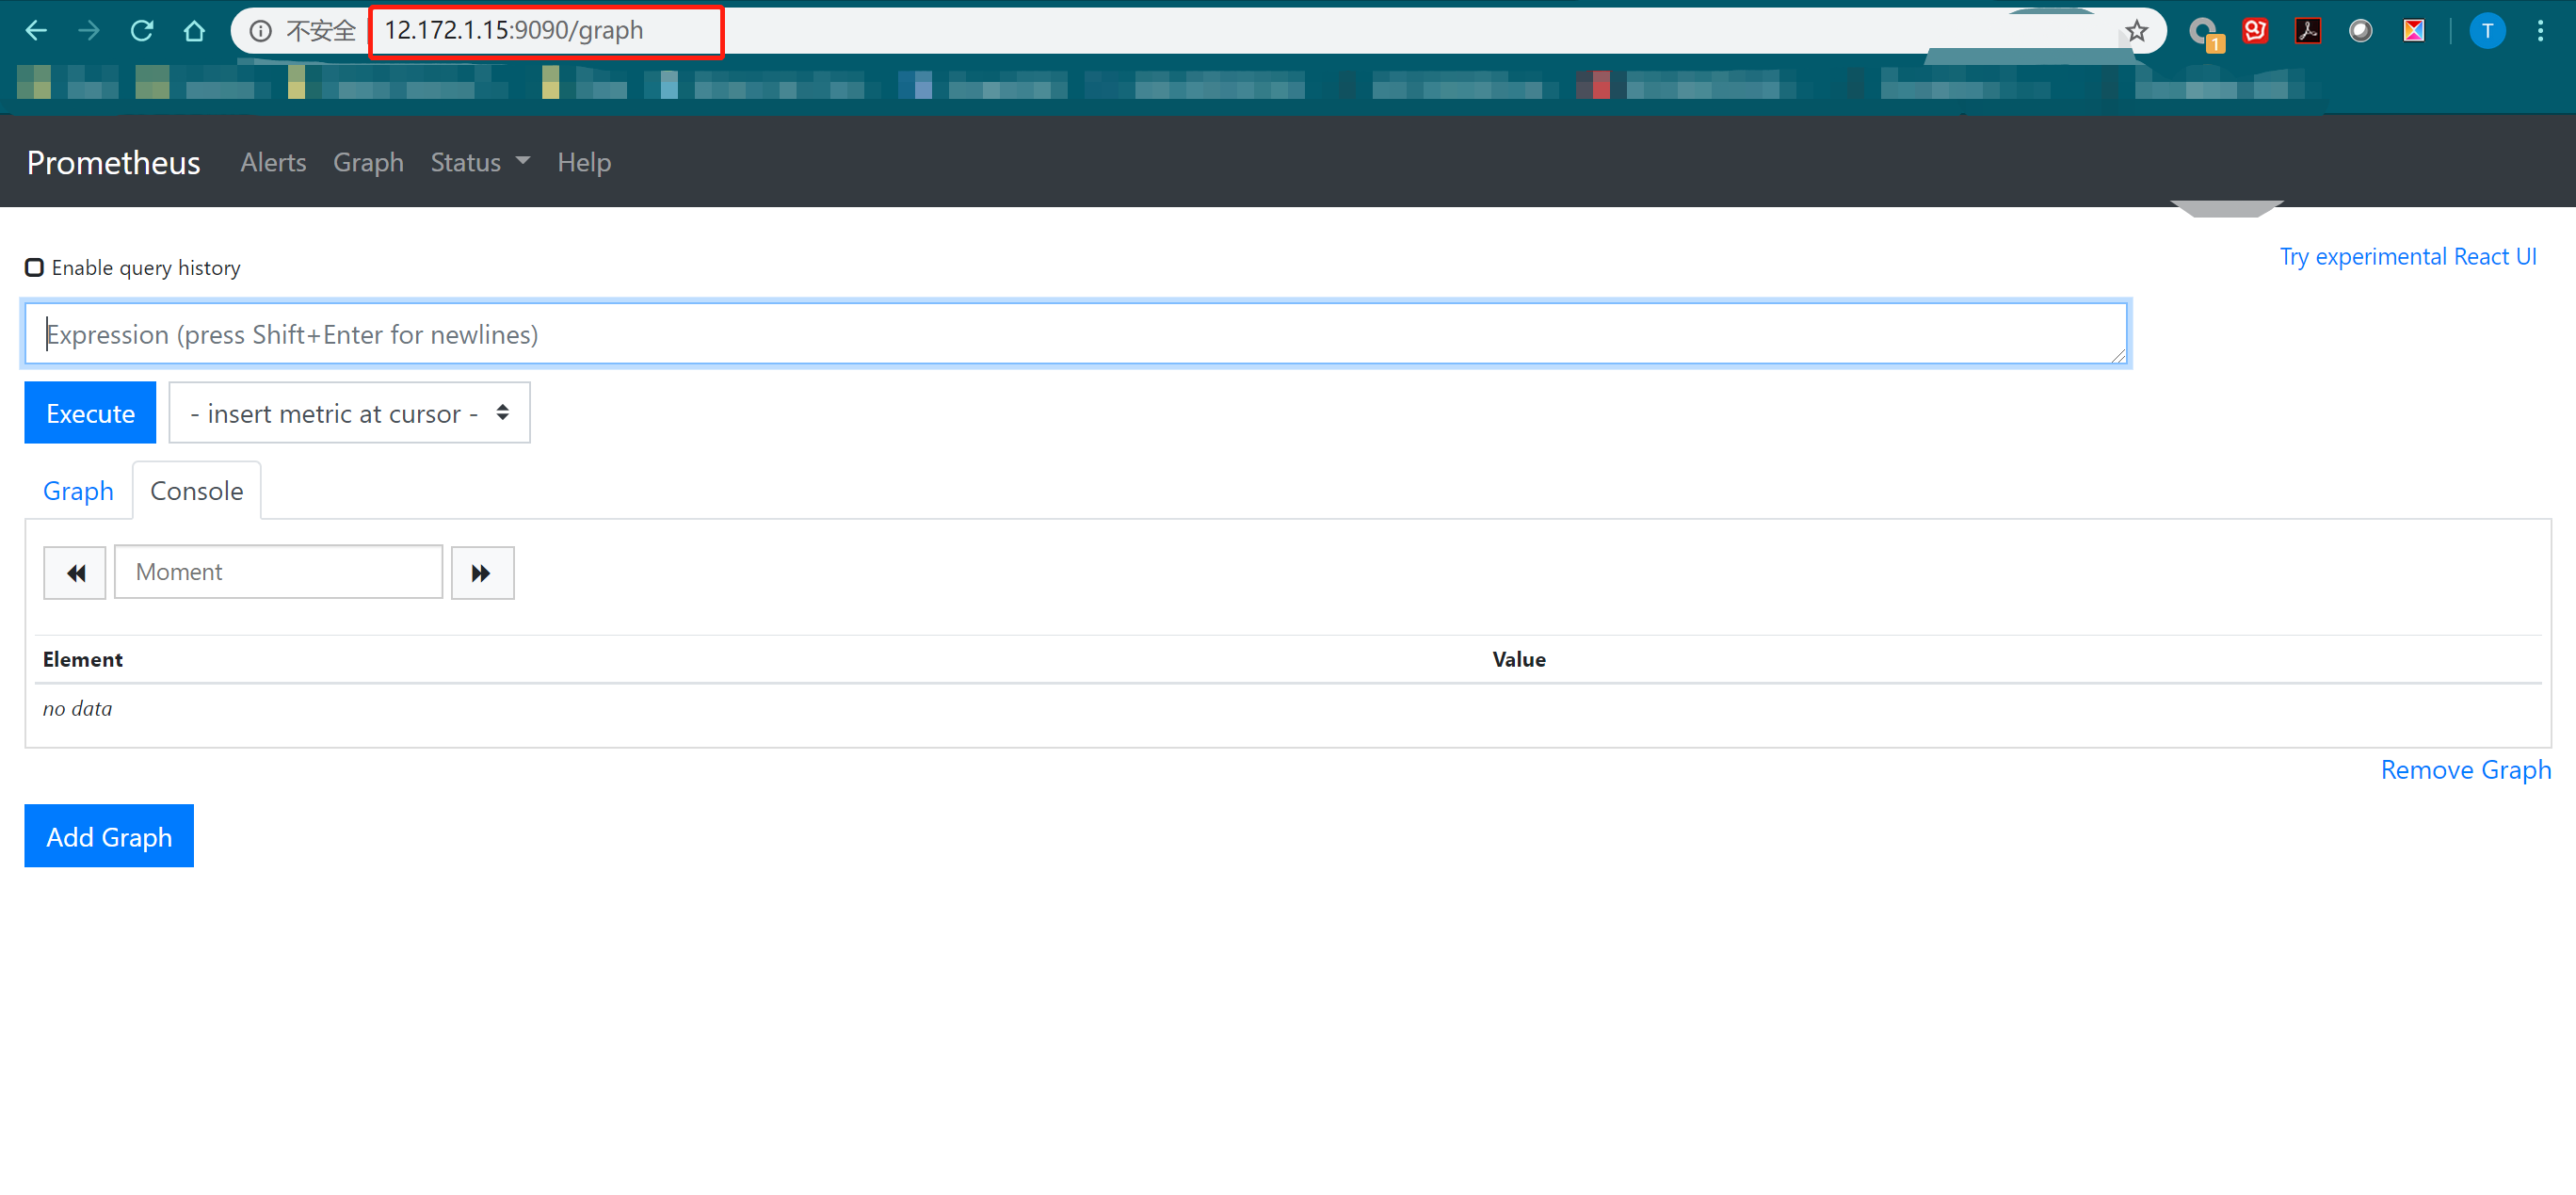
1 浏览器打开:http://12.172.1.15:9090 //正常打开说明安装没问题
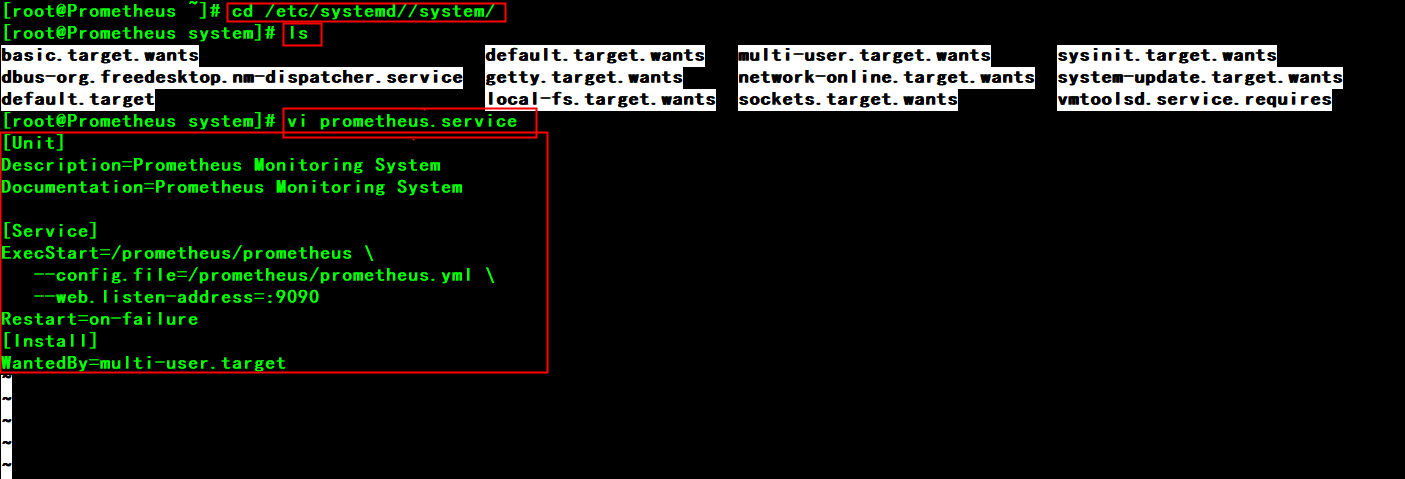
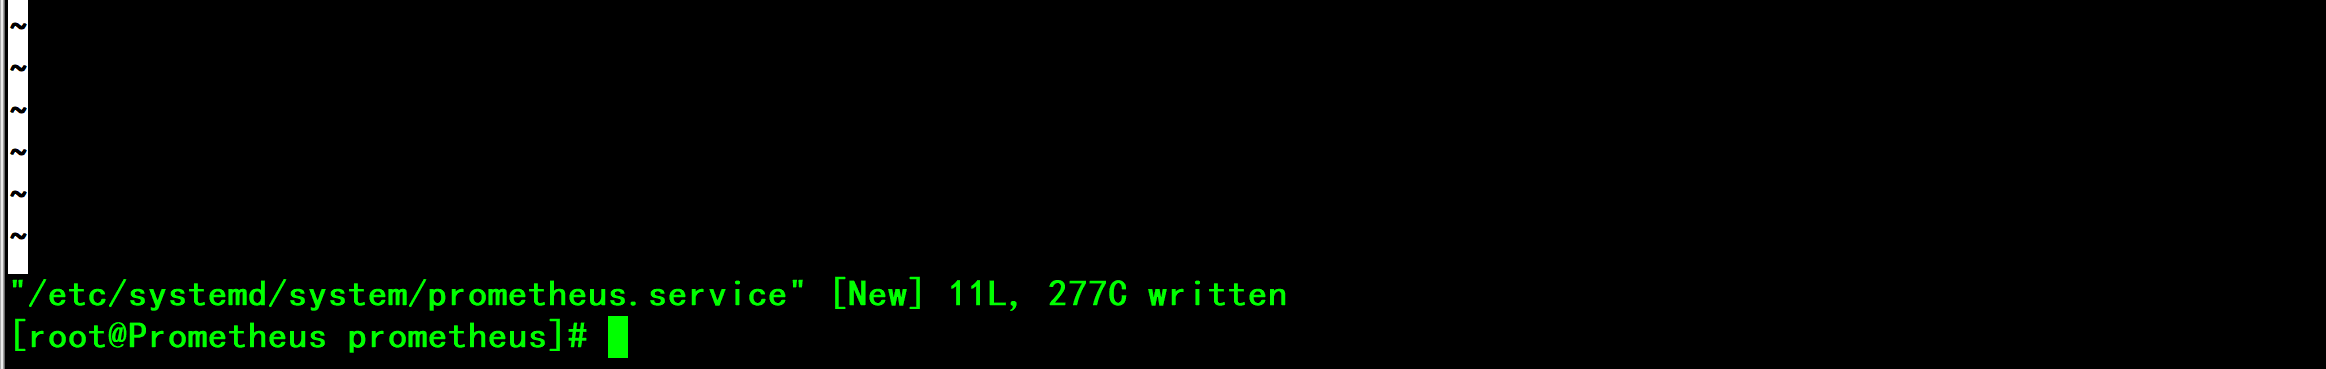
1 vi /etc/systemd/system/prometheus.service //创建prometheus服务
将以下内容写入文件中:
[Unit]
Description=Prometheus Monitoring System
Documentation=Prometheus Monitoring System

[Service]
ExecStart=/prometheus/prometheus
   --config.file=/prometheus/prometheus.yml
   --web.listen-address=:9090
Restart=on-failure
[Install]
WantedBy=multi-user.target

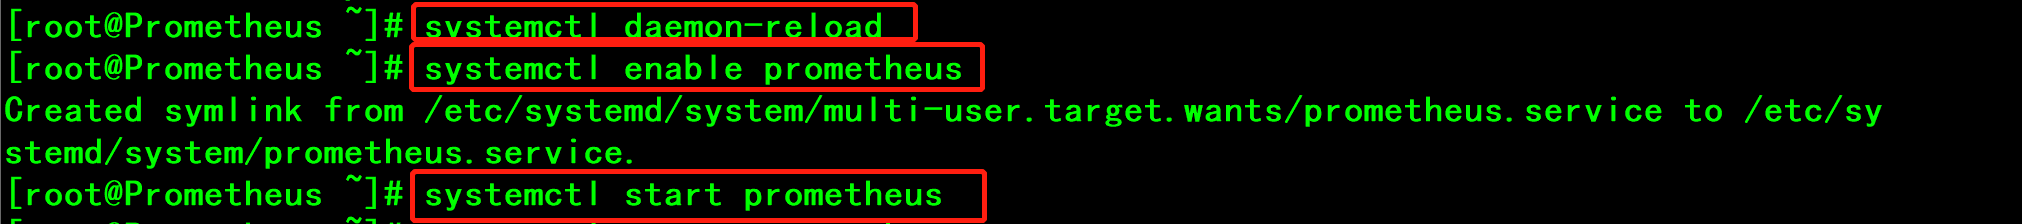
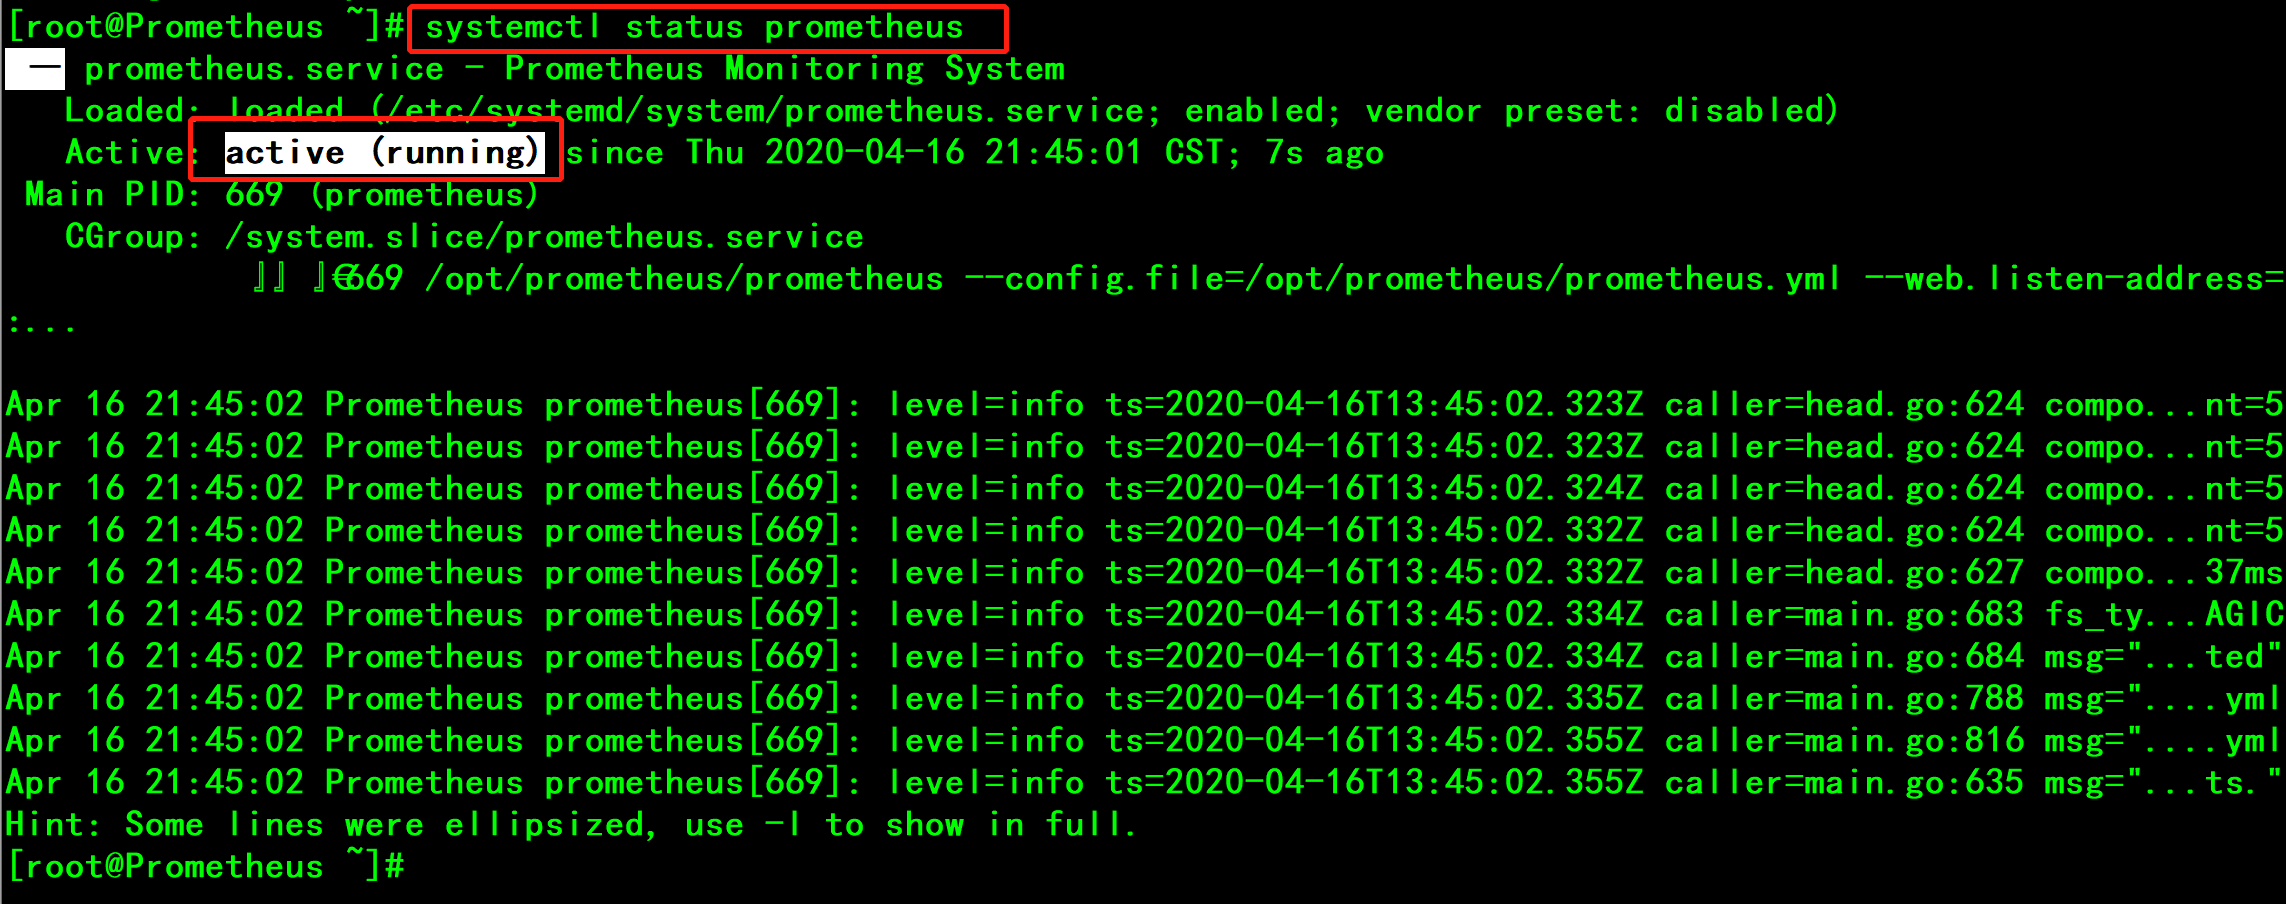
1 systemctl daemon-reload                        //启动服务
2 systemctl enable prometheus                  //设置开机自启动
3 systemctl start prometheus                     //启动服务
4 systemctl status prometheus                   //检查Prometheus服务开启状态
六、安装Gafana
Prometheus自带的监控页面显示的内容没有那么直观,需要安装grafana来使监控数据看起来更加直观
6.1 安装Grafana软件包(之前已上传至OPT文件夹)
1 cd /opt //进入OPT文件夹下
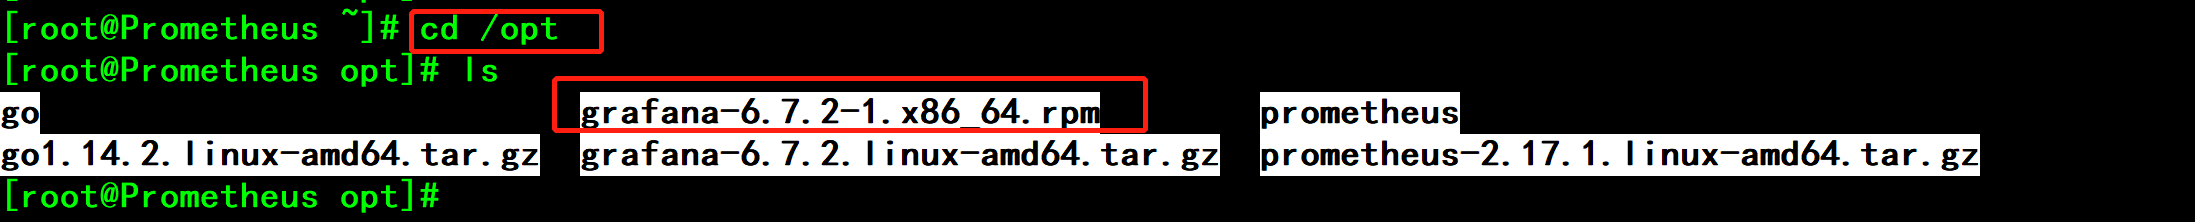
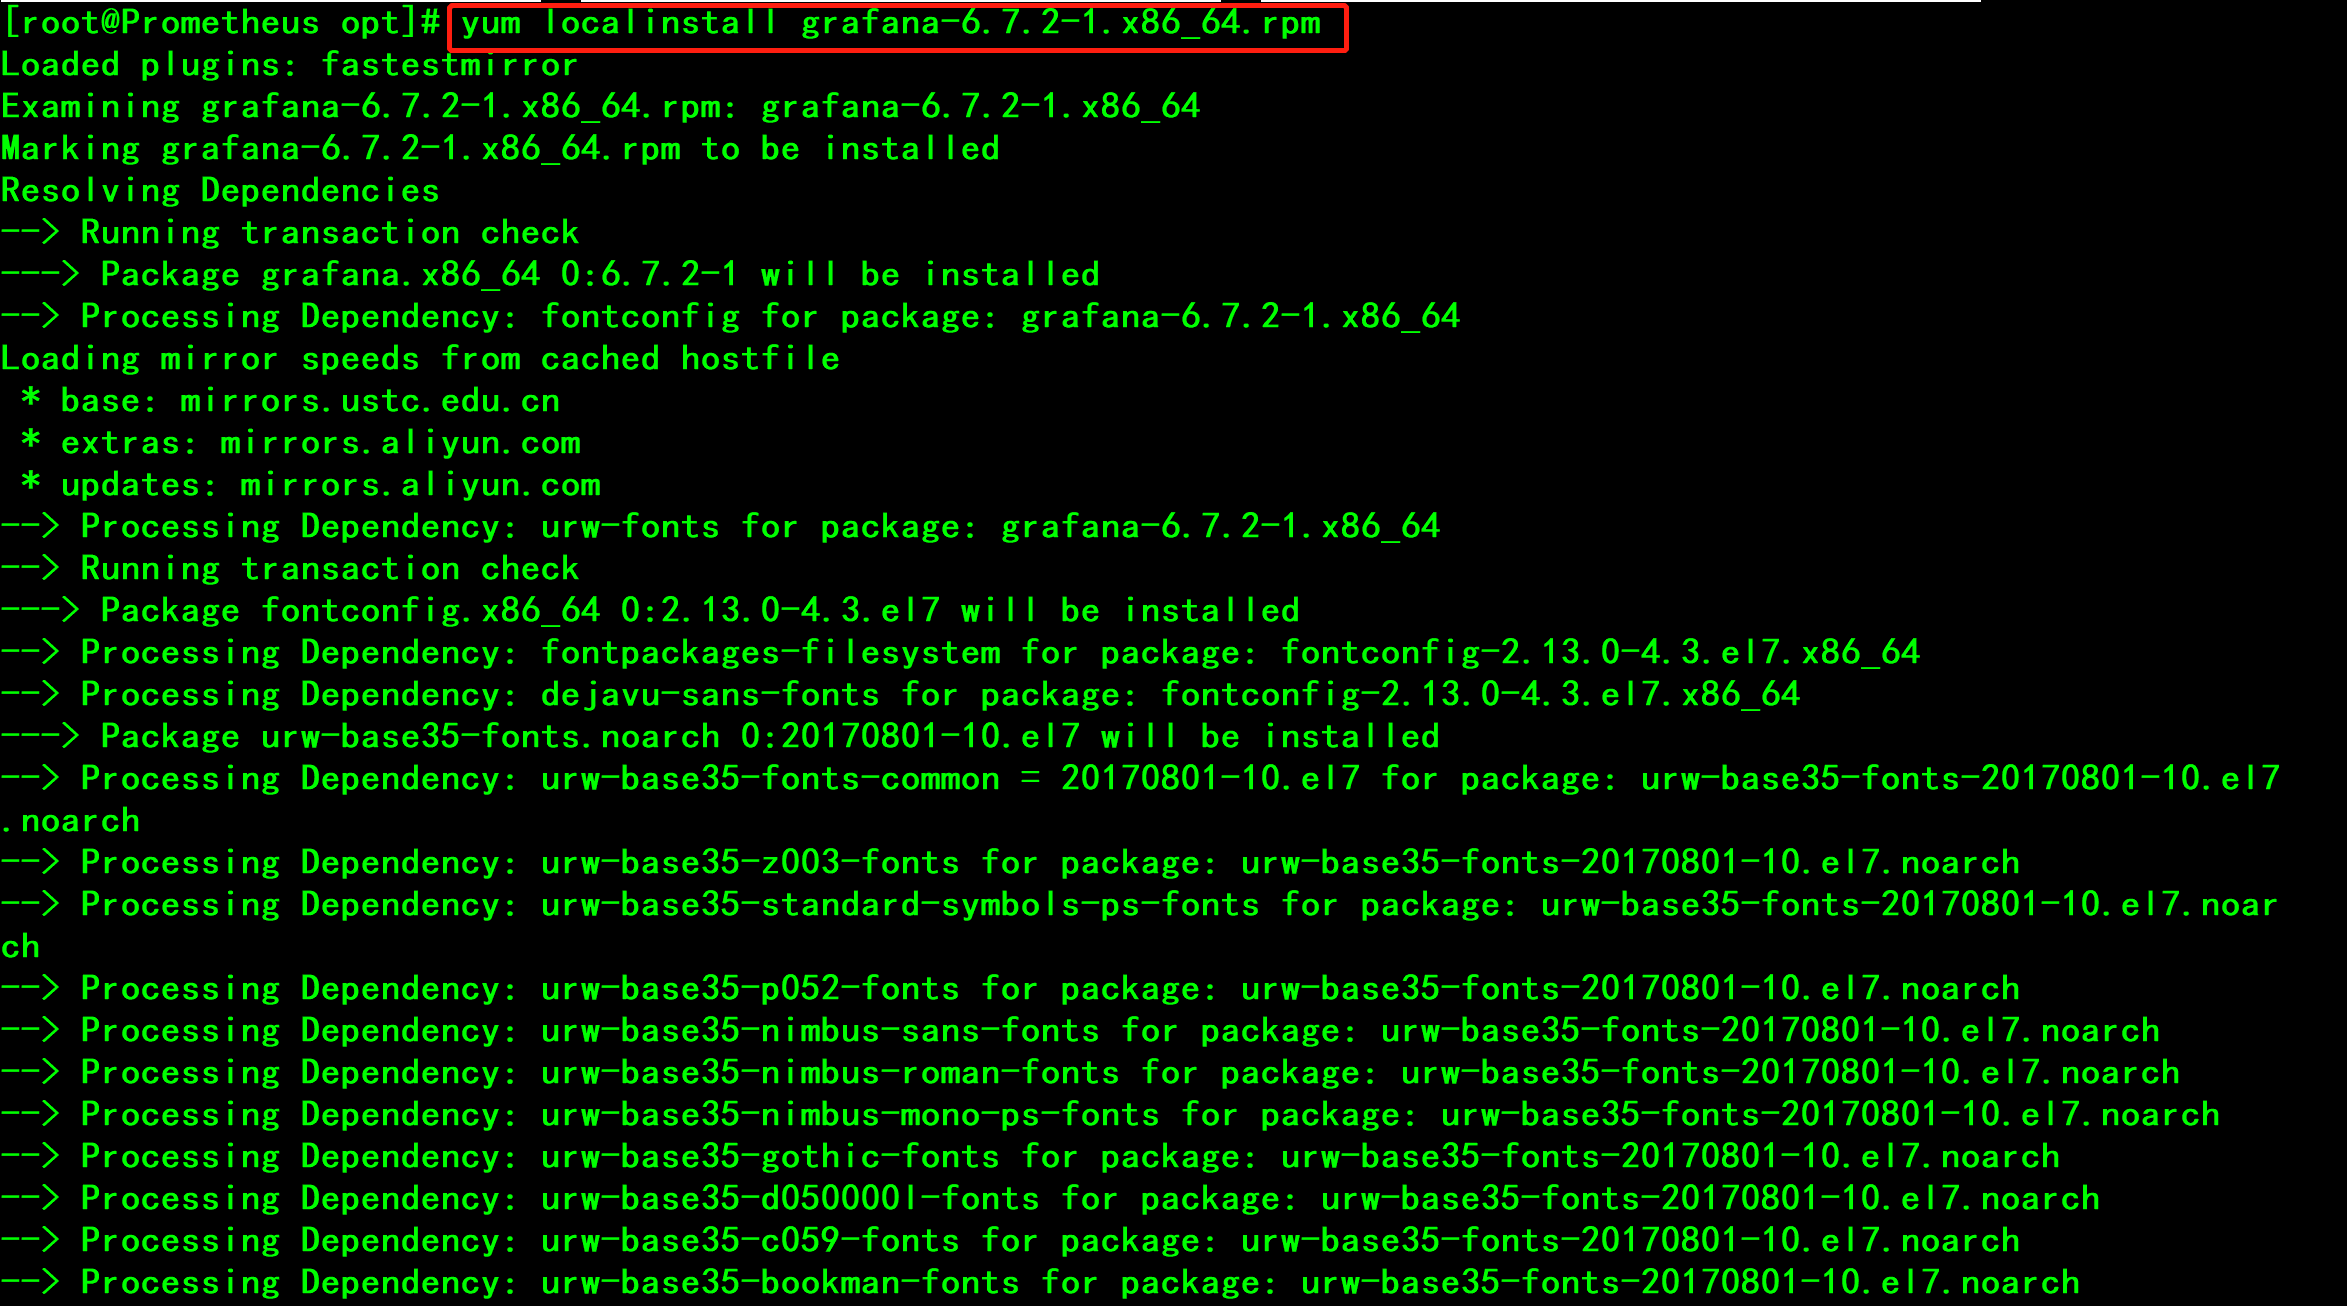
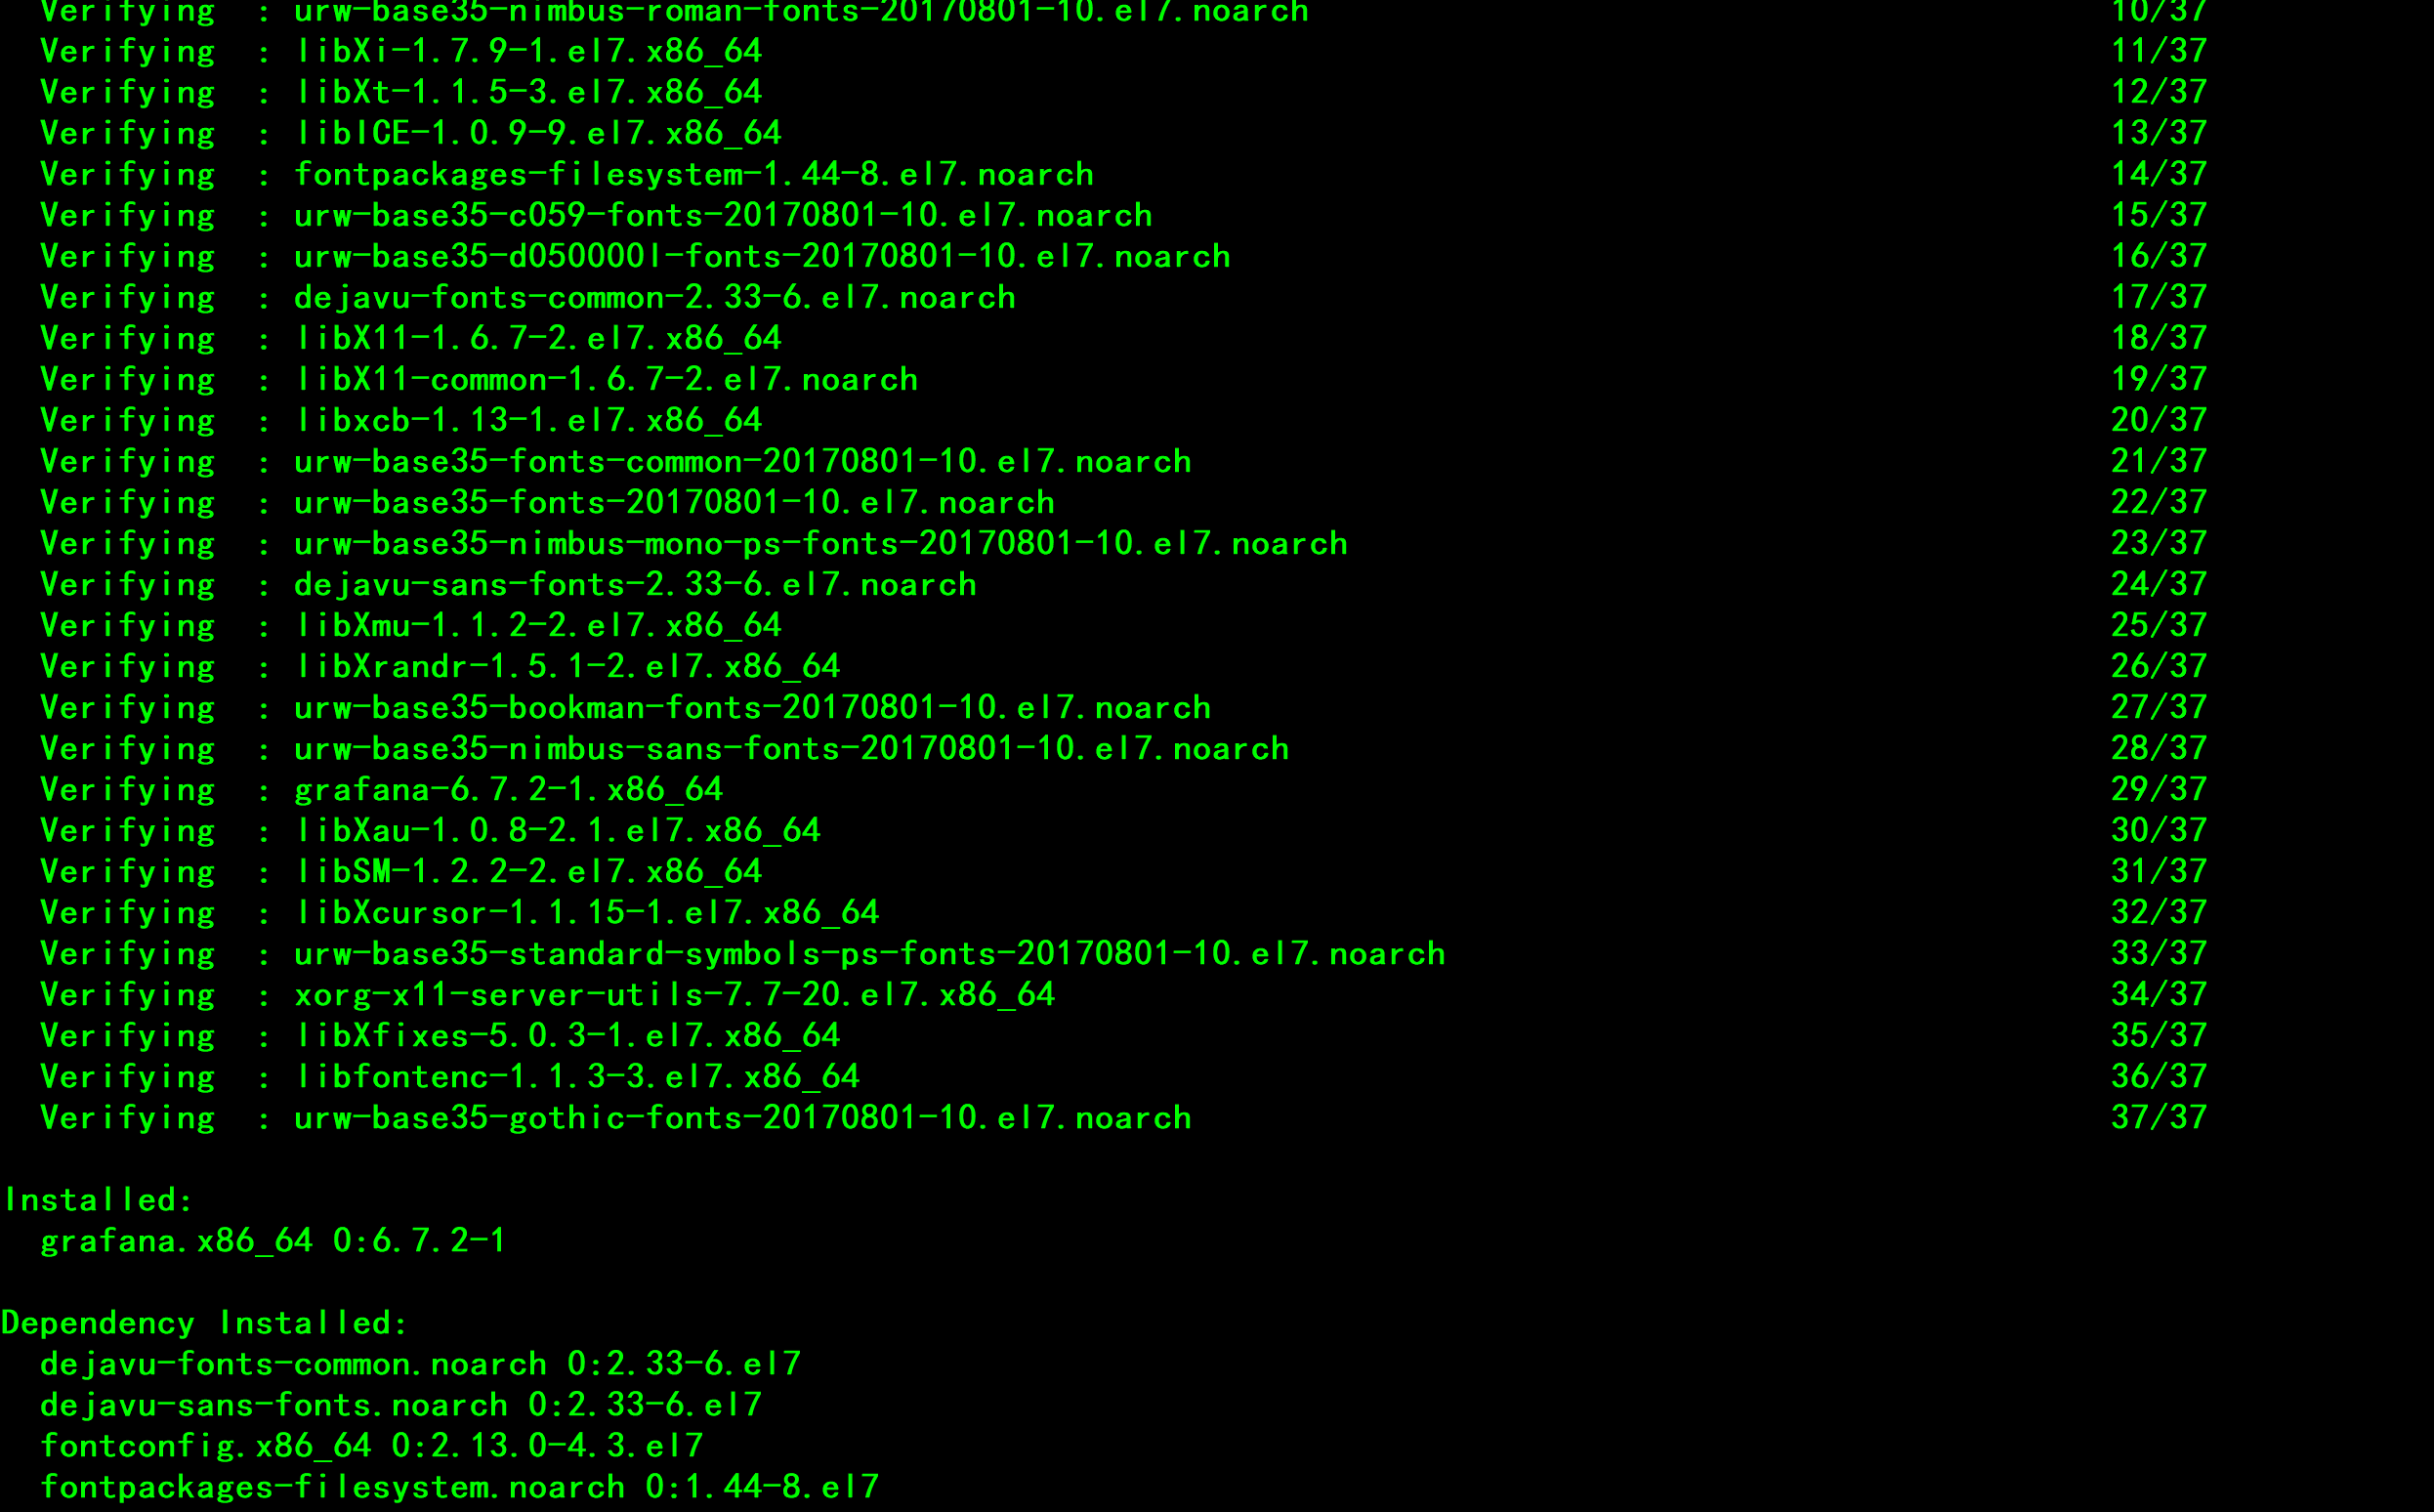
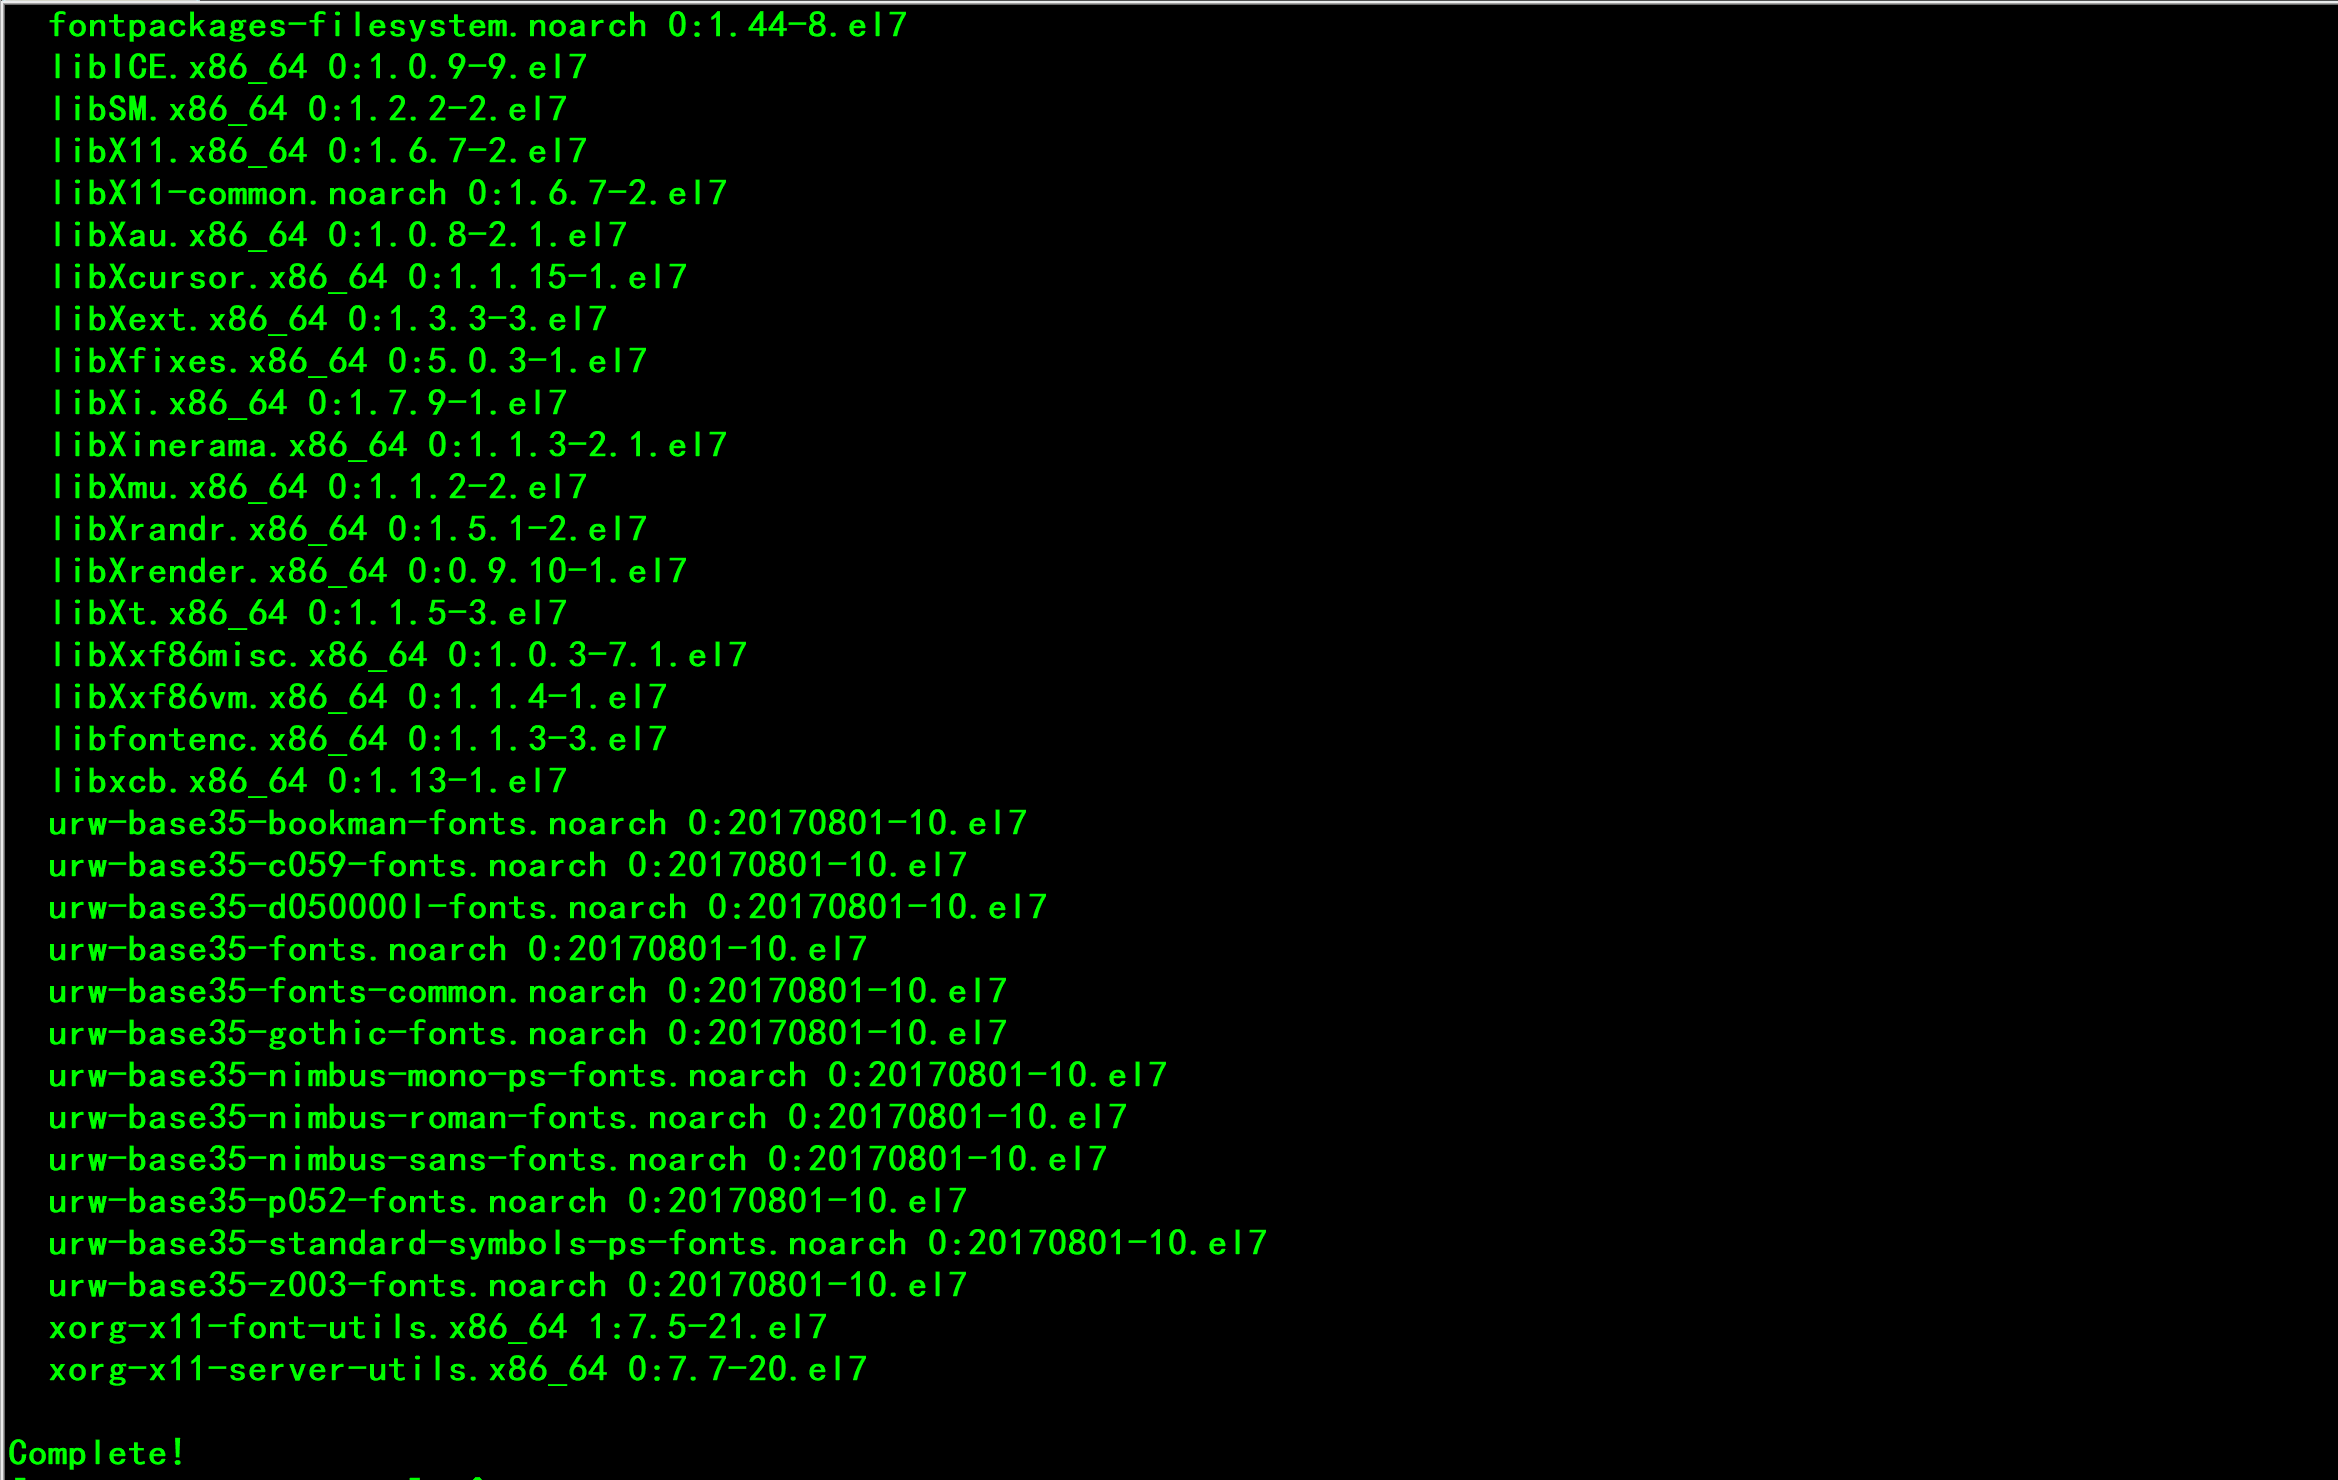
1 yum localinstall grafana-6.7.2-1.x86_64.rpm -y //YUM本地安装Grafana
6.2 启动Grafana
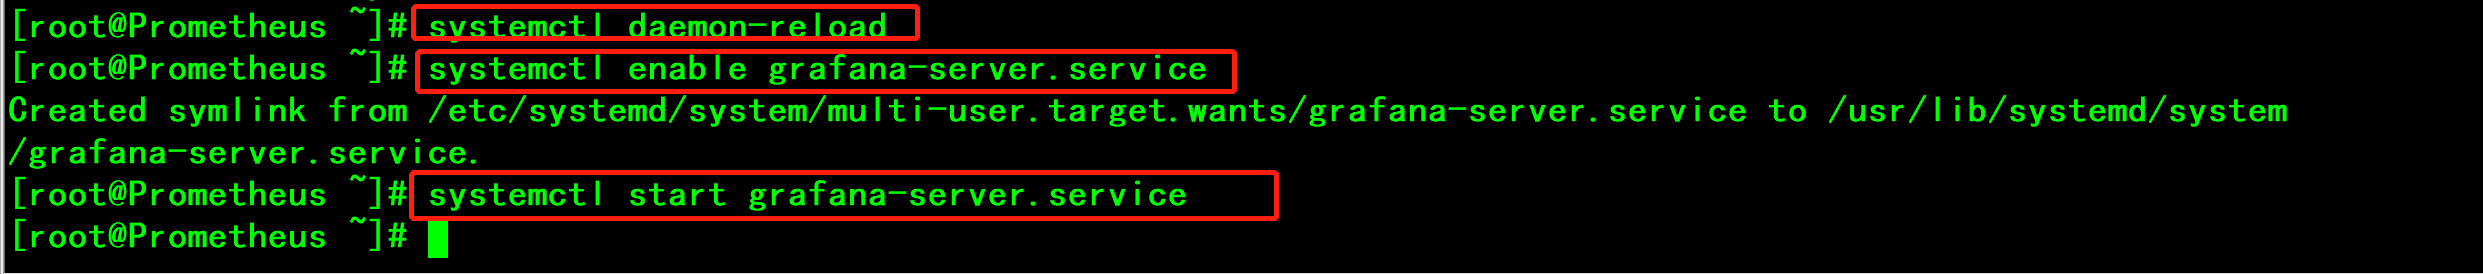
1 systemctl daemon-reload
2 systemctl enable grafana-server.service
3 systemctl start grafana-server.service
6.3 访问Grafana
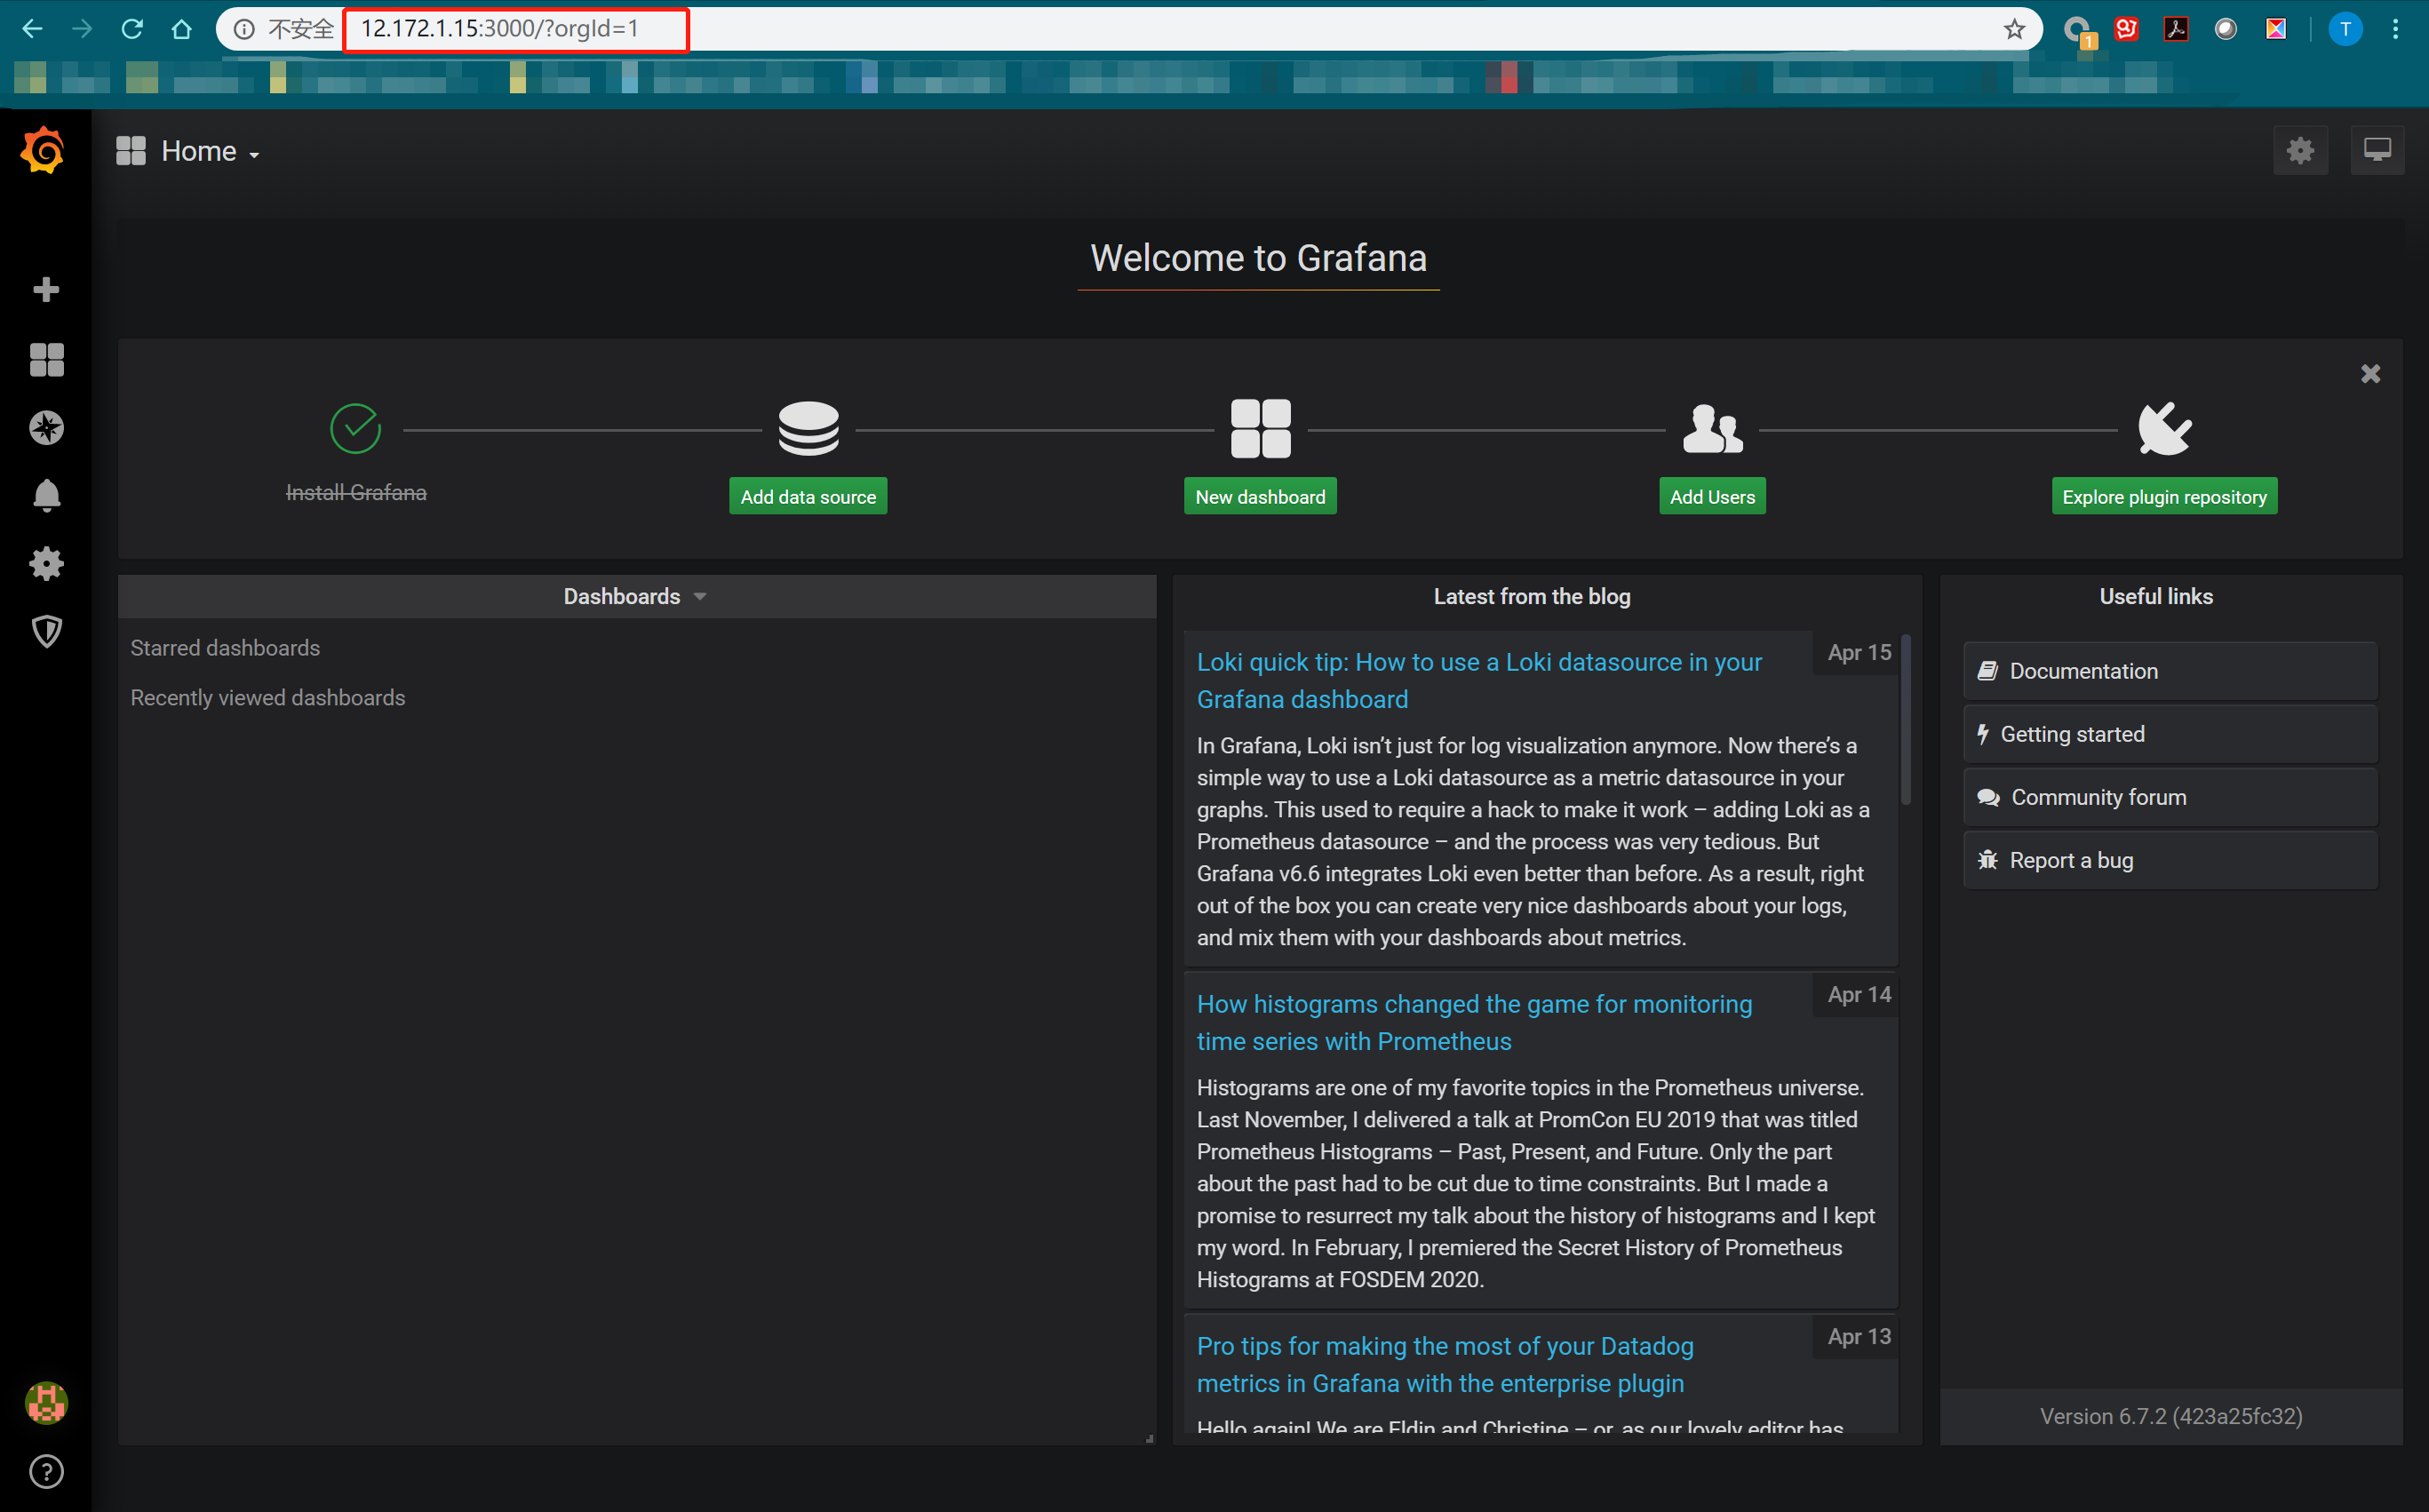
浏览器访问http://12.172.1.15:3000即可打开grafana页面,默认用户名密码都是admin,初次登录会要求修改默认的登录密码
七、添加Prometheus数据源
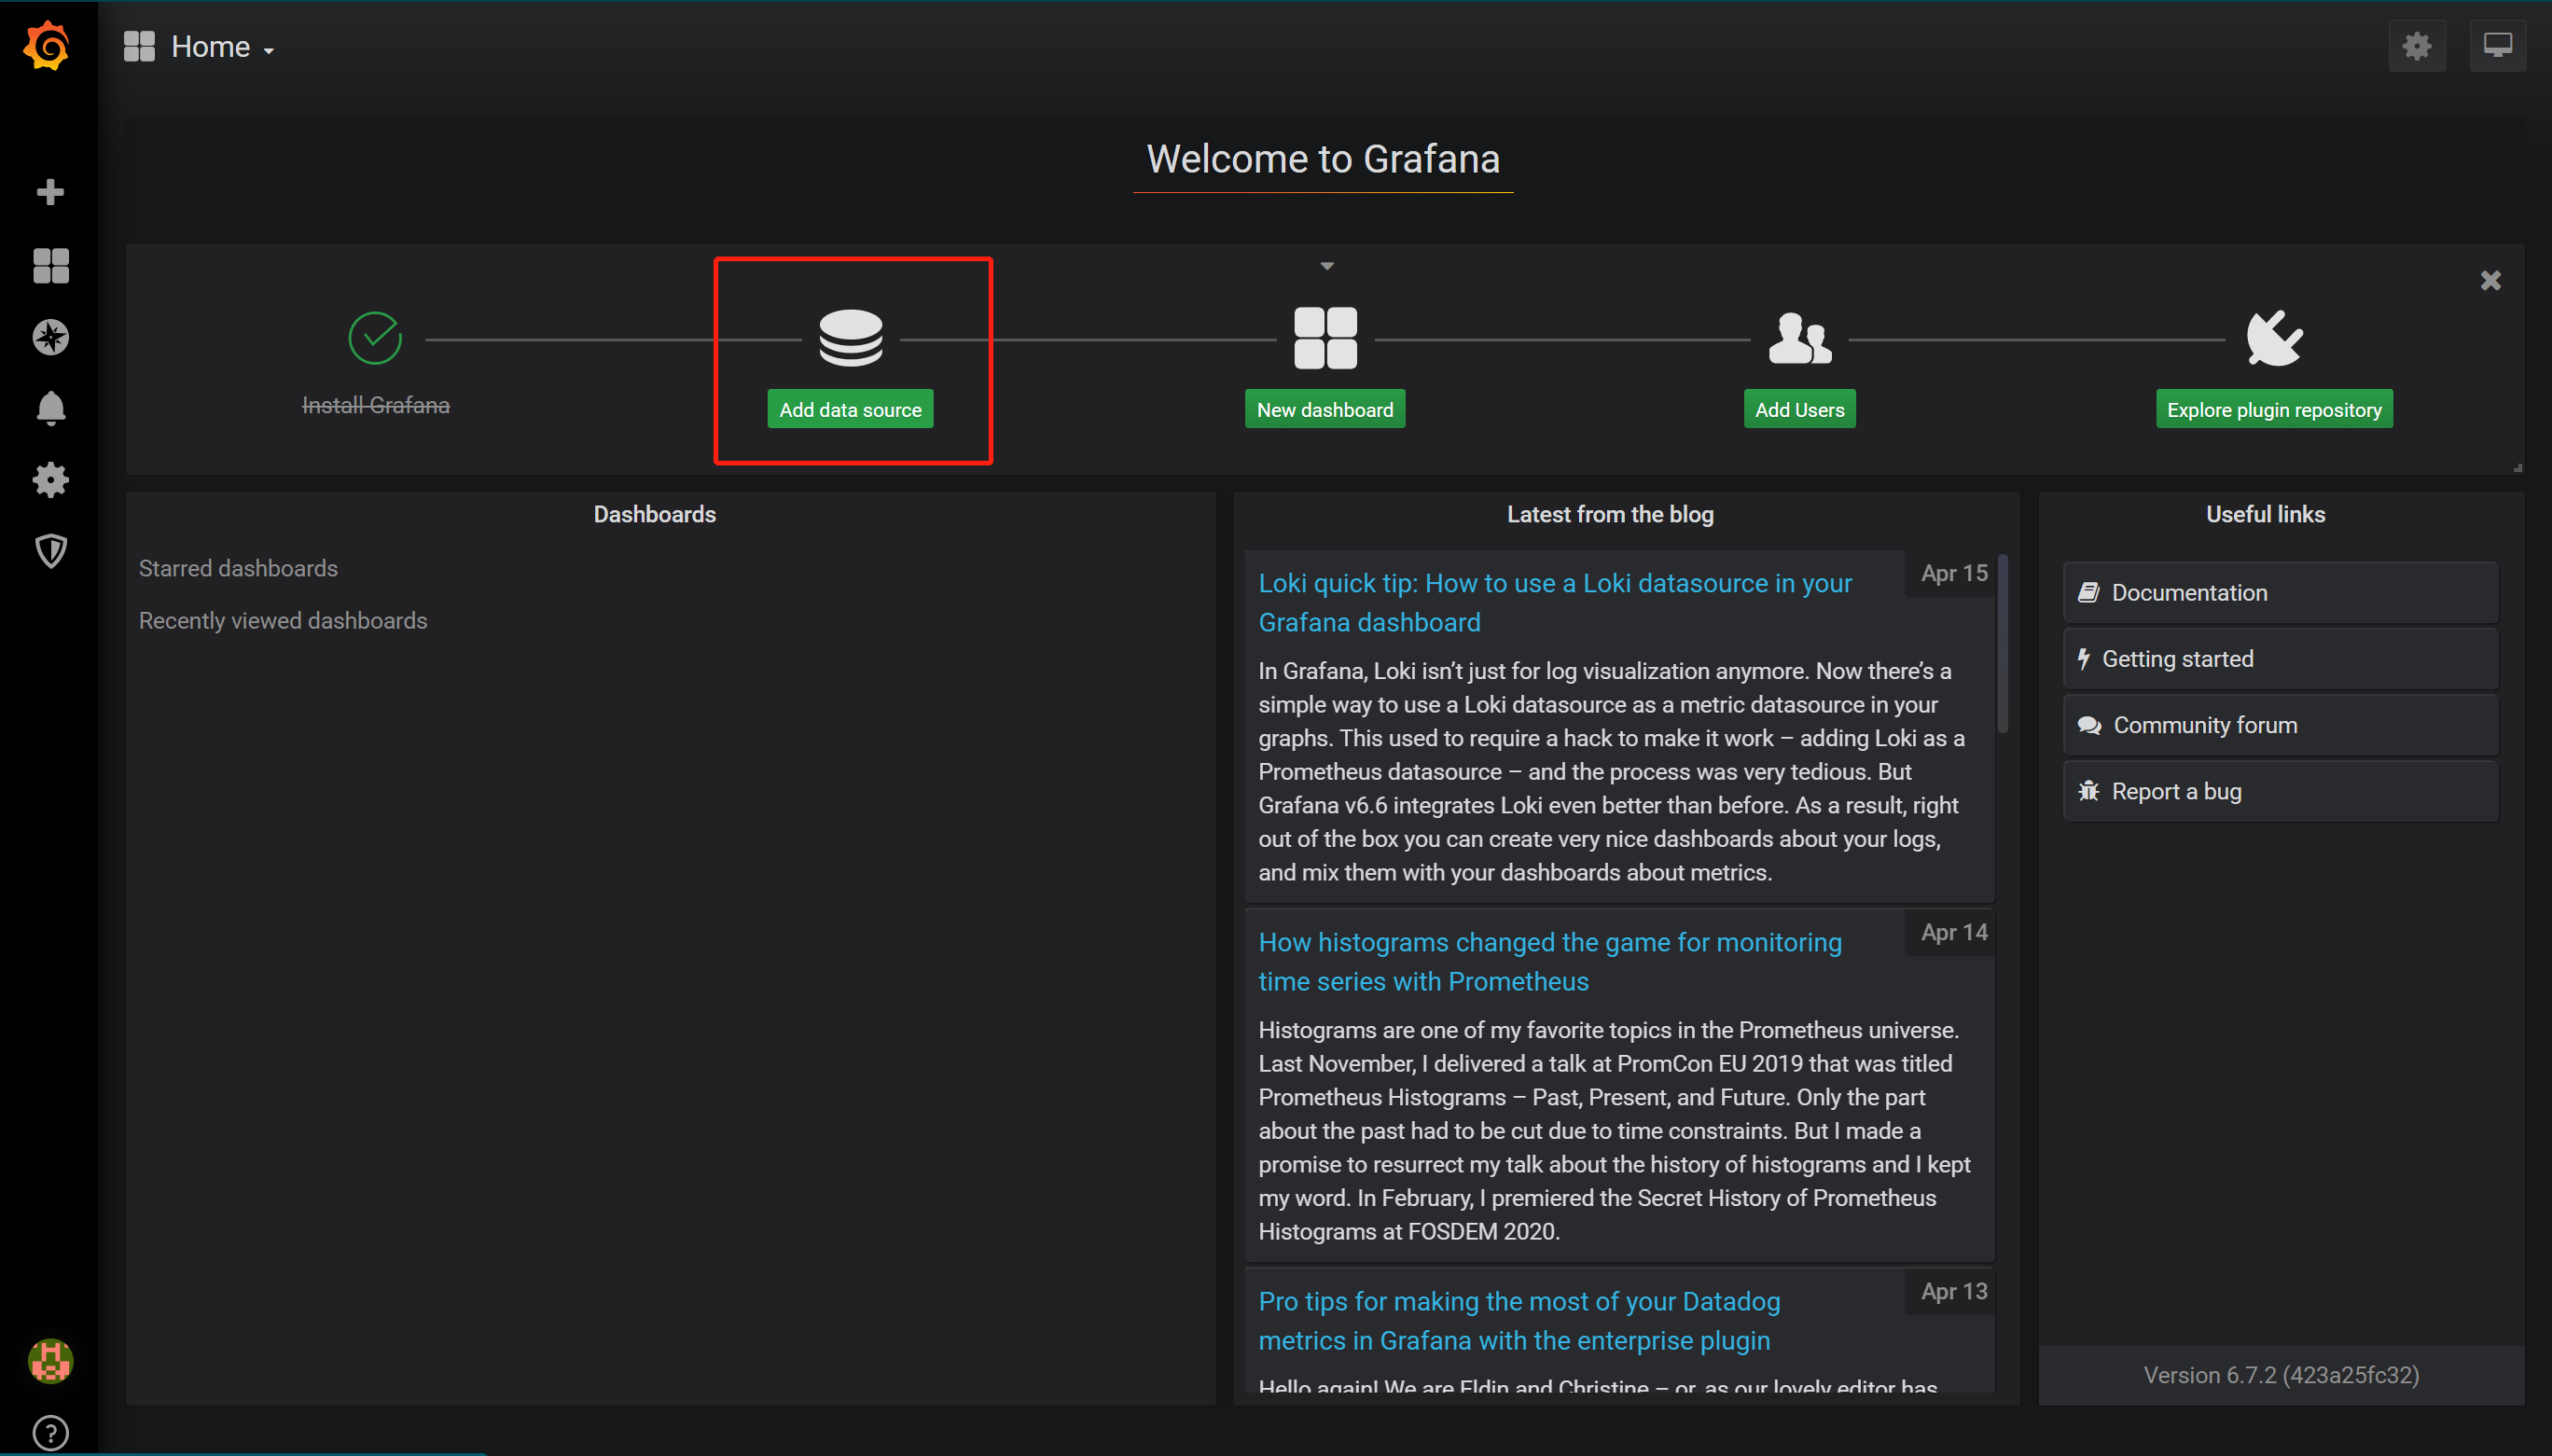
7.1 点击主界面“Add data source”
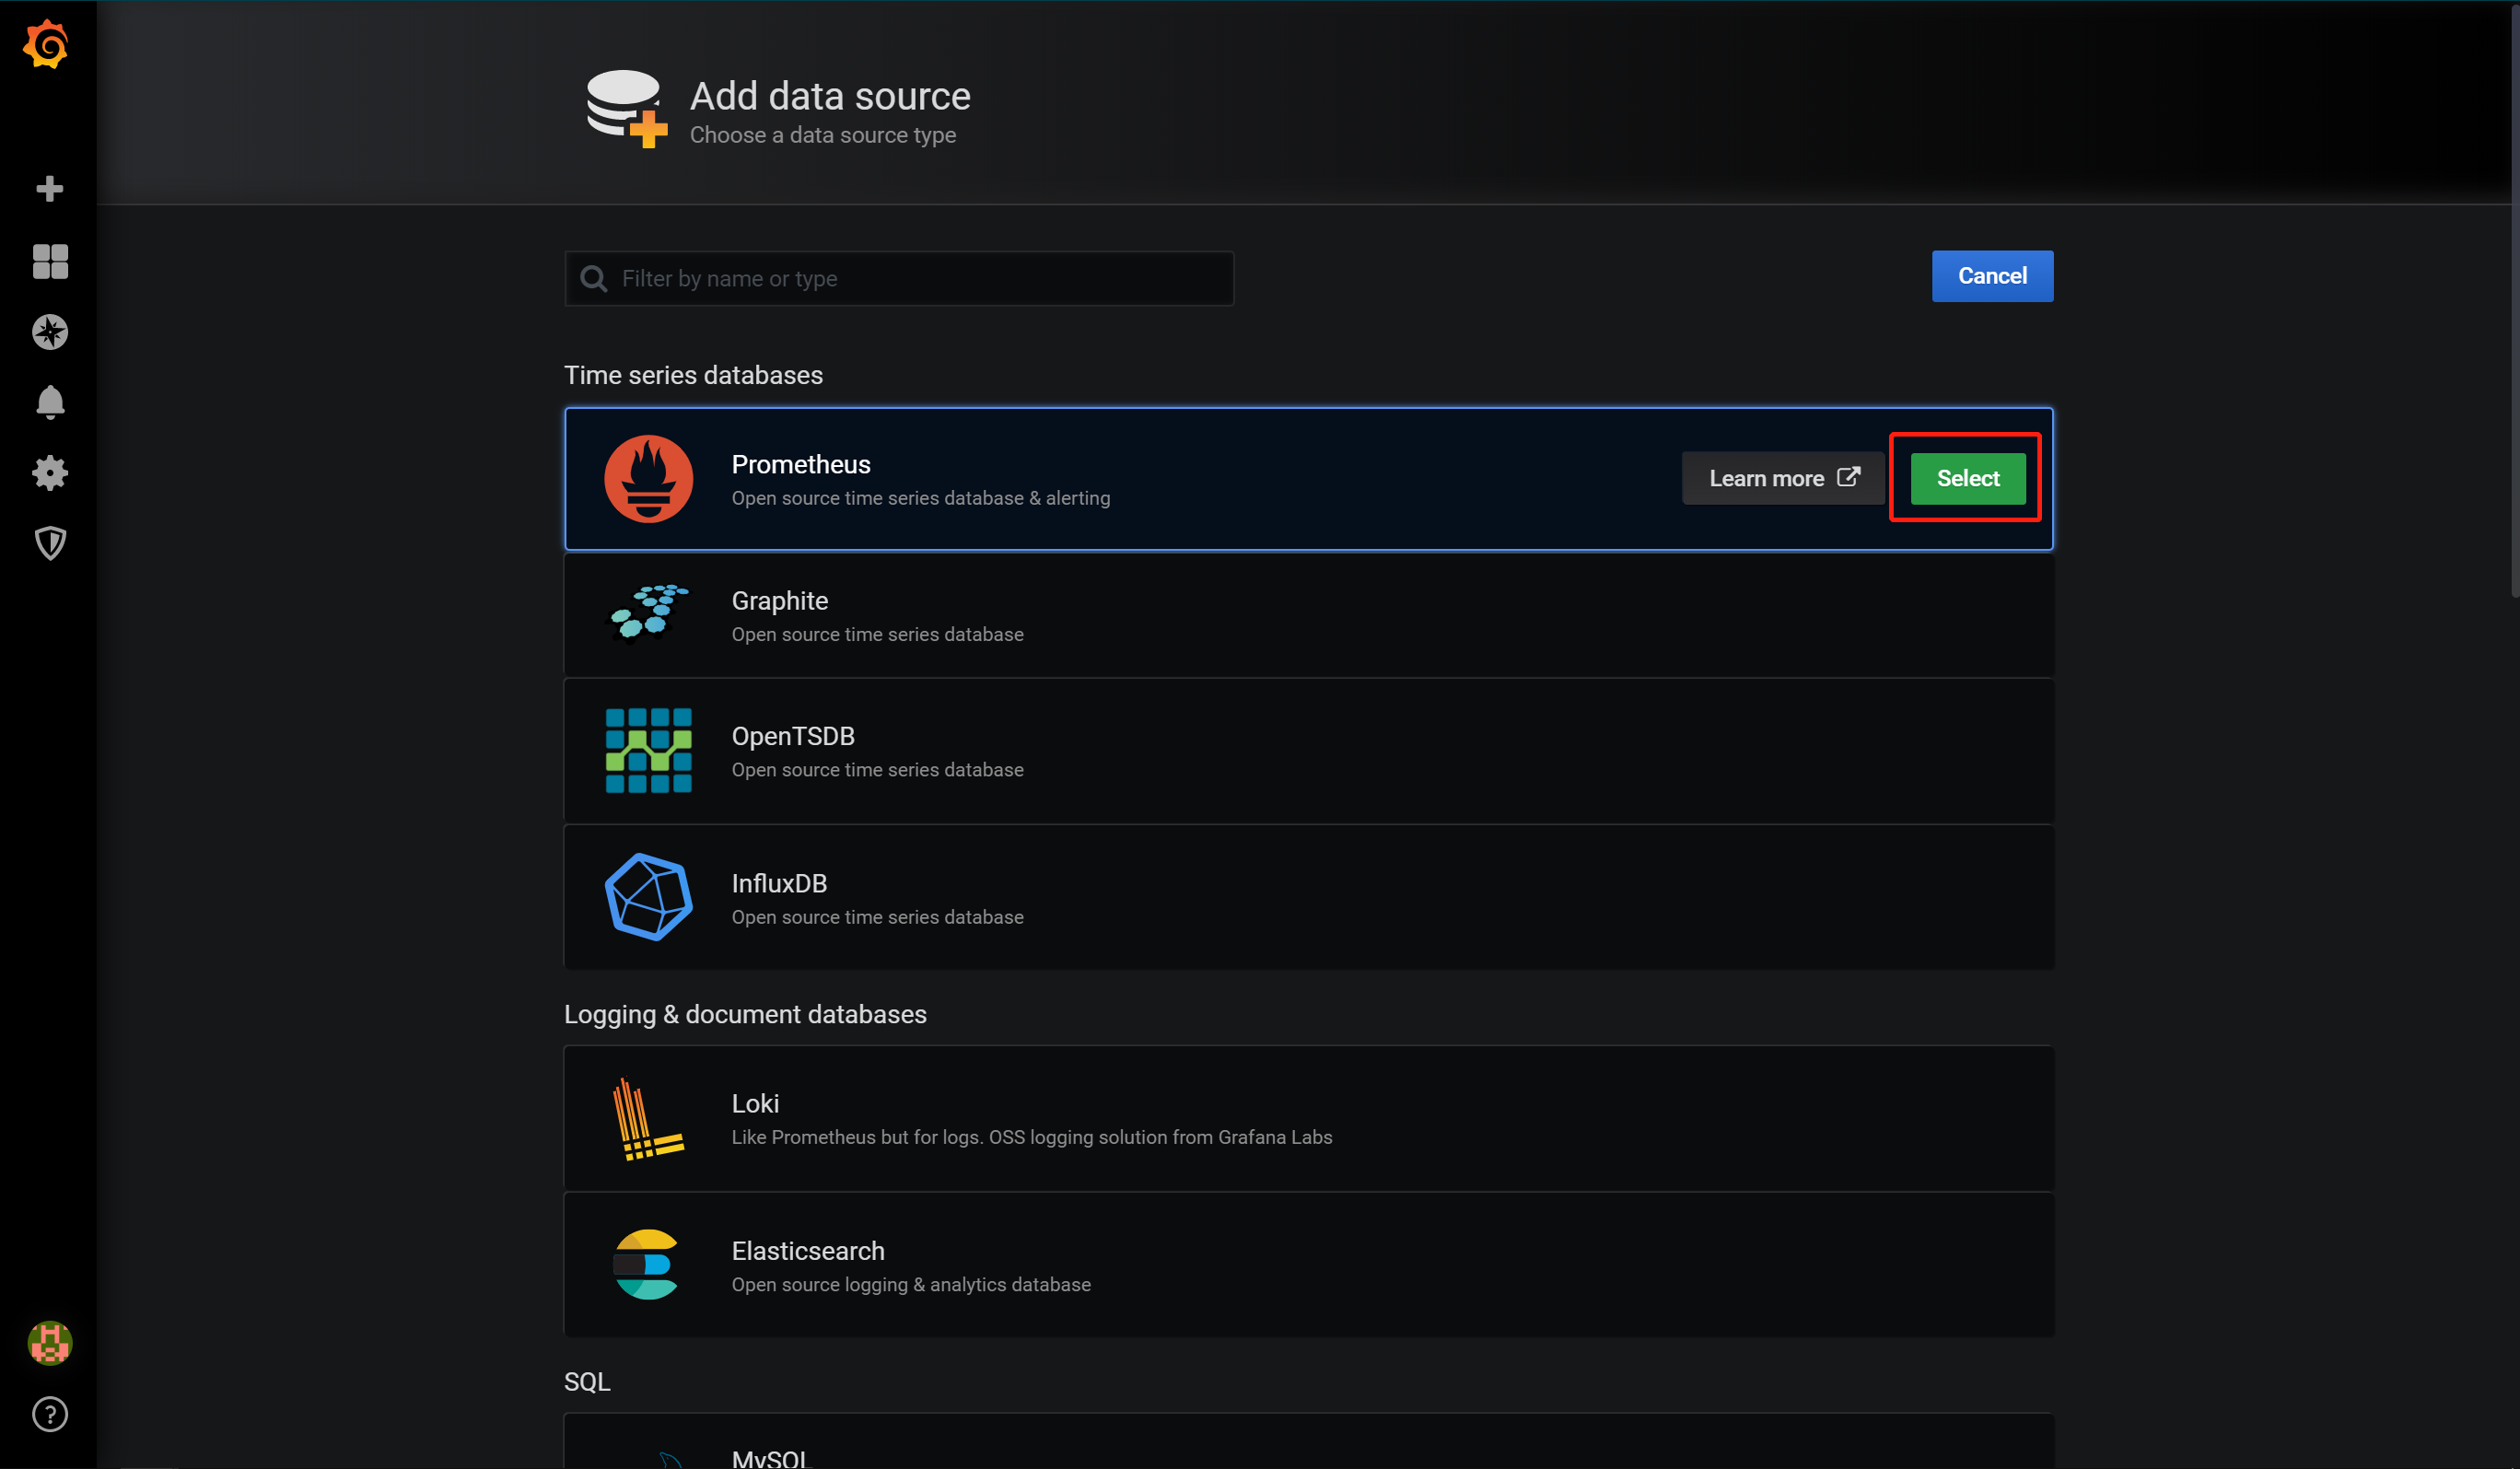
7.2 选择Prometheus
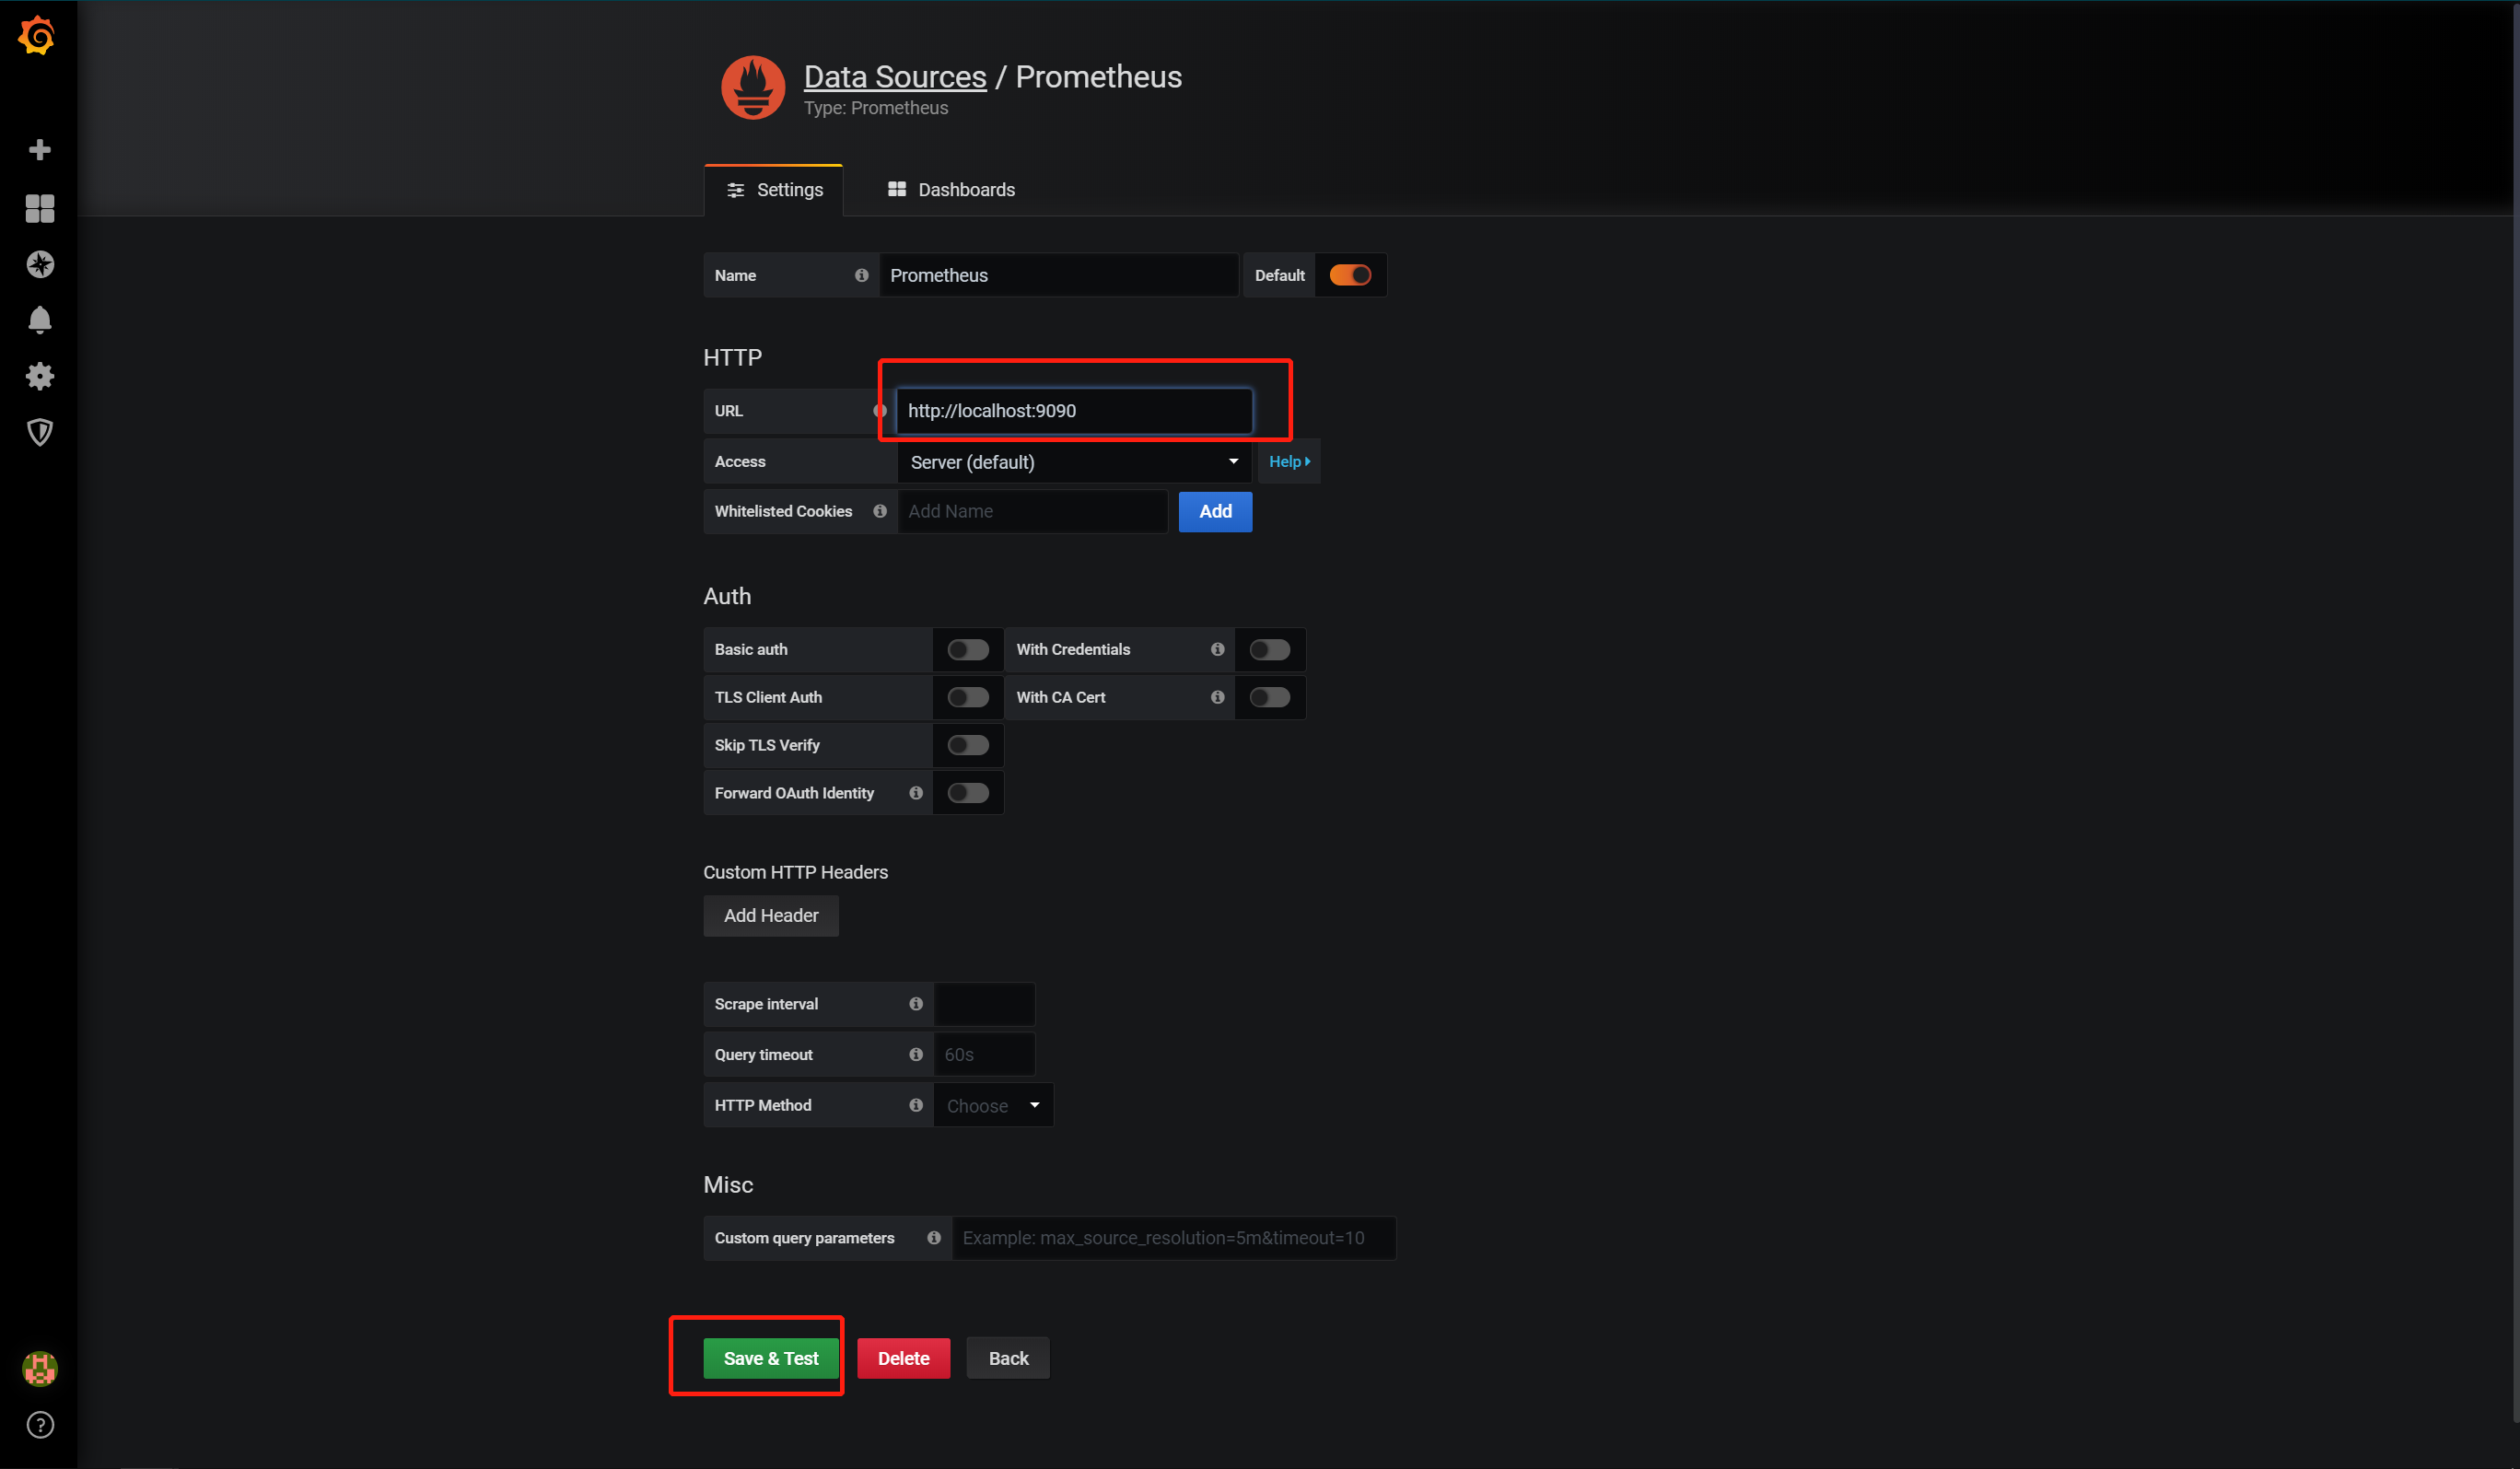
7.3 填写数据源设置项
URL处填写Prometheus服务所在的IP地址,此处我们将Prometheus服务与Grafana安装在同一台机器上,直接填写localhost即可
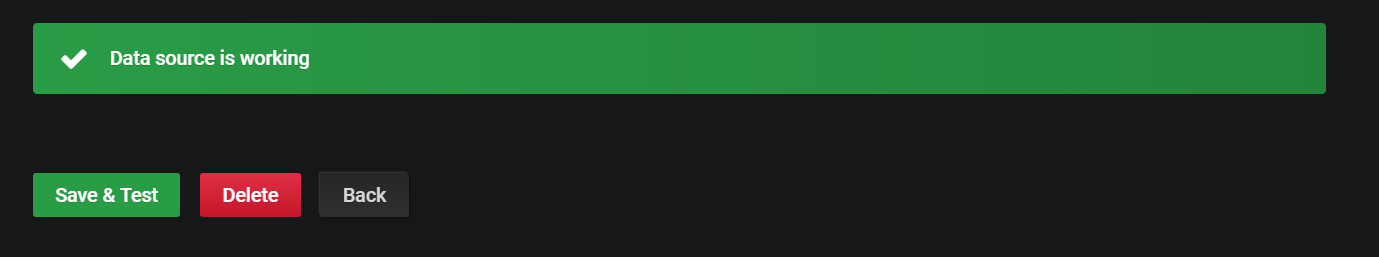
点击下方 【Save & Test】按钮,保存设置
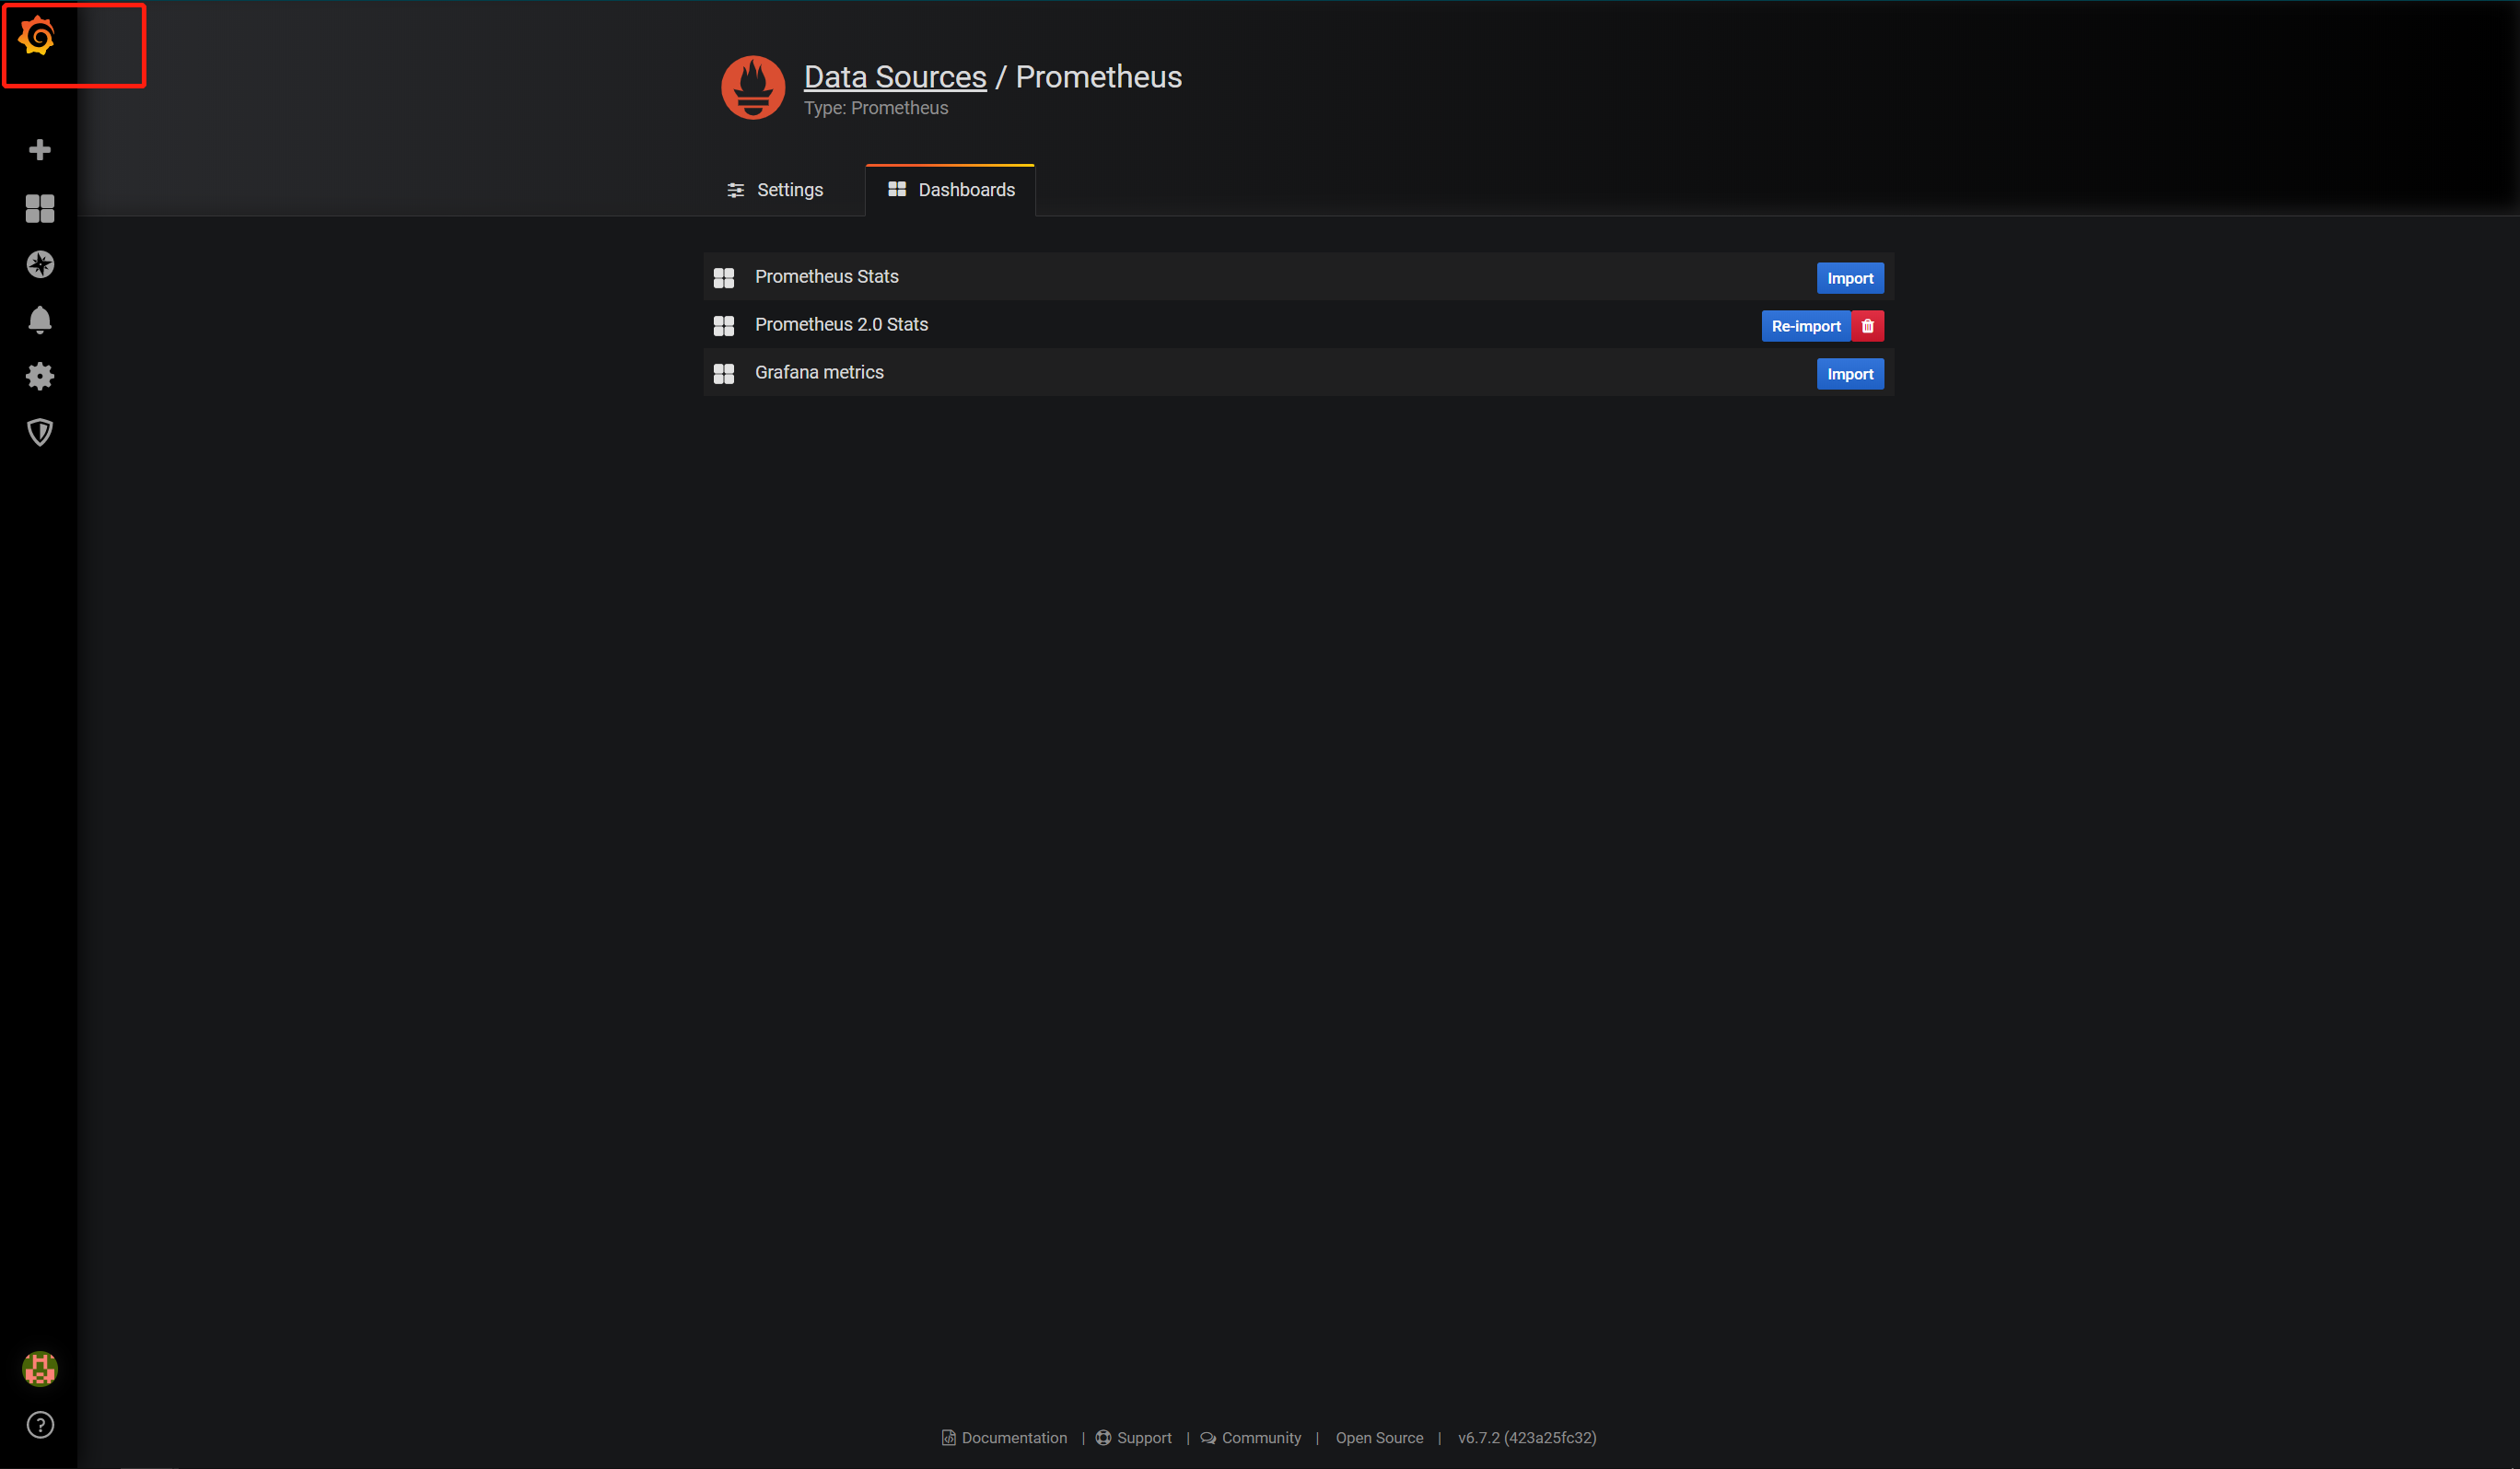
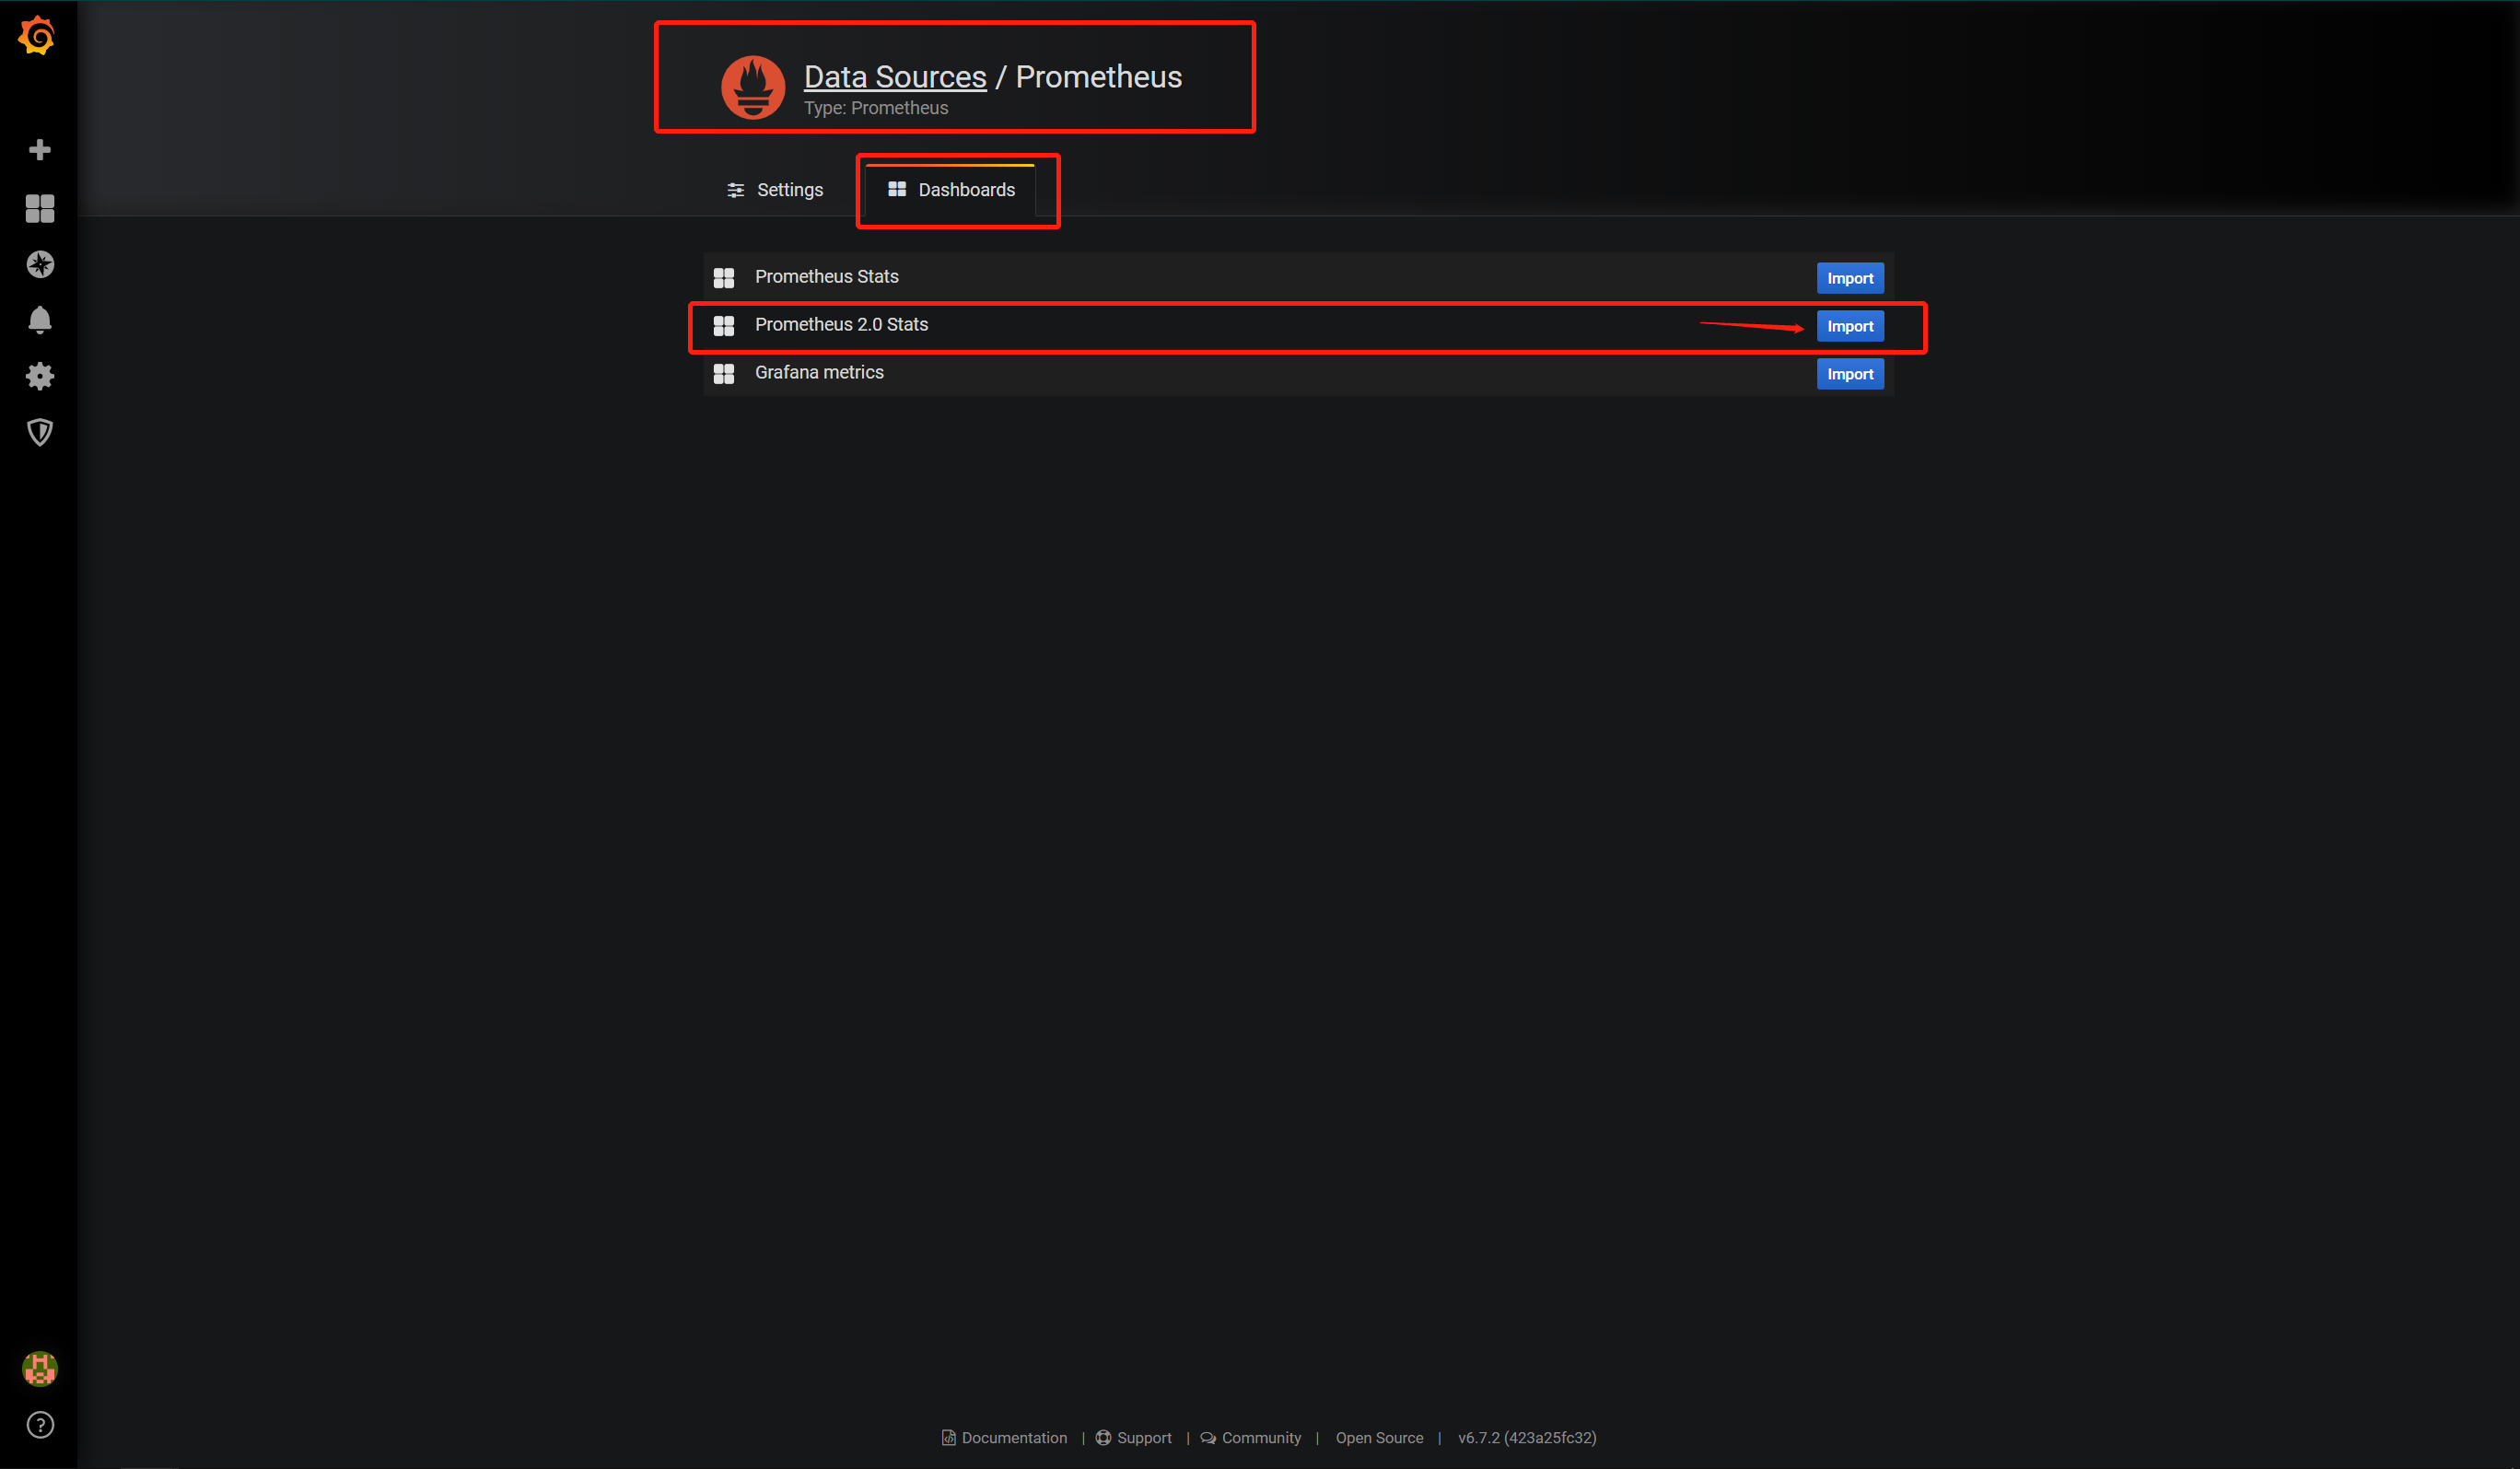
7.4 Dashboards页面选择“Prometheus 2.0 Stats”
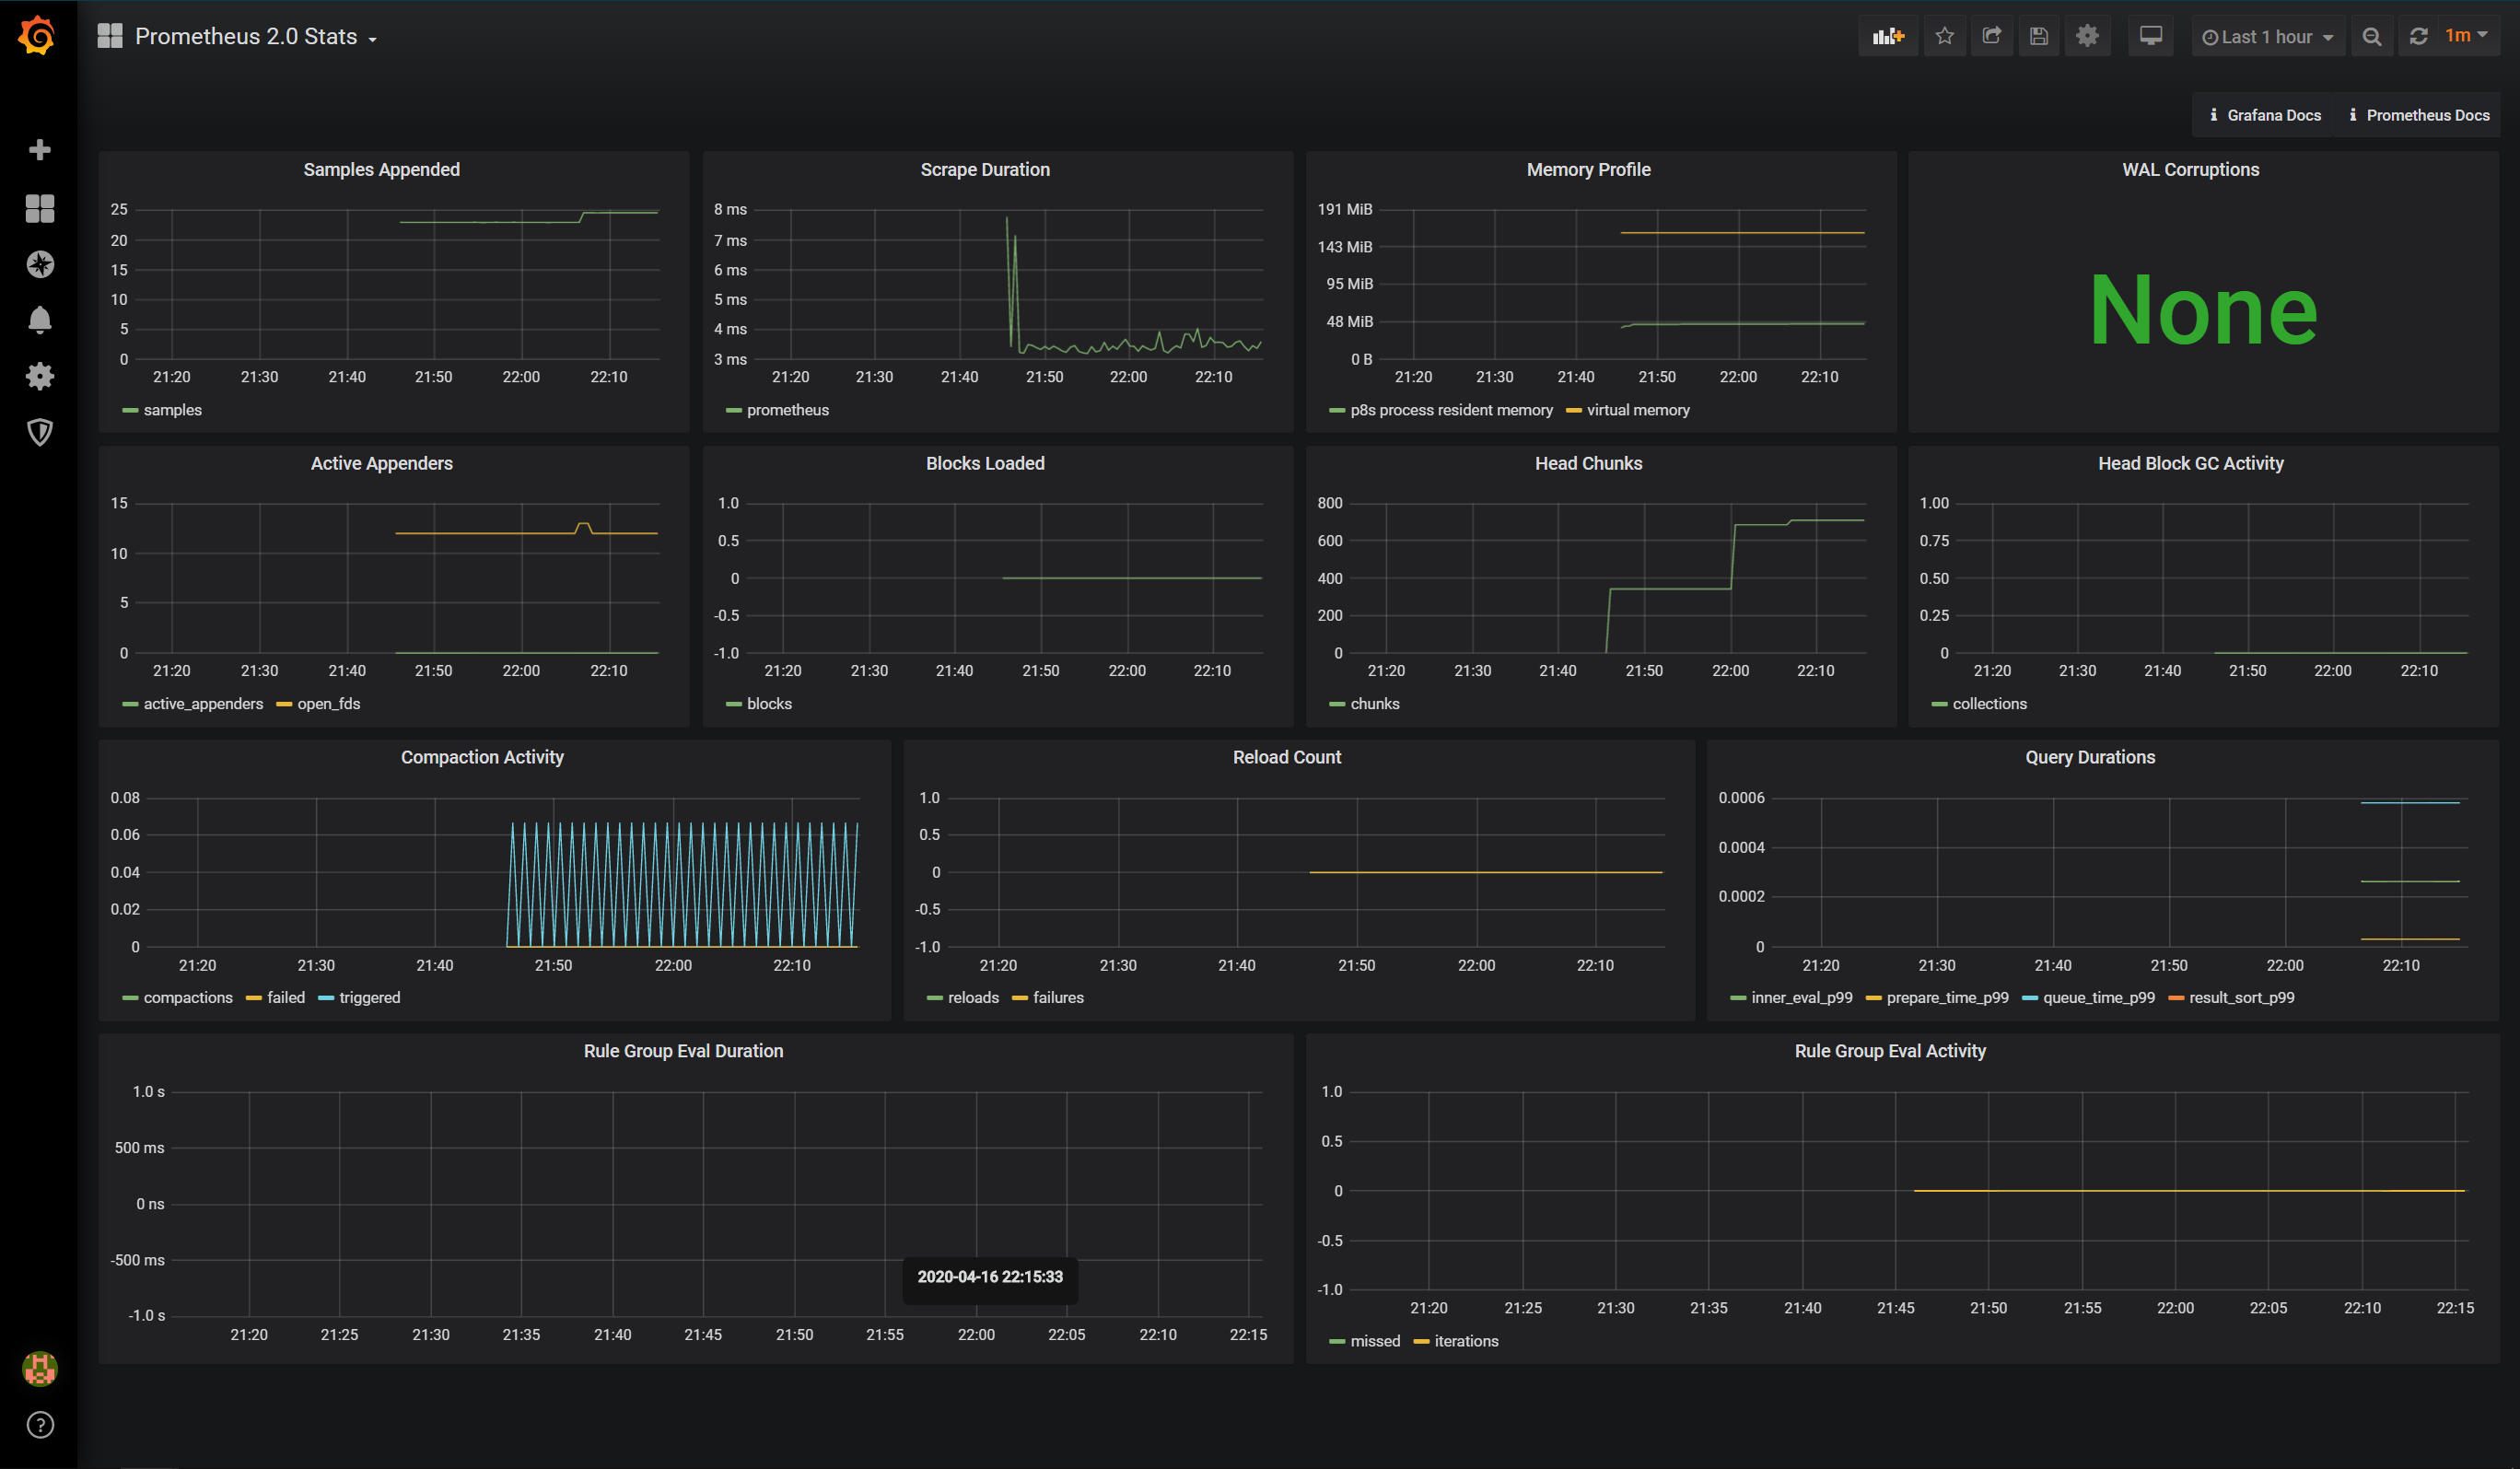
7.5 查看监控
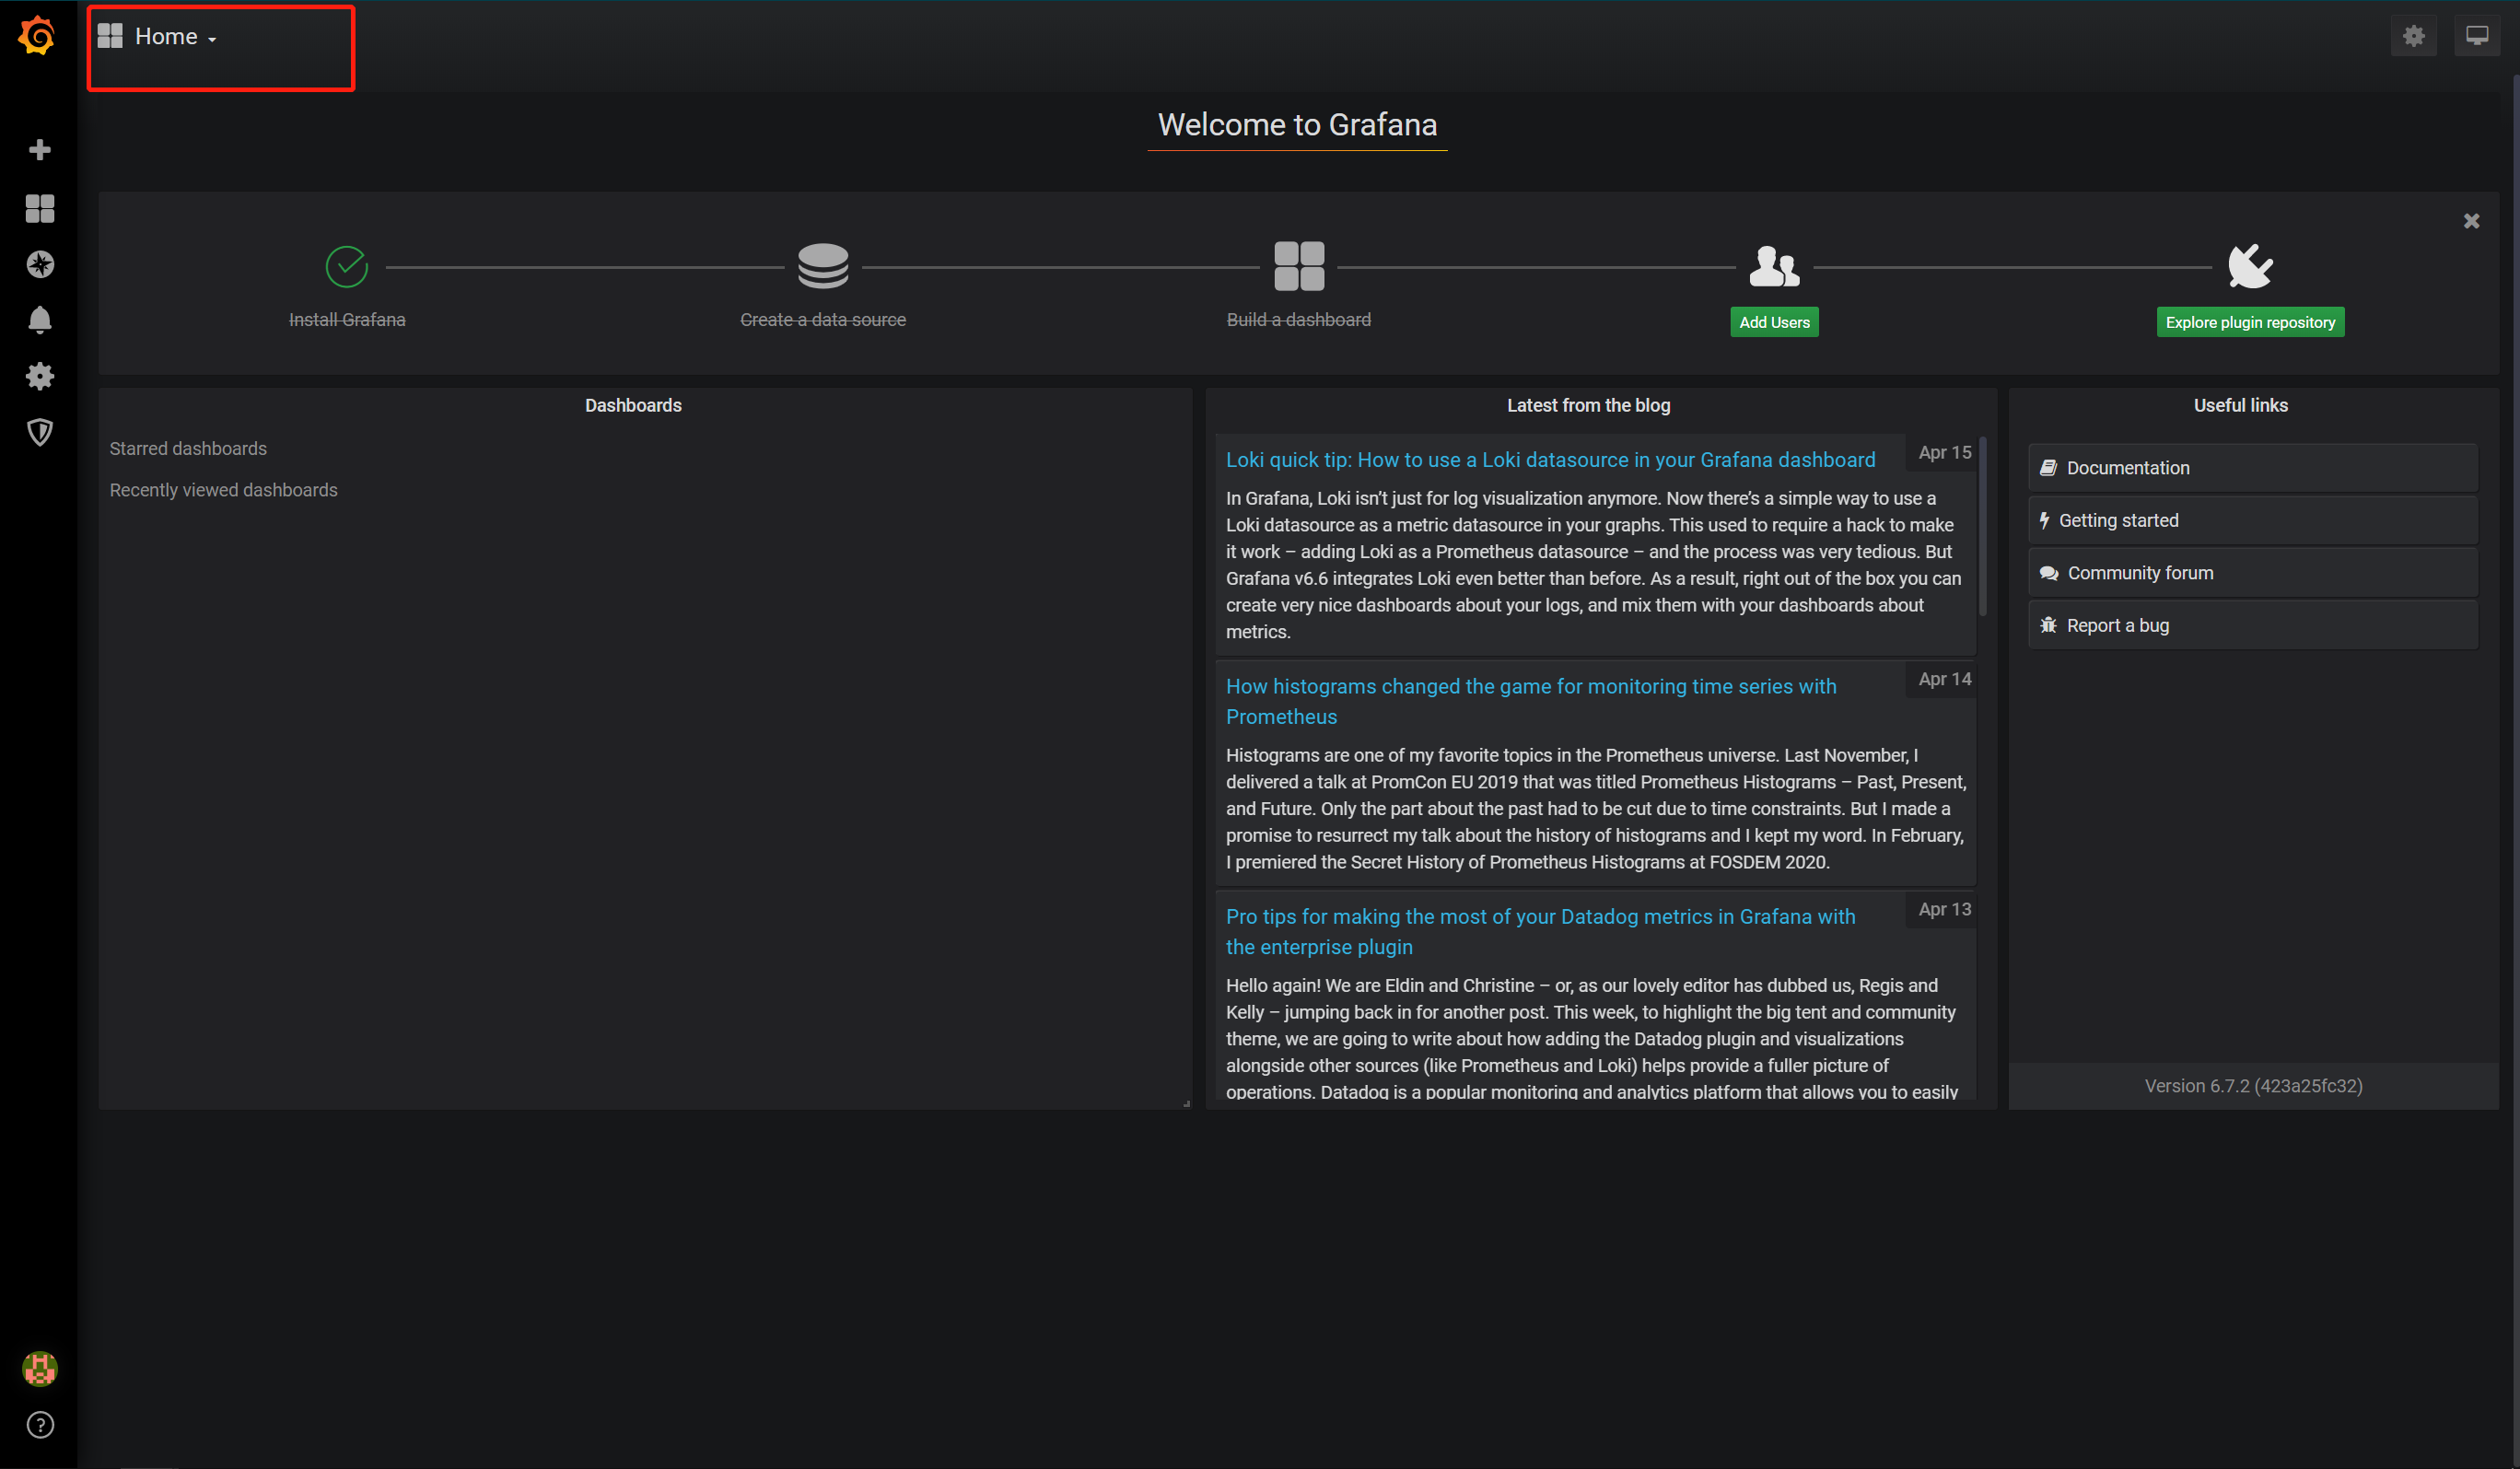
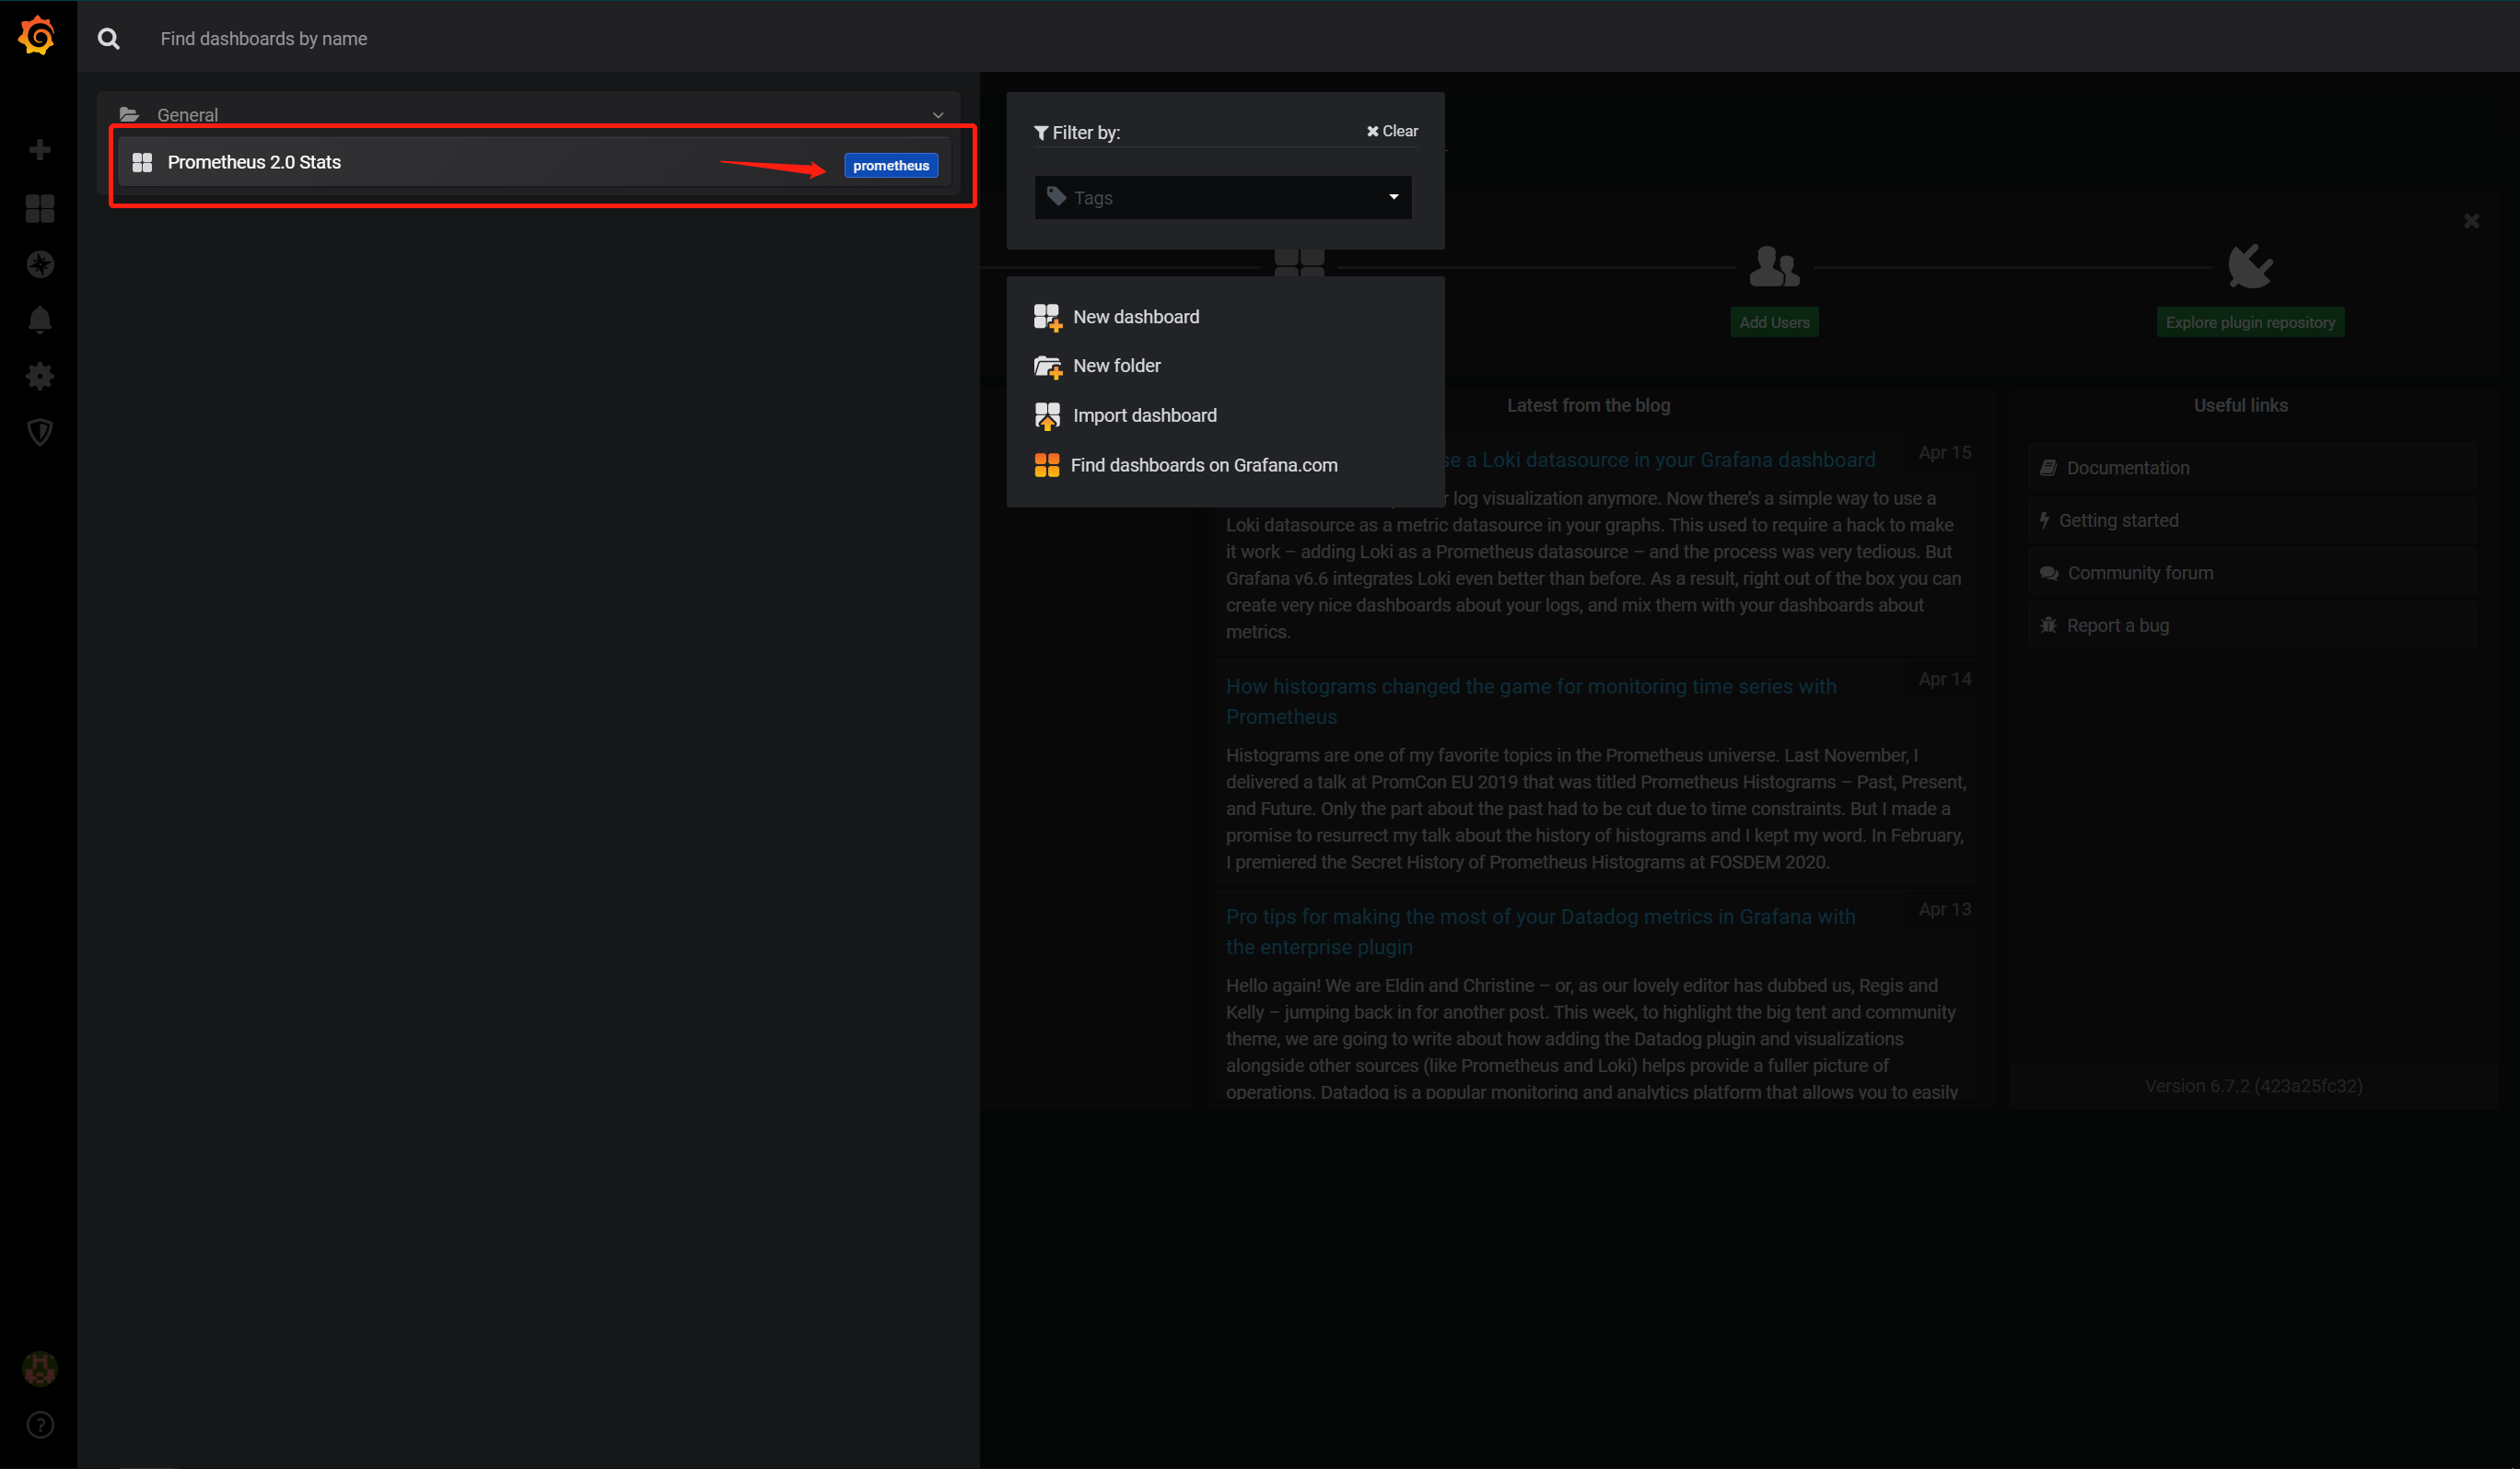
点击Grafana图标,切换到Grafana主页面,然后点击Home,选择我们刚才添加的Prometheus 2.0 Stats,即可看到监控数据