python+vue 从mongodb中获取数据使用eCharts渲染
爬虫代码:
爬取数据存入MongoDB数据库中
import requests
import pymongo

# 链接
mongo_client = pymongo.MongoClient(host="localhost", port=27017)
url = 'https://data.gtimg.cn/flashdata/hushen/latest/daily/sz000002.js?maxage=43201&visitDstTime=1'

headers = {
    "User-Agent": "Mozilla/5.0 (Windows NT 10.0; Win64; x64) AppleWebKit/537.36 (KHTML, like Gecko) Chrome/87.0.4280.88 Safari/537.36 FS"
}
res = requests.get(url=url, headers=headers)
res.encoding = 'gbk'
res = res.text
res = res.strip()
res = res.strip('latest_daily_data="')
res = res.strip()
res = res.rstrip('";')
res = res.split('\n\')
res = res[2:10]
# 实例化对象
db = mongo_client.stock
table = db.stock

b = 11
for i in res:
    date = "12月%s日" % b
    b += 1
    table.insert_one({"date": date, "volume": i[32:]})
    # print(date, i[32:])
从mongodb中获取数据第一种方式
之前在数据库里存了爬取的数据
import pymongo
import pandas as pd	# 需要pip安装
# 链接
mongo_client = pymongo.MongoClient(host="localhost", port=27017)
# 实例化对象
db = mongo_client.stock
table = db.stock

class StockView(APIView):
    def get(self, request):
        #find_one 获取一条数据
        data = pd.DataFrame(list(table.find()))
        # 选择需要显示的字段
        data = data[['date', 'volume']]
        # print(data)

        return Response({'code': 200, 'data': data})
从mongodb中获取数据第二种方式:个人倾向第一种
    def get(self, request):
        date = []
        volume = []
        # 查询全部
        for i in table.find():
            date.append(i.get('date'))
            volume.append(i.get('volume'))

        ret = {
            'date': date,
            'volume': volume,
            'code': 200
        }
        return Response(ret)
vue代码:
主要是将数据库中的数据通过axios请求获取后端数据通过eCharts渲染到前端
安装eCharts:npm install echarts @4.9.0
eCharts官方网址:https://echarts.apache.org/zh/tutorial.html#
在这里可以选择样式:https://echarts.apache.org/zh/option.html#series-candlestick
注意:这里会有一个坑安装npm install echarts --save这个会报错建议安装 4.9.0版本的
然后在main.js中全局配置:
//全局引入eCharts
import echarts from 'echarts'
Vue.prototype.$echarts = echarts;
现在上vue的代码:
<template>
     <div>
     <!-- 为ECharts准备一个具备大小(宽高)的Dom -->
     <div id="main" style=" 600px;height:400px;"></div>
    </div>
</template>

<script>
  import {getStock} from '@/http/api'

  export default {
    //注册子组件
    components: {
      Breadcrumb,
    },
    name: "eCharts-manage",
    data() {
      return {
        date: [],
        volume: [],
      }
    },
    methods: {
      drawChart() {
        // 基于准备好的dom,初始化echarts实例
        let myChart = this.$echarts.init(document.getElementById("main"));
        // 指定图表的配置项和数据
        let option = {
          title: {
            text: "股票"
          },
          tooltip: {},
          legend: {},
          xAxis: {
            type: "category",
            data: this.date
          },
          yAxis: {},
          series: [
            {
              name: "销量",
              type: "line",
              data: this.volume
            },
          ]
        };
        // 使用刚指定的配置项和数据显示图表。
        myChart.setOption(option);
      },
      //从后端获取股票数据绘制折线图
      getStock() {
        getStock().then(res => {
          this.date = res.data.date;
          this.volume = res.data.volume;
          // console.log(this.date, '111111111111111111111');
          // console.log(this.volume, '2222222222222222222222');
          //重新渲染图表
          this.drawChart();
          console.log(res);
        }).catch(errors => {
          console.log(errors)
        })
      },
    },
    mounted() {
      this.getStock();
    },
  };
</script>
<style scoped>
</style>
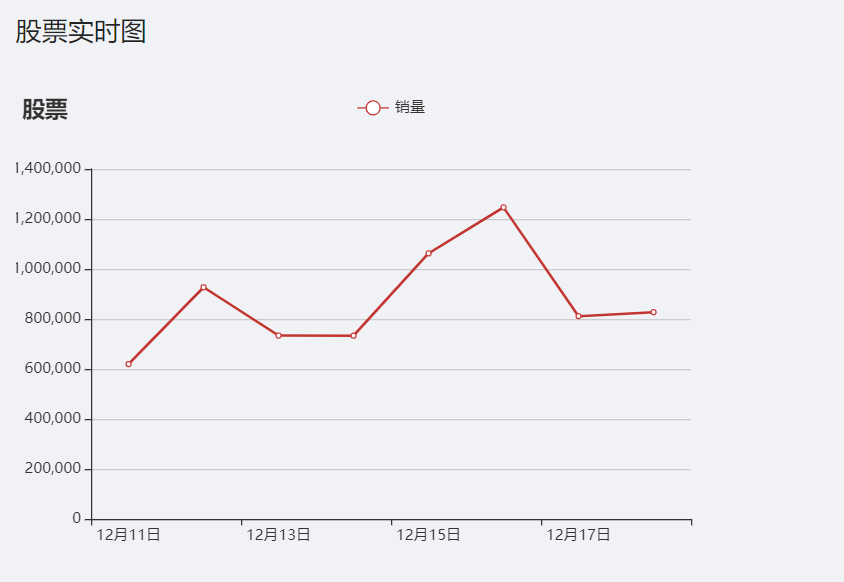
效果图: