一、Logstash收集日志
1.Logstash的配置文件
[root@web01 ~]# vim /etc/logstash/logstash.yml
path.config: /etc/logstash/conf.d

#默认是这个目录
2.logstash收集日志文件到文件
[root@web01 ~]# vim /etc/logstash/conf.d/file_file.conf
input {
  file {
    path => "/var/log/messages"
    start_position => "beginning"
  }
}
output {
  file {
    path => "/tmp/messages_%{+YYYY-MM-dd}.log"
  }
}

#配置文件的名字,通常以'文件名_es.conf'命名,
#%{}表示变量,%{+YYYY-MM-DD}表示今年的第多少天
#配置文件使用的是yml语法
#虚拟机关机之后,开机的时候一定要同步时间
3.logstash收集日志文件到ES
[root@web01 ~]# vim /etc/logstash/conf.d/file_es.conf
input {
  file {
    path => "/var/log/messages"
    start_position => "beginning"
  }
}
output {
  elasticsearch {
    hosts => ["172.16.1.51:9200","10.0.0.52:9200"]
    index => "messages_%{+YYYY-MM-dd}"
  }
}
4.Logstash收集多日志到文件
[root@web01 ~]# vim /etc/logstash/conf.d/file_file.conf
input {
  file {
    type => "messages_log"
    path => "/var/log/messages"
    start_position => "beginning"
  }
  file {
    type => "secure_log"
    path => "/var/log/secure"
    start_position => "beginning"
  }
}
output {
  if [type] == "messages_log" {
    file {
      path => "/tmp/messages_%{+YYYY-MM-dd}.log"
    }
  }
  if [type] == "secure_log" {
    file {
      path => "/tmp/secure_%{+YYYY-MM-dd}.log"
    }
  }
}
5.Logstash收集多日志到ES
1)方法一:
[root@web01 ~]# vim /etc/logstash/conf.d/more_es.conf
input {
  file {
    type => "messages_log"
    path => "/var/log/messages"
    start_position => "beginning"
  }
  file {
    type => "secure_log"
    path => "/var/log/secure.log"
    start_position => "beginning"
  }
}

output {
  if [type] == "messages_log" {
    elasticsearch {
      hosts => ["10.0.0.51:9200","10.0.0.52:9200"]
      index => "messages_%{+YYYY-MM-dd}"
    }
  }
  if [type] == "secure_log" {
    elasticsearch {
      hosts => ["10.0.0.51:9200","10.0.0.52:9200"]
      index => "secure_%{+YYYY-MM-dd}"
    }
  }
}

[root@web01 ~]# /usr/share/logstash/bin/logstash -f /etc/logstash/conf.d/more_es.conf &

#启动后查看页面,使用ntp验证管道
2)方法二:
[root@web01 ~]# vim /etc/logstash/conf.d/more_es_2.conf
input {
  file {
    type => "messages_log"
    path => "/var/log/messages"
    start_position => "beginning"
  }
  file {
    type => "secure_log"
    path => "/var/log/secure.log"
    start_position => "beginning"
  }
}
output {
  elasticsearch {
    hosts => ["10.0.0.51:9200","10.0.0.52:9200"]
    index => "%{type}_%{+YYYY-MM-dd}"
  }
}

#启动多实例
[root@web01 ~]# /usr/share/logstash/bin/logstash -f /etc/logstash/conf.d/more_es_2.conf
3)启动多实例
#创建不同的数据目录
[root@web01 ~]# mkdir /data/logstash/more_es_2 -p
[root@web01 ~]# mkdir /data/logstash/more_es -p

#启动时使用--path.data指定数据目录
[root@web01 ~]# /usr/share/logstash/bin/logstash -f /etc/logstash/conf.d/more_es.conf --path.data=/data/logstash/more_es &
[root@web01 ~]# /usr/share/logstash/bin/logstash -f /etc/logstash/conf.d/more_es_2.conf --path.data=/data/logstash/more_es_2 &

#如果资源充足,可以使用多实例收集多日志,如果服务器资源不足,启动不了多实例,配置一个文件收集多日志启动
二、Logstash收集Tomcat日志
1.安装Tomcat
1.安装java环境
[root@web01 ~]# rpm -ivh jdk-8u181-linux-x64.rpm
2.上传包
[root@web01 ~]# rz apache-tomcat-10.0.0-M7.tar.gz
3.解压
[root@web01 ~]# tar xf apache-tomcat-10.0.0-M7.tar.gz -C /usr/local/
4.做软连接
[root@web01 ~]# ln -s /usr/local/apache-tomcat-10.0.0-M7 /usr/local/tomcat
5.启动Tomcat
[root@web01 ~]# /usr/local/tomcat/bin/startup.sh && tailf /usr/local/tomcat/logs/catalina.out
6.访问页面 10.0.0.7:8080

#tomcat默认日志格式
10.0.0.1 - - [13/Aug/2020:16:51:51 +0800] "GET /random.jsp HTTP/1.1" 200 178

#catalina.out是Tomcat的启动日志,可以在这查看Tomcat是否启动成功
[root@web01 ~]# ls /var/log/tomcat/
catalina.2020-08-13.log     			#报错日志
localhost_access_log.2020-08-13.txt 	#Tomcat的访问日志
catalina.out				#启动日志
manager.2020-08-13.log
host-manager.2020-08-13.log
localhost.2020-08-13.log
2.配置Logstash收集Tomcat日志到文件
[root@web01 ~]# vim /etc/logstash/conf.d/tomcat_file.conf
input {
  file {
    path => "/usr/local/tomcat/logs/localhost_access_log.*.txt"
    start_position => "beginning"
  }
}
output {
  file {
    path => "/tmp/tomcat_%{+YYYY-MM-dd}.log"
  }
}

#input插件中,不识别%{}变量,但是可以识别*
#logstash只会收集发改变的文件,收集文件一次之后,如果文件内容不变的话,logstash是不会再次收集的(类似于增量复制)
3.配置Logstash收集Tomcat日志到ES
[root@web01 ~]# vim /etc/logstash/conf.d/tomcat_es.conf
input {
  file {
    path => "/usr/local/tomcat/logs/localhost_access_log.*.txt"
    start_position => "beginning"
  }
}
output {
  elasticsearch {
    hosts => ["10.0.0.51:9200"]
    index => "tomcat_%{+YYYY-MM-dd}.log"
  }
}


#注意,Tomcat的日志的路径
#该配置只适用于Tomcat正确日志,因为Tomcat正确日志是一条一条的,可以直接使用file插件收集,Tomcat一条错误日志有多行,所以不能再使用该配置
三、收集Tomcat日志修改格式
#问题
收集tomcat日志,当遇到报错时,一条'报错会被分割成很多条'数据,不方便查看

#解决方法:
1.修改tomcat日志格式为json(也就是把Tomcat一个日志变成一条,{"a":"b","c":"d"}),#Tomcat直接把报错日志变成为一条
	1)开发修改输出日志为json
	2)修改tomcat配置,日志格式为json
2.使用logstash的input插件下的mutiline模块,#从logstash管道把一条Tomcat报错日志变成一条
1.方法一:修改tomcat日志格式
1)配置tomcat日志为json格式
[root@web01 ~]# vim /usr/local/tomcat/conf/server.xml
#把原来的日志格式注释,添加我们的格式,注释标签为<!-- -->
<Valve className="org.apache.catalina.valves.AccessLogValve" directory="logs"
prefix="tomcat_access_json." suffix=".log"
pattern="{"clientip":"%h","ClientUser":"%l","authenticated":"%u","AccessTime":"%t","method":"%r","status":"%s","SendBytes":"%b","Query?string":"%q","partner":"%{Referer}i","AgentVersion":"%{User-Agent}i"}"/>
2)重启tomcat
[root@web01 ~]# /usr/local/tomcat/bin/shutdown.sh
[root@web01 ~]# /usr/local/tomcat/bin/startup.sh
3)配置收集新的tomcat日志
[root@web01 ~]# vim /etc/logstash/conf.d/tomcat_json_es.conf
input {
file {
path => "/usr/local/tomcat/logs/tomcat_access_json.*.log"
start_position => "beginning"
}
}
output {
elasticsearch {
hosts => ["10.0.0.51:9200"]
index => "tomcat_json_%{+YYYY-MM-dd}.log"
}
}
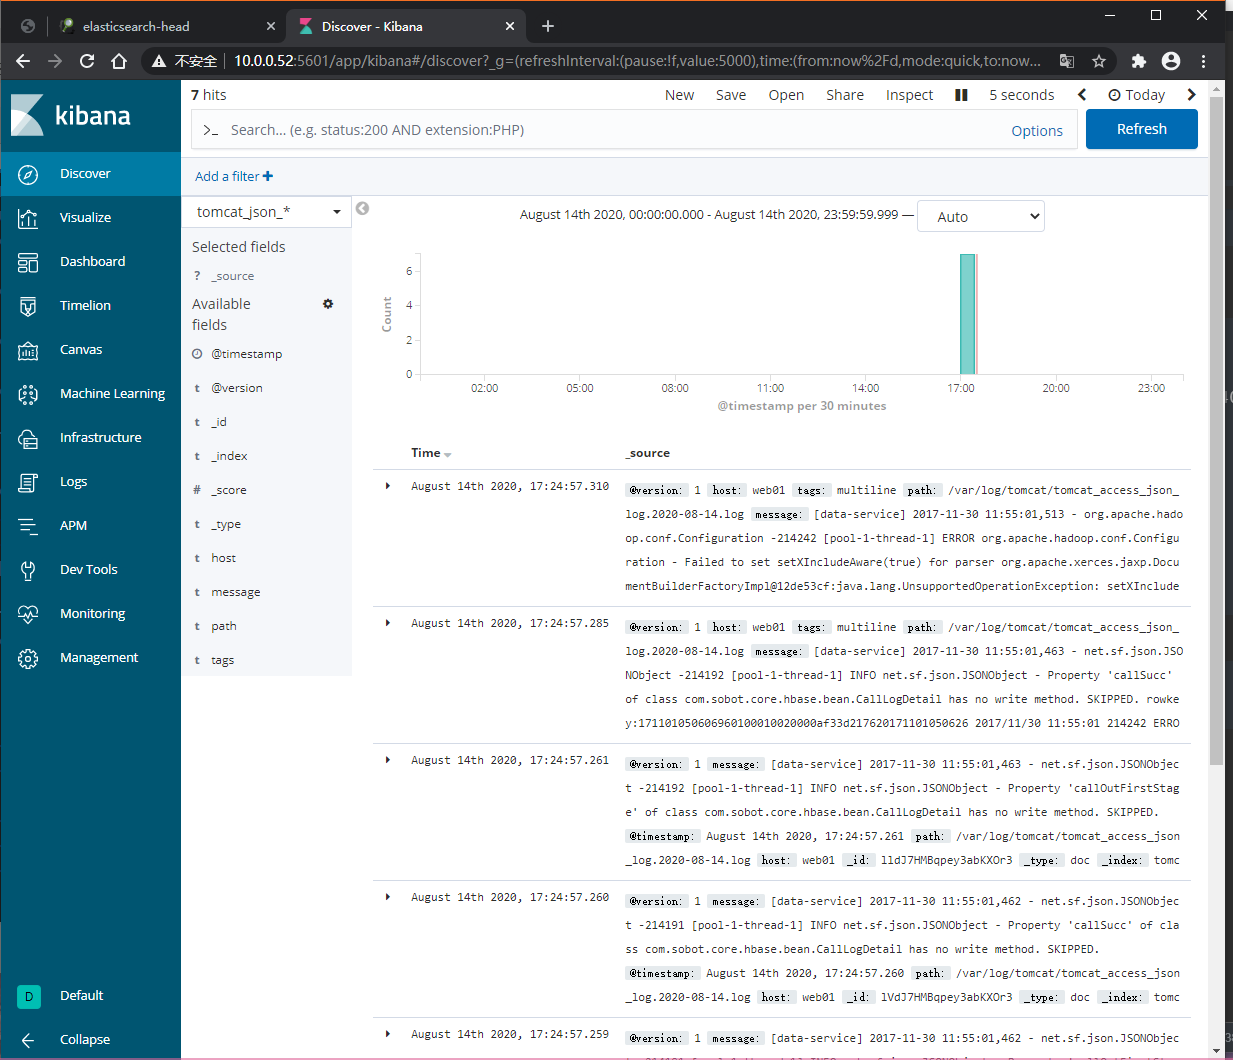
#通过kibana可以看到,Tomcat一条报错日志被归为一条,所以kibana中,一条报错日志以一条的形式显示
#启动logstash之前,需要删除es中tomcat_json_%{+YYYY-MM-dd}.log索引
2.方法二:使用mutiline模块收集日志
1)配置收集日志测试
[root@web01 ~]# vim /etc/logstash/conf.d/test_mutiline.conf
input {
  stdin {
    codec => multiline {
	  #以[开头
      pattern => "^["
      #匹配到[
      negate => true
      #碰到[向上合并是previous,向下合并是next
      what => "previous"
    }
  }
}
output {
  stdout {
    codec => json
  }
}

#测试,输入内容不会直接输出,当遇到以 [ 开头才会收集以上的日志
2)配置收集tomcat日志
[root@web01 ~]# vim /etc/logstash/conf.d/tomcat_mutiline.conf
input {
  file {
    path => "/usr/local/tomcat/logs/tomcat_access_json.*.log"
    start_position => "beginning"
    codec => multiline {
      pattern => "^["
      negate => true
      what => "previous"
    }
  }
}

output {
  elasticsearch {
    hosts => ["10.0.0.51:9200"]
    index => "tomcat_json_%{+YYYY-MM-dd}"
    codec => "json"
  }
}
3)将tomcat报错日志写入
[root@web01 ~]# cat 1.txt >> /usr/local/tomcat/logs/tomcat_access_json.2020-08-14.log
4)页面查看数据,然后把报错给开发
四、收集Nginx日志
1.安装Nginx
[root@web01 ~]# yum install -y nginx
2.配置Nginx日志格式
[root@web01 ~]# vim /etc/nginx/nginx.conf
... ...
http {
    log_format  json  '{"@timestamp":"$time_iso8601",'
                      '"host":"$server_addr",'
                      '"clientip":"$remote_addr",'
                      '"size":$body_bytes_sent,'
                      '"responsetime":$request_time,'
                      '"upstreamtime":"$upstream_response_time",'
                      '"upstreamhost":"$upstream_addr",'
                      '"http_host":"$host",'
                      '"url":"$uri",'
                      '"referer":"$http_referer",'
                      '"agent":"$http_user_agent",'
                      '"status":"$status"}';

    access_log  /var/log/nginx/access.log  json;
... ...
3.配置收集Nginx日志
[root@web01 ~]# vim /etc/logstash/conf.d/nginx_json.conf
input {
  file {
    path => "/var/log/nginx/access.log"
    start_position => "beginning"
  }
}
output {
  elasticsearch {
    hosts => ["10.0.0.51:9200"]
    index => "nginx_json_%{+YYYY-MM-dd}.log"
  }
}

#kibana显示内容
host:web01 message:{"@timestamp":"2020-08-14T16:44:49+08:00","host":"10.0.0.7","clientip":"10.0.0.1","size":555,"responsetime":0.000,"upstreamtime":"-","upstreamhost":"-","http_host":"10.0.0.7","url":"/favicon.ico","referer":"-","agent":"Mozilla/5.0 (Windows NT 10.0; WOW64) AppleWebKit/537.36 (KHTML, like Gecko) Chrome/78.0.3904.108 Safari/537.36","status":"404"} path:/var/log/nginx/access.log @version:1
五、获取的日志参数分离
1.方法一:
1)修改tomcat日志收集配置
[root@web01 ~]# vim /etc/logstash/conf.d/tomcat_json_es.conf
input {
file {
path => "/usr/local/tomcat/logs/tomcat_access_json.*.log"
start_position => "beginning"
}
}
#把收集到的数据进行处理
filter {
json {
source => "message"
remove_field => ["message"]
}
}
output {
elasticsearch {
hosts => ["10.0.0.51:9200"]
index => "tomcat_json_%{+YYYY-MM-dd}.log"
}
}
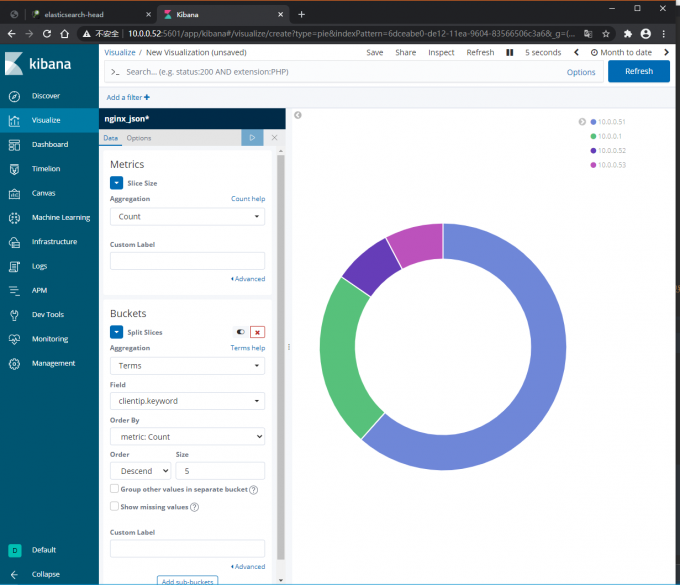
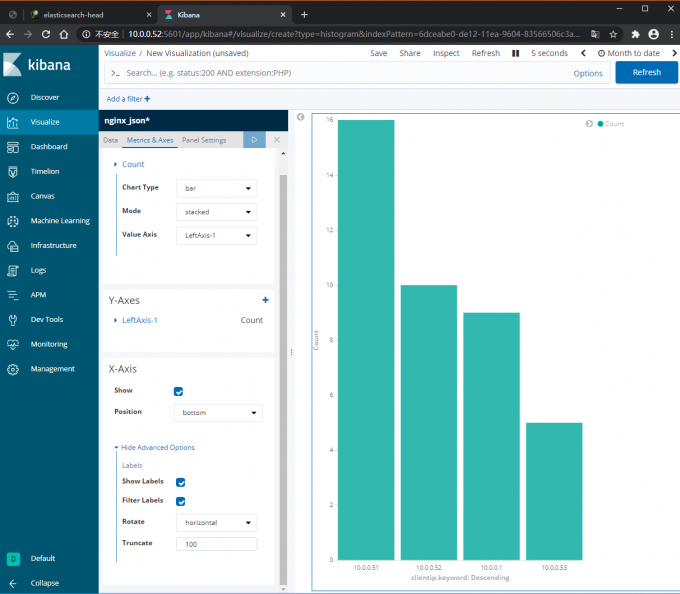
#kibana中,Jason数据才能做图
#注意,配置filter,一定要刷新kibana中的management中的索引,这样kibana才能识别新生成的字段,进而可以做图
#message数据已经拆分,数据还在,去掉message数据
#使用filter插件删除多余的字段filter
2.方法二:
1)修改收集Nginx日志的配置
#nginx不需要配置修改获取日志,只需要收集同时修改格式即可,当然也可以使用filter的方式
[root@web01 ~]# vim /etc/logstash/conf.d/nginx_json.conf
input {
  file {
    path => "/var/log/nginx/access.log"
    start_position => "beginning"
    codec => "json"
  }
}
output {
  elasticsearch {
    hosts => ["10.0.0.51:9200"]
    index => "nginx_json_%{+YYYY-MM-dd}.log"
  }
}
六、Logstash收集日志写入redis
1.安装redis
2.配置将数据写入redis
[root@web01 ~]# vim /etc/logstash/conf.d/nginx_to_redis.conf
input {
  file {
    path => "/var/log/nginx/access.log"
    start_position => "beginning"
    codec => "json"
  }
}
output {
  redis {
    host => "172.16.1.51"
    port => "6379"
    data_type => "list"
    db => "0"
    key => "nginx_log"
  }
}

#如果redis有密码,password => 123
#虽然设置了beginning,但是redis只会存储管道做好后新访问的json value

LLEN nginx_log
lrande nginx_log 0 -1
redis-cli --raw
作业:
1.恢复快照,重新搭建ELK集群
2.收集Nginx日志,普通日志和json格式日志到不同索引
3.收集tomcat日志,普通日志和json格式日志到不同索引
4.收集tomcat错误日志
收集nginx一般日志(访问日志或把报错日志都适用)
#nginx默认日志
[root@web01 conf.d]# vim /var/log/nginx/access.log
10.0.0.1 - - [15/Aug/2020:14:53:11 +0800] "GET /favicon.ico HTTP/1.1" 404 555 "-" "Mozilla/5.0 (Windows NT 10.0; WOW64) AppleWebKit/537.36 (KHTML, like Gecko) Chrome/78.0.3904.108 Safari/537.36" "-"
10.0.0.1 - - [15/Aug/2020:14:53:12 +0800] "GET / HTTP/1.1" 200 13 "-" "Mozilla/5.0 (Windows NT 10.0; WOW64; Trident/7.0; rv:11.0) like Gecko" "-"
10.0.0.1 - - [15/Aug/2020:14:53:13 +0800] "GET /favicon.ico HTTP/1.1" 404 153 "-" "Mozilla/5.0 (Windows NT 10.0; WOW64; Trident/7.0; rv:11.0) like Gecko" "-"

#logstash收集nginx日志,只能收集管道搭建好之后的日志
[root@web01 conf.d]# vim /etc/logstash/conf.d/nginx_es.conf
input {
  file {
    path => "/var/log/nginx/access.log"
    start_position => "beginning"
  }
}
output {
  elasticsearch {
    hosts => ["10.0.0.51:9200","10.0.0.52:9200"]
    index => "nginx_es_%{+YYYY-MM-dd}.log"
  }
}

#kibana查看数据格式
	10.0.0.1 - - [15/Aug/2020:15:57:36 +0800] "GET /favicon.ico HTTP/1.1" 404 555 "http://10.0.0.7/" "Mozilla/5.0 (Windows NT 10.0; WOW64) AppleWebKit/537.36 (KHTML, like Gecko) Chrome/84.0.4147.105 Safari/537.36" "-"
收集nginx json格式数据
#nginx json格式数据
[root@web01 ~]# vim /etc/nginx/nginx.conf
... ...
http {
    log_format  json  '{"@timestamp":"$time_iso8601",'
                      '"host":"$server_addr",'
                      '"clientip":"$remote_addr",'
                      '"size":$body_bytes_sent,'
                      '"responsetime":$request_time,'
                      '"upstreamtime":"$upstream_response_time",'
                      '"upstreamhost":"$upstream_addr",'
                      '"http_host":"$host",'
                      '"url":"$uri",'
                      '"referer":"$http_referer",'
                      '"agent":"$http_user_agent",'
                      '"status":"$status"}';

    access_log  /var/log/nginx/access.log  json;
... ...

#nginx查看日志格式
{"@timestamp":"2020-08-16T13:21:22+08:00","host":"10.0.0.7","clientip":"10.0.0.1","size":0,"responsetime":0.000,"upstreamtime":"-","upstreamhost":"-","http_host":"10.0.0.7","url":"/index.html","referer":"-","agent":"Mozilla/5.0 (Windows NT 10.0; WOW64) AppleWebKit/537.36 (KHTML, like Gecko) Chrome/84.0.4147.105 Safari/537.36","status":"304"}

#logstash收集nginx日志
[root@web01 ~]# vim /etc/logstash/conf.d/nginx_json.conf
input {
  file {
    path => "/var/log/nginx/access.log"
    start_position => "beginning"
  }
}
output {
  elasticsearch {
    hosts => ["10.0.0.51:9200"]
    index => "nginx_es_json_%{+YYYY-MM-dd}"
  }
}

#kibana查看数据格式
{"@timestamp":"2020-08-16T13:21:22+08:00","host":"10.0.0.7","clientip":"10.0.0.1","size":0,"responsetime":0.000,"upstreamtime":"-","upstreamhost":"-","http_host":"10.0.0.7","url":"/index.html","referer":"-","agent":"Mozilla/5.0 (Windows NT 10.0; WOW64) AppleWebKit/537.36 (KHTML, like Gecko) Chrome/84.0.4147.105 Safari/537.36","status":"304"}
收集Tomcat访问日志
[root@web01 ~]# vim /etc/logstash/conf.d/tomcat_es.conf
input {
  file {
    path => "/usr/local/tomcat/logs/localhost_access_log.*.txt"
    start_position => "beginning"
  }
}
output {
  elasticsearch {
    hosts => ["10.0.0.51:9200"]
    index => "tomcat_%{+YYYY-MM-dd}.log"
  }
}

#kibana查看数据格式
收集Tomcat报错日志
#方法一
1.修改Tomcat配置文件
[root@web01 ~]# vim /usr/local/tomcat/conf/server.xml
#把原来的日志格式注释,添加我们的格式,注释标签为<!-- -->
<Valve className="org.apache.catalina.valves.AccessLogValve" directory="logs"
prefix="tomcat_access_json." suffix=".log"
pattern="{"clientip":"%h","ClientUser":"%l","authenticated":"%u","AccessTime":"%t","method":"%r","status":"%s","SendBytes":"%b","Query?string":"%q","partner":"%{Referer}i","AgentVersion":"%{User-Agent}i"}"/>
2.编辑logstash配置文件
[root@web01 ~]# vim /etc/logstash/conf.d/tomcat_json_es.conf
input {
file {
path => "/usr/local/tomcat/logs/tomcat_access_json.*.log"
start_position => "beginning"
}
}
output {
elasticsearch {
hosts => ["10.0.0.51:9200"]
index => "tomcat_json_%{+YYYY-MM-dd}"
}
}
#方法二
[root@web01 ~]# vim /etc/logstash/conf.d/tomcat_mutiline.conf
input {
file {
path => "/usr/local/tomcat/logs/tomcat_access_json.*.log"
start_position => "beginning"
codec => multiline {
pattern => "^["
negate => true
what => "previous"
}
}
}
output {
elasticsearch {
hosts => ["10.0.0.51:9200"]
index => "tomcat_json_%{+YYYY-MM-dd}"
codec => "json"
}
}
收集Tomcat访问日志 json格式
[root@web01 ~]# vim /usr/local/tomcat/conf/server.xml
#把原来的日志格式注释,添加我们的格式,注释标签为<!-- -->
<Valve className="org.apache.catalina.valves.AccessLogValve" directory="logs"
prefix="tomcat_access_json." suffix=".log"
pattern="{"clientip":"%h","ClientUser":"%l","authenticated":"%u","AccessTime":"%t","method":"%r","status":"%s","SendBytes":"%b","Query?string":"%q","partner":"%{Referer}i","AgentVersion":"%{User-Agent}i"}"/>
#查看Tomcat日志
{"client":"10.0.0.1", "client user":"-", "authenticated":"-", "access time":"[16/Aug/2020:13:50:16 +0800]", "method":"GET / HTTP/1.1", "status":"304", "send bytes":"-", "Query?string":"", "partner":"-", "Agent version":"Mozilla/5.0 (Windows NT 10.0; WOW64; Trident/7.0; rv:11.0) like Gecko"}
#使用mutiline插件,收集Tomcat日志
[root@web01 ~]# vim /etc/logstash/conf.d/tomcat_mutiline.conf
input {
file {
path => "/var/log/tomcat/localhost_access_log.*.txt"
start_position => "beginning"
}
}
output {
elasticsearch {
hosts => ["10.0.0.51:9200"]
index => "tomcat_es_json_%{+YYYY-MM-dd}"
}
}
#使用kibana查看日志
{"client":"10.0.0.1", "client user":"-", "authenticated":"-", "access time":"[16/Aug/2020:13:50:03 +0800]", "method":"GET / HTTP/1.1", "status":"304", "send bytes":"-", "Query?string":"", "partner":"-", "Agent version":"Mozilla/5.0 (Windows NT 10.0; WOW64; Trident/7.0; rv:11.0) like Gecko"}