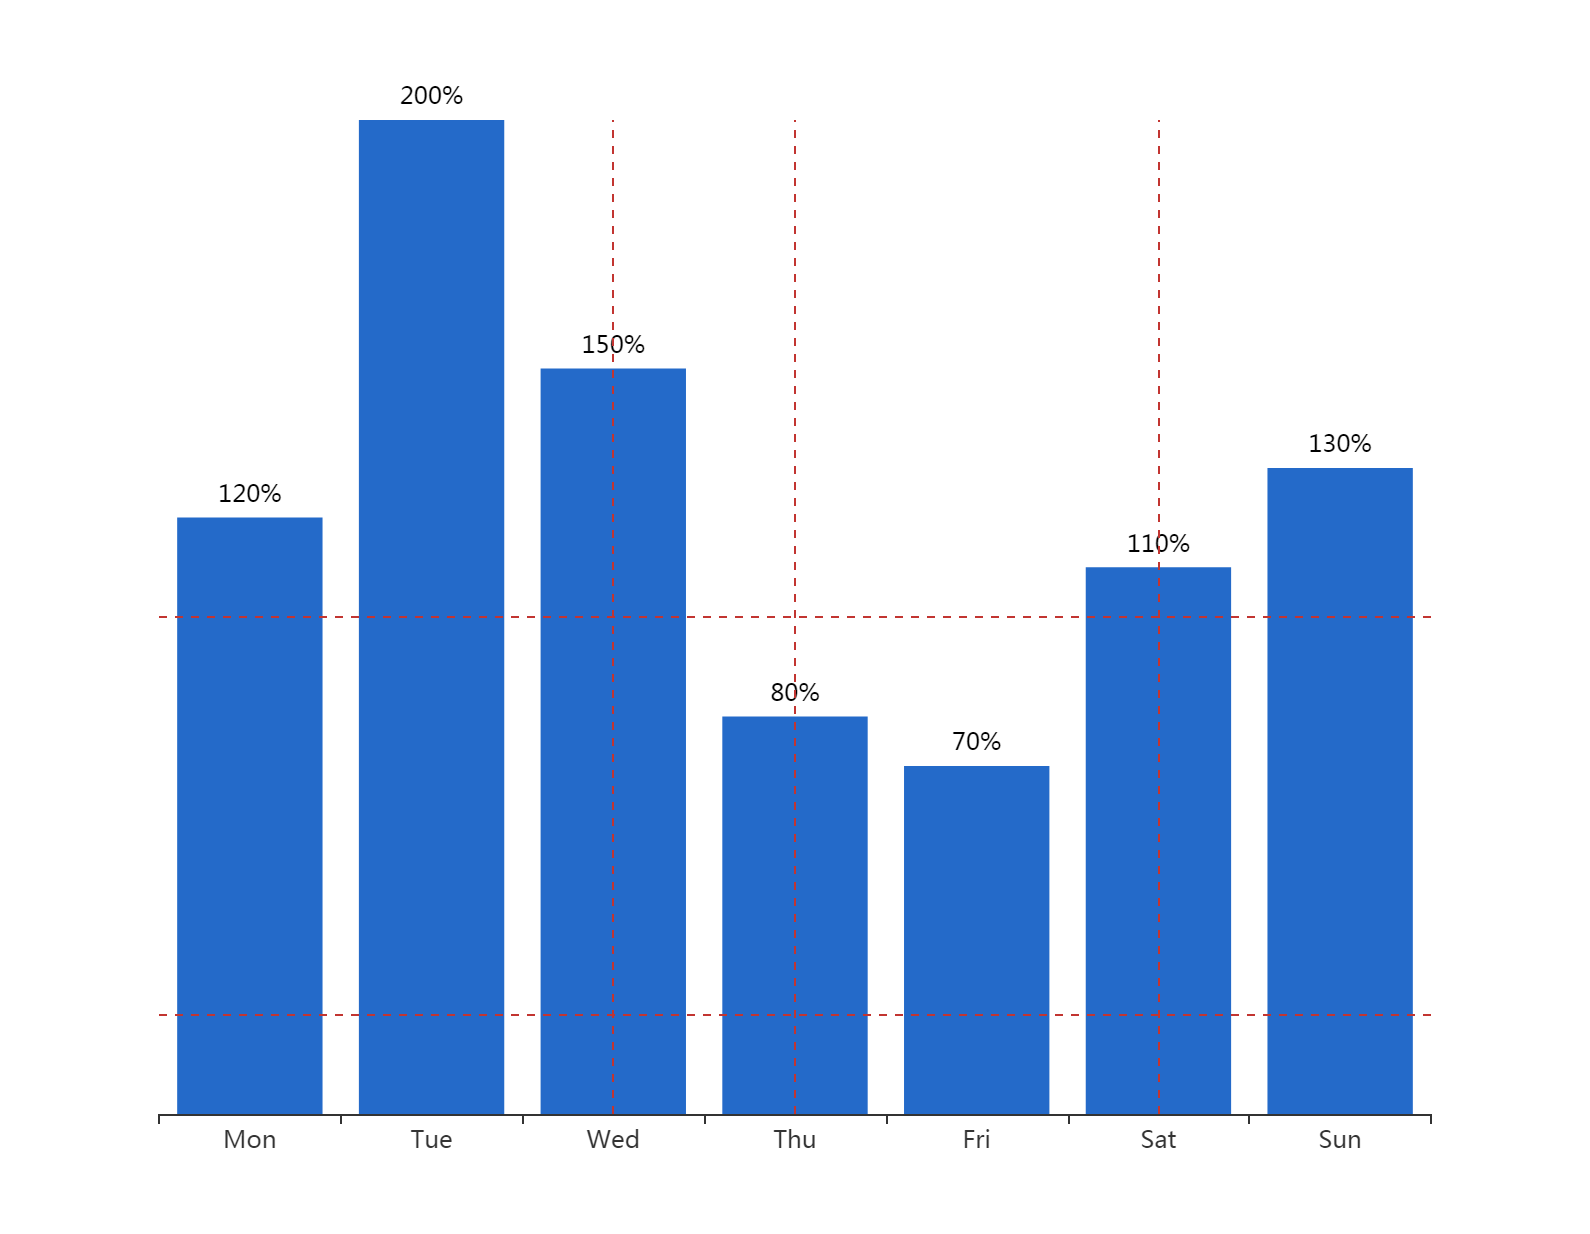
• echarts图表配置


    1.柱状图

    option = {
        xAxis: {
            type: 'category',
            data: ['Mon', 'Tue', 'Wed', 'Thu', 'Fri', 'Sat', 'Sun']
        },
        toolbox: {
                //show: true,
                itemSize: 20,
                itemGap: 30,
                right: 50,
                feature: {
                    dataView: {show:true},
                    saveAsImage: {
                        //excludeComponents :['toolbox'],
                        pixelRatio: 2
                    }
                }
    },
        yAxis: {
            type: 'value',
            show: false,
            splitLine: {
                show: true,
            }
        },
        series: [{
            data: [120, 200, 150, 80, 70, 110, 130],
            type: 'bar',
            markLine: {
                    symbol: ['none', 'none'],
                    label: {show: false},
                    data: [
                        {yAxis: 20},
                        {yAxis: 100},
                        {xAxis: 2},
                        {xAxis: 3},
                        {xAxis: 5},
                        {xAxis: 7}
                    ]
                },
            itemStyle: {
    	normal: {
    		color: function(params) {
    			return '#246AC9';
    		},
    		label: {
    			show: true,
    			position: 'top',
    			textStyle: {
    				color: "black"
    			},
    			formatter: '{c}%'
    		}
    	}
    }
        }]
    };


    option = {
        xAxis: {
            type: 'category',
            boundaryGap: false
        },
        yAxis: {
            type: 'value',
            boundaryGap: [0, '30%']
        },
          toolbox: {
                //show: true,
                itemSize: 20,
                itemGap: 30,
                right: 50,
                feature: {
                    dataView: {show:true},
                    saveAsImage: {
                        //excludeComponents :['toolbox'],
                        pixelRatio: 2
                    }
                }
    },
        visualMap: {
            type: 'piecewise',
            show: false,
            dimension: 0,
            seriesIndex: 0,
            pieces: [{
                gt: 1,
                lt: 3,
                color: 'rgba(0, 180, 0, 0.5)'
            }, {
                gt: 5,
                lt: 7,
                color: 'rgba(0, 180, 0, 0.5)'
            }]
        },
        series: [
            {
                type: 'line',
                smooth: 0.6,
                symbol: 'none',
                lineStyle: {
                    color: 'green',
                     5
                },
                markLine: {
                    symbol: ['none', 'none'],
                    label: {show: false},
                    data: [
                        {yAxis: 100},
                        {yAxis: 300},
                        {xAxis: 2},
                        {xAxis: 3},
                        {xAxis: 5},
                        {xAxis: 7}
                    ]
                },
                areaStyle: {},
                data: [
                    ['2019-10-10', 200],
                    ['2019-10-11', 400],
                    ['2019-10-12', 650],
                    ['2019-10-13', 500],
                    ['2019-10-14', 250],
                    ['2019-10-15', 300],
                    ['2019-10-16', 450],
                    ['2019-10-17', 300],
                    ['2019-10-18', 100]
                ]
            }
        ]
    };


    option ={
      xAxis: {
        type: 'category',
        data: ['AA', 'BB'],
        axisLabel: {
           fontSize: 12,
          color: (value) => {
            // return value == '第一个' ? 'green' : 'red';
            return 'black'
          }
        },
        axisLine: {
          lineStyle: {
            type: 'dashed',
            color: '#ccc', // X轴线的颜色
             '1' // 坐标线的宽度
          }
        }
      },
      yAxis: {
        type: 'value',
        show: false,
        splitLine: {
          show: true,
        }
      },
      grid: { // 控制距離上下左右距離
        left: -10, // 配合设置barWidth
        right: 10,
        top: 35,
        bottom: 80,
        containLabel: true
      },
      series: [{
        data: [100, 31],
        type: 'bar',
        barWidth: 18,
        // barGap: '10%',
        // /*多个并排柱子设置柱子之间的间距*/
        // barCategoryGap: '20%',
        // /*多个并排柱子设置柱子之间的间距*/
        markLine: {
          symbol: ['none', 'none'],
          itemStyle: {
            normal: {
              lineStyle: {
                // type: 'solid',
                color: '#4a4c56', // 控制辅助线的颜色
                opacity: 0.5
              },
              label: {
                show: false, // 控制辅助线是否显示后边的东西
                position: 'end'
              }
            },
          },
          label: {
            show: false
          },
          data: [{
              yAxis: 25
            }, {
              yAxis: 50
            }, {
              yAxis: 75
            },
            {
              yAxis: 100
            }
          ]
        },
        itemStyle: {
          normal: {
            color: (params) => {
              console.log(params)
              // return '#fff'; // 控制柱狀條的顏色
              var colorList = ['#0263ff', '#00ffff', '#64BD3D', '#EE9201', '#29AAE3', '#B74AE5', '#0AAF9F', '#E89589', '#16A085', '#4A235A', '#C39BD3 ', '#F9E79F', '#BA4A00', '#ECF0F1', '#616A6B', '#EAF2F8', '#4A235A', '#3498DB'];
              return colorList[params.dataIndex]
            },
            label: {
              show: true,
              position: 'top',
              textStyle: {
                color: "white" // 控制頂部文字的顏色
              },
              formatter: '{c}%'
            }
          }
        }
      }]
    };
    

    //  let myChart = echarts.init(document.getElementById('main'))
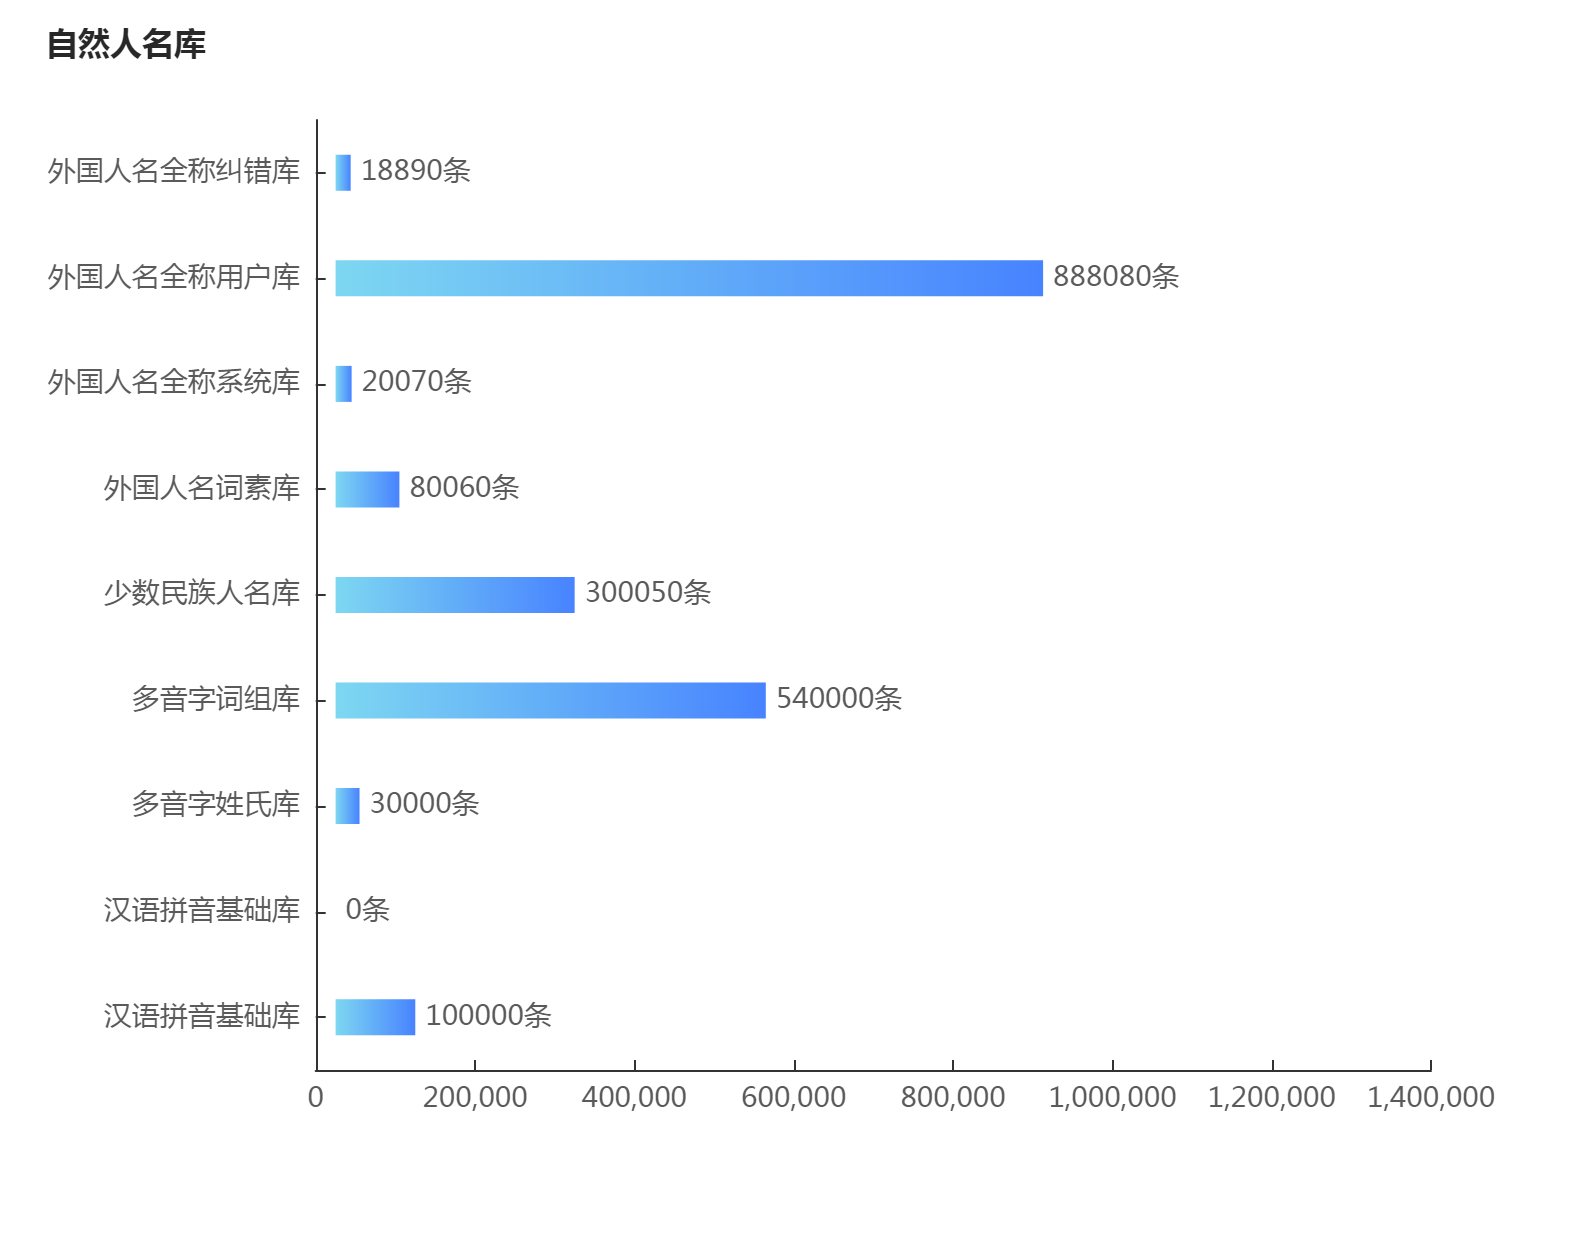
            let data = [100000, 0, 30000, 540000, 300050, 80060, 20070, 888080, 18890]
            let yAxisData = ['汉语拼音基础库', '汉语拼音基础库', '多音字姓氏库', '多音字词组库', '少数民族人名库', '外国人名词素库', '外国人名全称系统库', '外国人名全称用户库', '外国人名全称纠错库']
           option = {
                title: {
                    text: '自然人名库',
                    left: 18,
                    top: 10,
                    textStyle: {
                        color: '#282828',
                        fontSize: 16
                    }
                },
                color: ['#3398DB'],
                fontSize: 14,
                tooltip: {
                    trigger: 'axis',
                    axisPointer: { // 坐标轴指示器,坐标轴触发有效
                        type: 'shadow' // 默认为直线,可选为:'line' | 'shadow'
                    }
                },
                toolbox: {
                //show: true,
                itemSize: 20,
                itemGap: 30,
                right: 50,
                feature: {
                    dataView: {show:true},
                    saveAsImage: {
                        //excludeComponents :['toolbox'],
                        pixelRatio: 2
                    }
                }
    },
                grid: {
                    left: '3%',
                    containLabel: true
                },
                xAxis: [{
                    type: 'value',
                    splitLine: {
                        show: false
                    },
                    max: 1400000,
                    splitNumber: 8,
                    axisTick: {
                        alignWithLabel: true,
                        inside: true,
                        lengt: 6
                    },
                    axisPointer: {
                        type: 'none'
                    },
                    axisLabel: {
                        textStyle: {
                            color: '#5A5A5A',
                            fontSize: 14
                        }
                    }
                }],
                yAxis: [{
                    type: 'category',
                    data: yAxisData,
                    axisTick: {
                        alignWithLabel: true,
                        inside: true
                    },
                    axisLabel: {
                        textStyle: {
                            color: '#5A5A5A',
                            fontSize: 14
                        }
                    }
                }],
                series: [{
                    name: 'assist',
                    type: 'bar',
                    stack: '1',
                    itemStyle: {
                        normal: {
                            barBorderColor: 'rgba(0,0,0,0)',
                            color: 'rgba(0,0,0,0)'
                        },
                        emphasis: {
                            barBorderColor: 'rgba(0,0,0,0)',
                            color: 'rgba(0,0,0,0)'
                        }
                    },
                    tooltip: {
                        trigger: 'none'
                    },
                    data: [25000, 25000, 25000, 25000, 25000, 25000, 25000, 25000, 25000]
                }, {
                    name: '总条数',
                    type: 'bar',
                    stack: '1',
                    barWidth: 18, // 柱子宽度
                    itemStyle: {
                        normal: {
                            label: {
                                formatter: '{c}' + '条', // 自定义柱顶显示内容
                                show: true,
                                position: 'right',
                                color: '#5A5A5A',
                                fontSize: 14
                            },
                            color: new echarts.graphic.LinearGradient( // 五个参数,前四个参数分别对应“右/下/左/上”,渐变开始的位置
                                0, 0, 1, 0, [{
                                    offset: 0,
                                    color: '#7DD7F1'
                                }, {
                                    offset: 0.25,
                                    color: '#70C2F5'
                                }, {
                                    offset: 0.5,
                                    color: '#62ADF8'
                                }, {
                                    offset: 0.75,
                                    color: '#5598FC'
                                }, {
                                    offset: 1,
                                    color: '#4783FF'
                                }]
                            )
                        }
                    },
                    data: data
                }]
            }
    

    这个来自https://wobuzy.com/2019/11/27/echarts-bar.html

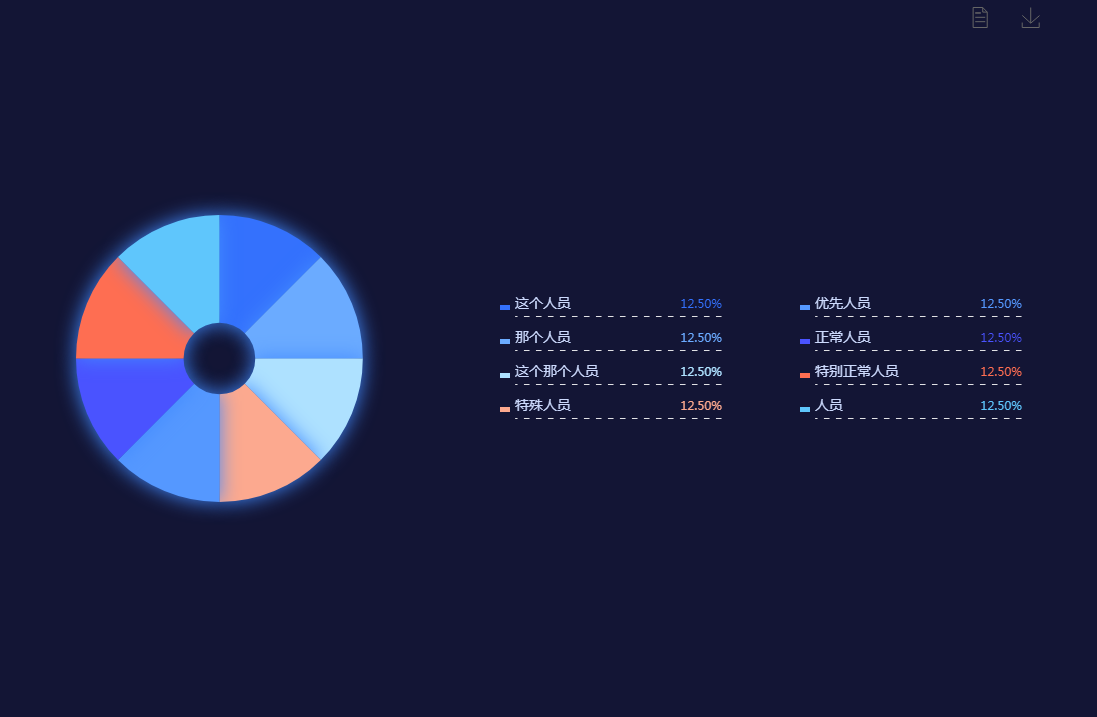
    好看的legend添加不同色块+文字跳色

    let pieSource = {
            '这个人员': 335,
            '那个人员': 335,
            '这个那个人员': 335,
            '特殊人员': 335,
            '优先人员': 335,
            '正常人员': 335,
            '特别正常人员': 335,
            '人员': 335,
        },
        legendColor = ["#3471fd", "#6babff", "#aee1ff", "#fca98f", "#5598ff", "#4a53ff", "#fe6e52", "#5fc6fc"],
        richStyle = {};
    
    function initData(source) {
        legendColor.map((item, index) => {
            richStyle['style' + index] = {};
            richStyle['style' + index]['color'] = item;
            richStyle['style' + index]['align'] = 'right';
        });
        if (Object.prototype.toString.call(source) === '[object Object]') {
            const arr = [];
            const legendData = [];
            Object.entries(source).forEach((value) => {
                legendData.push(value[0]);
                let obj = {};
                obj.name = value[0];
                obj.value = value[1];
                arr.push(obj);
            });
            source = arr;
            return {
                source,
                legendData
            };
        } else if (source && Object.prototype.toString.call(source) === '[object Array]') {
            let legendData = [];
            source.forEach((item, index) => {
                legendData.push(item.name);
            });
            return {
                source,
                legendData
            };
        }
    }
    source = initData(pieSource);
    option = {
        backgroundColor: '#131535',
         toolbox: {
                //show: true,
                itemSize: 20,
                itemGap: 30,
                right: 50,
                feature: {
                    dataView: {show:true},
                    saveAsImage: {
                        //excludeComponents :['toolbox'],
                        pixelRatio: 2
                    }
                }
    },
        tooltip: {
            trigger: 'item',
            textStyle: {
                color: '#fff',
                // fontSize:28
            },
            formatter: "{a} <br/>{b} : {c} ({d}%)"
        },
        color: legendColor,
        legend: [{
                orient: 'vertical',
                left: 500,
                y: 'center',
                icon: 'rect',
                textStyle: {
                    color: '#cddafd',
                    fontSize: 14,
                    rich: richStyle,
                     207,
                    height: 20,
                    backgroundColor: {
                        image: '/asset/get/s/data-1545016257824-mxLqGjr4z.png',
                    },
                },
                padding: [30, 0, 30, 0],
                itemWidth: 10,
                itemHeight: 5,
                itemGap: 20,
                data: source.legendData.slice(0, 4),
                formatter: function(name) {
                    let oa = option.series[0].data;
                    let total = 0;
                    oa.forEach((item, index) => {
                        total += item.value;
                    });
                    for (let i = 0; i < oa.length; i++) {
                        if (name == oa[i].name) {
                            // return name + '  ' + '{style'+i+'|' + (oa[i].value / total * 100).toFixed(2) + '%}';
                            return name + '{style' + i + '|' + (oa[i].value / total * 100).toFixed(2) + '%}';
                        }
                    }
                },
            },
            {
                orient: 'vertical',
                left: 800,
                y: 'center',
                icon: 'rect',
                textStyle: {
                    color: '#cddafd',
                    fontSize: 14,
                    rich: richStyle,
                     207,
                    height: 20,
                    backgroundColor: {
                        image: '/asset/get/s/data-1545016257824-mxLqGjr4z.png',
                    },
                },
                padding: [30, 0, 30, 0],
                itemWidth: 10,
                itemHeight: 5,
                itemGap: 20,
                data: source.legendData.slice(4),
                formatter: function(name) {
                    let oa = option.series[0].data;
                    let total = 0;
                    oa.forEach((item, index) => {
                        total += item.value;
                    });
                    for (let i = 0; i < oa.length; i++) {
                        if (name == oa[i].name) {
                            return name + '  ' + '{style' + i + '|' + (oa[i].value / total * 100).toFixed(2) + '%}';
                        }
                    }
                },
            }
        ],
        series: [{
            name: '重点人员',
            type: 'pie',
            radius: ['10%', '40%'],
            center: ['20%', '50%'],
            data: source.source,
            itemStyle: {
                normal: {
                    label: {
                        show: false
                    },
                    shadowColor: '#438bff',
                    shadowBlur: 20
                },
            }
        }]
    };
    
  • 相关阅读:
    EF Power Tools
    ntsysv命令
    chpasswd 批量更新用户口令
    at定时执行任务命令详解
    shell
    为什么使用 shell 编程
    shell
    redis cluster 3.0
    CSS命名规则规范整理
    log4j:WARN No appenders could be found for logger
  • 原文地址:https://www.cnblogs.com/sugartang/p/13915306.html
Copyright © 2020-2023  润新知