前言
Tablesaw是一个用来进行数据分析和可视化显示的java库,这里是官方文档,类似python中的Pandas库。
引入maven依赖
<dependency>
   <groupId>tech.tablesaw</groupId>
   <artifactId>tablesaw-jsplot</artifactId>
   <version>0.38.1</version>
</dependency>
简单使用
自己创建行列数据
import tech.tablesaw.api.IntColumn;
import tech.tablesaw.api.StringColumn;
import tech.tablesaw.api.Table;

public class TestTable {

  public static void main(String[] args) {
    String[] students = {"小明", "小华", "小红"};
    //语文分数
    int[] chineseScores = {76, 63, 87};
    //数学分数
    int[] mathScores = {90, 84, 99};
    //英语分数
    int[] englishScores = {76, 63, 87};
    Table table = Table.create("学生分数统计表").addColumns(
        StringColumn.create("姓名", students),
        IntColumn.create("语文分数", chineseScores),
        IntColumn.create("数学分数", mathScores),
        IntColumn.create("英语分数", englishScores)
    );
    System.out.println(table.print());
  }
}
制作数据表格,输出为
             学生分数统计表
 姓名  |  语文分数  |  数学分数  |  英语分数  |
---------------------------------
 小明  |    76  |    90  |    76  |
 小华  |    63  |    84  |    63  |
 小红  |    87  |    99  |    87  |
从CSV文件中读取数据
关于csv文件格式的介绍,student_csv.csv文件内容如下
学生,语文分数,数学分数,英语分数
小明,86,90,76
小华,93,84,63
小红,72,99,87
import java.io.IOException;
import tech.tablesaw.api.Table;

public class TestCsvTable {

  public static void main(String[] args) throws IOException {
    Table table = Table.read().file("D:/Temp/student_csv.csv");
    System.out.println(table.print());
  }
}
从excel文件中读取数据
需要引入操作excel的maven依赖
<dependency>
  <groupId>tech.tablesaw</groupId>
  <artifactId>tablesaw-excel</artifactId>
  <version>0.38.1</version>
</dependency>
excel文件内容如下

import java.io.IOException;
import tech.tablesaw.api.Table;

public class TestExcelTable {

  public static void main(String[] args) throws IOException {
    Table table = Table.read().file("D:/Temp/students.xlsx");
    System.out.println(table.print());
  }
}
内部使用Apache的POI库来操作excel。
数据过滤和汇总
import java.io.IOException;
import tech.tablesaw.aggregate.AggregateFunctions;
import tech.tablesaw.api.QuerySupport;
import tech.tablesaw.api.Table;

public class TestTableStatistics {

  public static void main(String[] args) throws IOException {
    Table table = Table.read().csv("D:/Temp/student_csv.csv");
    //过滤语文分数大于等于80的学生
    Table filterResult = table
        .where(QuerySupport.all(t -> t.intColumn("语文分数").isGreaterThanOrEqualTo(80)));
    System.out.println(filterResult);
    //统计语文分数的平均值,最大值和最小值
    Table summarizeResult = table
        .summarize("语文分数", AggregateFunctions.mean, AggregateFunctions.max, AggregateFunctions.min)
        .apply();
    System.out.println(summarizeResult);
  }

}
输出为
         student_csv.csv
 学生  |  语文分数  |  数学分数  |  英语分数  |
---------------------------------
 小明  |    86  |    90  |    76  |
 小华  |    93  |    84  |    63  |
              student_csv.csv summary
    Mean [语文分数]     |  Max [语文分数]  |  Min [语文分数]  |
---------------------------------------------------
 83.66666666666667  |          93  |          72  |
数据可视化
import java.io.IOException;
import tech.tablesaw.api.Table;
import tech.tablesaw.plotly.Plot;
import tech.tablesaw.plotly.components.Figure;
import tech.tablesaw.plotly.components.Layout;
import tech.tablesaw.plotly.traces.BarTrace;
import tech.tablesaw.plotly.traces.BarTrace.Orientation;

public class TestTableVisualzation {

  public static void main(String[] args) throws IOException {
    dataVisualization();
  }

  private static void dataVisualization() throws IOException {
    Table table = createTable();
    Layout layout = Layout.builder()
        .title("学生分数统计表")
        .height(700)
        .width(900)
        .build();
    Figure figure = new Figure(layout,
        createBarTrace(table, "语文分数"),
        createBarTrace(table, "数学分数"),
        createBarTrace(table, "英语分数"));
    Plot.show(figure);
  }

  private static Table createTable() throws IOException {
    return Table.read().csv("D:/Temp/student_csv.csv");
  }

  private static BarTrace createBarTrace(Table table, String numberColumnName) {
    return BarTrace.builder(table.categoricalColumn("学生"), table.numberColumn(numberColumnName))
        .orientation(Orientation.VERTICAL)
        .name(numberColumnName)
        .build();
  }

}
根据数据创建条形图
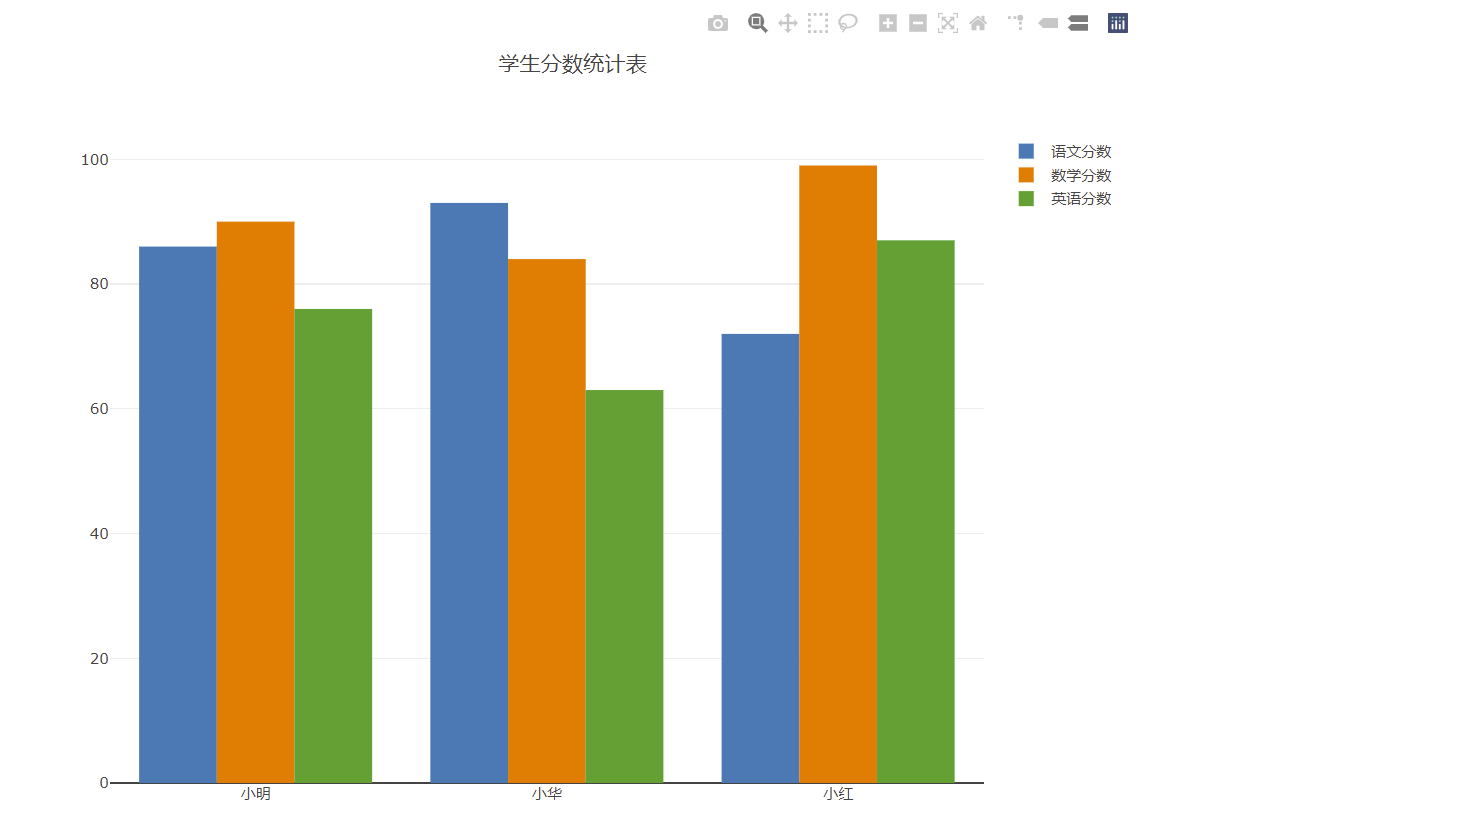
内部使用 pebble模板引擎 来生成HTML文件,关于创建更多类型的图表,请查看官方文档。