在小程序项目中需要用到echarts图表
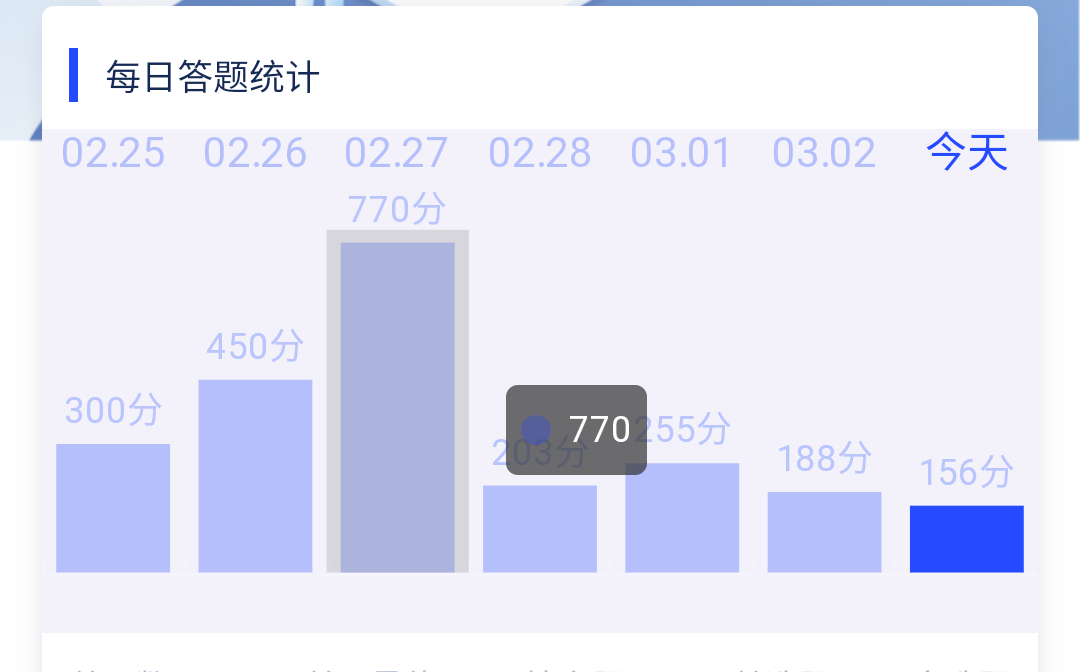
但是展示的时候遇到了问题 图表高度失真 体验感非常差

经过一番查找实验,终于找到了解决方案
下面上代码!
function initChart(canvas, width, height,dpr) {
const chart = echarts.init(canvas, null, {
width,
height: height,
devicePixelRatio: dpr //解决小程序视图模糊的问题,必写
});
canvas.setChart(chart);
var checkName = '今天';
var dataLength = 14; //默认的数据长度,既真实数组的长度,必须设置,长度来源:后台传输
//这里是echart基础配置
var option = {
backgroundColor: 'rgba(25,1,169,.05)',
tooltip: {
trigger: 'axis',
axisPointer: {
type: 'shadow',
backgroundColor: 'rgba(245, 245, 245, 1)',
borderWidth: 1,
// padding: 10,
}
},
dataZoom: [{
show: false, //是否显示下方滚动条
realtime: true,
startValue: dataLength - 7,
endValue: dataLength - 1, //显示数据结束位置
},
{
type: 'inside',
realtime: true,
startValue: dataLength - 7,
endValue: dataLength - 1, //显示数据结束位置
}
],
grid: {
top: '20%',
right: '0',
left: '0',
bottom: '12%'
},
xAxis: [{
type: 'category',
data: ['02.25', '02.26', '02.27', '02.28', '03.01', '03.02', '03.02', '02.25', '02.26', '02.27', '02.28', '03.01', '03.02', '今天'],
axisLine: {
lineStyle: {
color: 'rgba(255,255,255,0.12)'
}
},
position: 'top',
axisLabel: {
color: function(params) {
//通过判断选中的名字改变柱子的颜色样式
if (checkName === params) {
return 'rgba(38,74,255,1)';
} else {
return 'rgba(38,74,255,.3)';
}
},
textStyle: {
fontSize: 14
},
padding: [10, 0]
},
}],
yAxis: [{
show: false,
axisLabel: {
formatter: '{value}',
color: '#e2e9ff',
},
axisLine: {
show: false
},
splitLine: {
lineStyle: {
color: 'rgba(255,255,255,0.12)'
}
}
}],
series: [{
type: 'bar',
data: [300, 450, 770, 203, 255, 188, 156, 300, 450, 770, 203, 255, 188, 156],
// itemStyle: {
// normal: {
// color: 'rgba(38,74,255,.3)',
// }
// },
itemStyle: {
normal: {
label: {
show: true
},
color: function(params) {
//通过判断选中的名字改变柱子的颜色样式
if (checkName === params.name) {
return 'rgba(38,74,255,1)';
} else {
return 'rgba(38,74,255,.3)';
}
}
}
},
label: {
normal: {
show: true,
position: 'top',
textStyle: {
color: '#B9C5FC',
fontSize: '12'
},
formatter: '{c}分'
}
}
}]
};
chart.setOption(option);
return chart;
}
在小程序的data里面调用
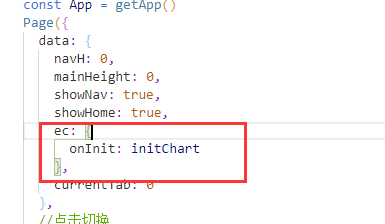
这样就解决了 解决后的效果图